Building An Amazon Marketing Cloud Clean Room

Enhancing Data Privacy & Collaboration With A Private, Trusted Amazon Marketing Cloud Clean Room

The term “Data Clean Rooms (DCRs)” is often used in conjunction with descriptions of Amazon Marketing Cloud. But what, exactly, is a DCR? A DCR provides a protected setting where various organizations or sections of a single organization can collectively analyze data while adhering to specific rules and limitations to ensure data security.

AMC Clean Room and Cloud DSP

Amazon offers what they describe as an “Amazon Marketing Cloud Clean Room” to house the data and an interface to issue SQL queries. However, a DCR is not limited to the Amazon Ads AMC.

Did you realize platforms like Snowflake, Google BigQuery, Databricks, and others can also operate as an Amazon DCR? They can! This means there are two types of clean rooms available;

  1. Amazon Ads developed and managed AMC Clean Room
  2. Cloud Platform Clean Room (Snowflake, Google BigQuery, Databricks, AWS Clean Rooms, and many others)

We will go into the variations on each below.

Amazon Marketing Cloud “Clean Room”

AMC’s integration with Cloud DSP (Demand-Side Platform) is built and managed by the Amazon Ads team, on top of AWS infrastructure.

The Amazon Ads AMC DCR environment allows advertisers to combine and analyze their data with aggregated, anonymized Amazon data without compromising user privacy. The clean room concept is particularly relevant in an era where data privacy concerns are paramount. It provides a secure space where advertisers can glean insights from vast datasets while adhering to stringent data privacy standards.

This powerful tool enables advertisers to buy display, video, and audio ads programmatically. Integrating Cloud DSP within AMC offers a seamless experience for managing advertising campaigns across Amazon’s ecosystem and beyond. Teams can unify sales and marketing data from sources like Amazon Selling Partner, Amazon Advertising, Google Ads, Facebook Marketing, Shopify, and many others to private DCRs in data lakes or cloud warehouses.

This feature is particularly beneficial for businesses looking to enhance their reach and impact across various platforms while maintaining control and visibility over their campaigns.

Private, Trusted, Owned Cloud Data Warehouse Platform Clean Room

Unlike the Amazon Ads AMC Clean Room, platform-based DCRs do not have Amazon DSP requirements. You have full control and flexibility to define what resides in your DCR and how it should be used.

Example BigQuery Clean Room Model

Using platforms like Snowflake, Google BigQuery, Azure, AWS, and Databricks, these types of solutions offer substantial benefits for data-clean rooms (DCR) and non-DCR use cases.

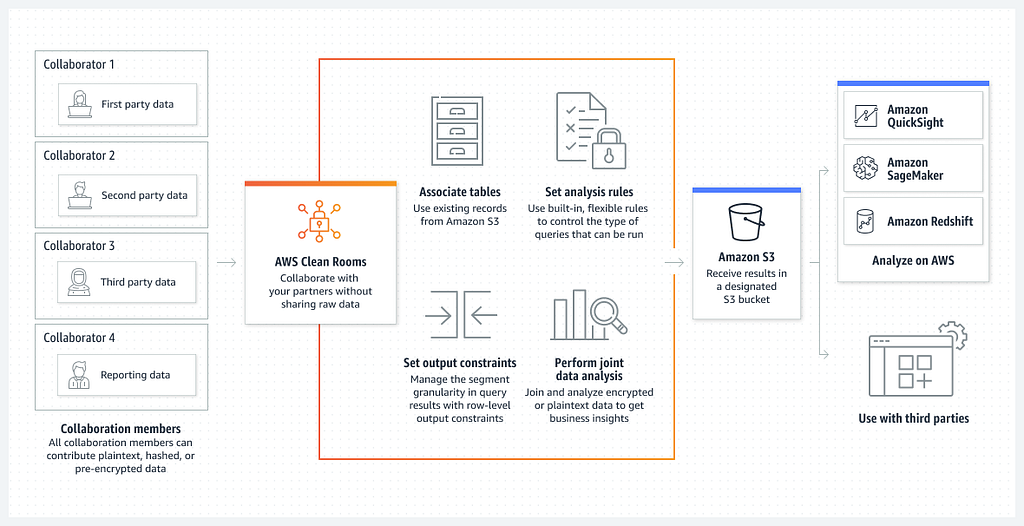
In DCR scenarios, these tools ensure data security and privacy, a critical aspect of compliance with regulations like GDPR and CCPA. They enable secure data sharing and collaboration within an organization and with external partners without exposing sensitive raw data.

This is particularly beneficial for projects that require joint data insights while maintaining strict data privacy.

Databricks Clean Room Reference Model

For non-DCR use cases, these platforms offer a unified data environment that is highly scalable and efficient. They can handle large volumes of data, making them ideal for advanced analytics and machine learning tasks across various business functions.

AWS Clean Room Model

Their flexibility in integrating with diverse data sources and formats makes them versatile tools for various data management needs. Comprehensive data governance ensures accuracy and consistency, enhancing overall data quality and supporting responsible data usage across different business applications.

Industry Standard, Robust Ecosystems

The robust ecosystem surrounding data warehouse solutions like Snowflake, Google BigQuery, Azure, AWS, and Databricks significantly enhances their utility.

They are natively supported by a wide range of data visualization, machine learning, reporting, query, and business intelligence (BI) tools, enabling comprehensive data analysis and insight generation. Get the data you need to fuel your favorite reporting, data visualization, SQL, or data science tools like Tableau, Microsoft Power BI, Looker, Amazon Quicksight, SAP, SAS, and others.

These integrations with advanced analytics and machine learning tools allow businesses to derive deeper insights from their data, facilitating data-driven decision-making.

The compatibility with various data visualization and BI tools makes it easier for businesses to interpret complex data sets and effectively communicate findings across the organization.

This ecosystem streamlines the data analysis and empowers businesses to leverage their data clean room environment for strategic advantage, optimizing operations and enhancing customer experiences.

Take the next step — for free

Want to activate BigQuery, Snowflake, Databricks, Amazon Athena, and Azure Data Lake clean rooms? You can create clean rooms in minutes and quickly analyze datasets with your partners.

Openbridge offers code-free, fully automated data pipelines to a private, trusted cloud warehouse or data lake clean room. With your data unified, you can use your favorite analytic tools like Power BI, Looker, Tableau, and others for internal teams or external partners.

By providing advertisers with automated, direct first-party data, Openbridge accelerates the speed at which your team's team can collaborate, share, and gain valuable insights that deliver data-driven growth and profit.

Get a 30-day free trial of the code-free Openbridge data integration for Amazon Advertising, Amazon Selling Partner, and Amazon Vendor Central.


Building An Amazon Marketing Cloud Clean Room was originally published in Openbridge on Medium, where people are continuing the conversation by highlighting and responding to this story.


from Openbridge - Medium https://ift.tt/hicvgST
via IFTTT

What is a good ACoS on Amazon?

Amazon ACoS insights

The Amazon Seller’s Playbook: Defining a ‘Good’ Amazon ACoS for Maximum Profit

We recently covered the topic of TACoS in Data-Driven Amazon TACoS Insights for Sellers and Vendors using Amazon Advertising. For this post we shift focus to another key metric: Amazon ACoS.

What is a good ACoS? Reference By Product Category

What is a good ACoS for Amazon PPC ?A good Advertising Cost of Sale (ACoS) on Amazon can vary widely depending on the category of products, the market’s competitiveness, and the seller’s goals.

The reference values below are based on standard ACoS calculation:

  • ACOS = (ad spend ÷ ad revenue) x 100

Below are a number of reference point categorizing ACoS percentages by product category. These are guideposts to illustrate Amazon’s average ACoS benchmarks for the following categories. The data is source from Amazon Brand Metric reports. (Note: These numbers can vary daily, so reference the latest data sets from Amazon on the topic):

Appliances

  • Top 25%: 12%
  • Typical: 16%
  • Bottom 25%: 17%

Arts, Crafts & Sewing

  • Top 25%: 12%
  • Typical: 17%
  • Bottom 25%: 20%

Automotive

  • Top 25%: 20%
  • Typical: 28%
  • Bottom 25%: 39%

Baby

  • Top 25%: 23%
  • Typical: 35%
  • Bottom 25%: 55%

Beauty & Personal Care

  • Top 25%: 18%
  • Typical: 29%
  • Bottom 25%: 50%

Clothing, Shoes & Jewelry

  • Top 25%: 15%
  • Typical: 20%
  • Bottom 25%: 30%

Electronics

  • Top 25%: 10%
  • Typical: 16%
  • Bottom 25%: 25%

Grocery & Gourmet Food

  • Top 25%: 20%
  • Typical: 29%
  • Bottom 25%: 46%

Grocery Store

  • Top 25%: 18%
  • Typical: 25%
  • Bottom 25%: 35%

Health & Household

  • Top 25%: 20%
  • Typical: 30%
  • Bottom 25%: 45%

Health & Personal Care

  • Top 25%: 15%
  • Typical: 25%
  • Bottom 25%: 44%

Home & Garden

  • Top 25%: 15%
  • Typical: 20%
  • Bottom 25%: 30%

Home & Kitchen

  • Top 25%: 18%
  • Typical: 25%
  • Bottom 25%: 35%

Industrial & Scientific

  • Top 25%: 25%
  • Typical: 35%
  • Bottom 25%: 45%

Musical Instruments

  • Top 25%: 13%
  • Typical: 19%
  • Bottom 25%: 29%

Office Products

  • Top 25%: 20%
  • Typical: 35%
  • Bottom 25%: 45%

Patio, Lawn & Garden

  • Top 25%: 13%
  • Typical: 19%
  • Bottom 25%: 28%

Sports & Outdoors

  • Top 25%: 12%
  • Typical: 22%
  • Bottom 25%: 34%

Tools & Home Improvement

  • Top 25%: 16%
  • Typical: 25%
  • Bottom 25%: 35%

Toys & Games

  • Top 25%: 11%
  • Typical: 16%
  • Bottom 25%: 26%

As you can see, the low ACoS for one category will differ from the high ACoS for another. So, what is a good ACoS for Amazon Ads for one brand may be poor for a different brand in an alternate category. As a result, a target ACoS should be defined relative to your business benchmarks and the category for which you operate. If you are not using Brand Metrics already, you may want to start looking at this data from Amazon.

Why Is Amazon ACoS Important?

Generally, a lower ACoS indicates a more efficient advertising spend relative to sales, but the ideal ACoS can depend on your specific business objectives.

  1. For Profit Maximization: If your goal is to maximize profit, a good ACoS is typically lower than your profit margin. This ensures that your advertising costs don’t eat into your profits. For instance, if your profit margin is 30%, you would ideally want an ACoS lower than 30%.
  2. For Market Penetration or Brand Awareness: If you are more focused on gaining market share or building brand awareness, you might be willing to accept a higher ACoS. You invest in future sales or brand recognition rather than immediate profitability.
  3. Industry Benchmarks: ACoS also varies by industry. Some products have higher average ACoS due to intense competition or higher costs per click (CPC). It’s helpful to research industry benchmarks for a more accurate picture of what constitutes a good ACoS in your specific market.
  4. Balancing ACoS with Other Metrics: While ACoS is an important metric, it should be considered alongside other key performance indicators like total sales, conversion rate, and return on ad spend (ROAS). A balanced approach ensures you’re not overly focusing on one metric at the expense of overall business health.
  5. Dynamic Nature of ACoS: Remember that ACoS can fluctuate based on various factors like seasonality, changes in competition, and Amazon’s platform changes. Regularly reviewing and adjusting your strategies based on current data is essential.

Ultimately, a good ACoS on Amazon aligns with your business goals, whether maximizing immediate profitability, investing in long-term brand growth, or balancing various performance metrics. It’s crucial to continuously monitor and adjust your advertising strategies to maintain an optimal ACoS.

Amazon Data sets for data-driven ACoS analytics

Optimizing Amazon Advertising Campaigns for Sellers and Vendors ensures efficient ad revenue requires data. Amazon Ads offers a collection of data feeds to assist with those insights efforts:

In addition to Amazon Ads data, there is a broad collection of retail information available:

What are the challenges to achieving a good ACoS on Amazon?

Achieving a reasonable Advertising Cost of Sale (ACoS) on Amazon can be challenging due to several factors:

  • High Competition: Many product categories on Amazon are highly competitive. More sellers bidding for the same keywords can significantly increase the cost per click (CPC). This can lead to a higher ACoS, especially in popular categories or trending products.
  • Keyword Optimization: Selecting the right keywords is crucial for effective advertising. The challenge lies in identifying keywords that are not only relevant but also cost-effective. Overly broad keywords can lead to irrelevant traffic and low conversion rates, while particular keywords might have lower search volumes.
  • Budget Constraints: Smaller businesses or new sellers might have limited advertising budgets. This constraint can make it difficult to compete with established sellers who can afford to spend more on advertising and absorb higher ACoS for extended periods.
  • Changing Market Trends and Consumer Preferences: Consumer trends and preferences can change rapidly. Keeping up with these changes and adjusting advertising strategies is a constant challenge. What works today might not be effective tomorrow.
  • Product Pricing and Profit Margins: Products with lower profit margins are more sensitive to advertising costs. Even a relatively low ACoS can be too high if the profit margin is slim. Pricing strategies must be carefully balanced with advertising spend.
  • Amazon’s Algorithm Changes: Amazon regularly updates its algorithms, which can affect how products are displayed and how ads perform. These unpredictable changes may require sellers to adapt their strategies continuously.
  • Ad Campaign Management Skills: Effective management of Amazon ad campaigns requires skill and experience. This includes understanding different ad format targeting options and using Amazon’s analytics tools effectively. For those new to Amazon advertising, there is a learning curve to overcome.
  • Seasonality and Market Fluctuations: Sales and advertising effectiveness can vary greatly depending on the season or current market conditions. This fluctuation requires sellers to adapt their strategies throughout the year, which can be challenging, especially for products with seasonal demand.
  • Brand Awareness and Product Reviews: New or lesser-known brands may struggle to achieve a good ACoS compared to well-established brands. Positive product reviews and strong brand awareness can significantly improve conversion rates, but building these takes time and effort.
  • Inventory Management: Running successful ad campaigns can lead to increased sales, but if inventory management isn’t aligned, it can result in stockouts, leading to lost sales opportunities and potentially increased ACoS when ads run while products are out of stock.

How to reduce ACoS on Amazon

Let’s look at the data

Using ACoS is one of many KPIs for the efficiency of your Amazon Ad Campaign. Reducing ACoS not only improves the profitability of ad sales but also enhances the overall health of your Amazon sales strategy.

Here are some opportunities on how to reduce ACoS on Amazon:

  1. Optimize Your Product Listings: Amazon Listing Optimization is crucial. A well-optimized product page with high-quality images, detailed descriptions, and relevant keywords can improve organic sales, reducing reliance on Sponsored Ads for revenue. This balance between organic sales and ad sales helps maintain a lower ACoS.
  2. Focus on High-Performing Keywords: Analyze your Amazon Seller Central data to identify which keywords are driving sales. Investing more in these keywords in your Amazon Advertising Campaigns can yield better returns, thus lowering the ACoS.
  3. Leverage Amazon Sponsored Brand and Sponsored Display Ads: These advertising formats can help increase visibility and drive more targeted traffic to your product page, potentially increasing sales revenue and decreasing the ACoS.
  4. Monitor and Adjust Total Ad Spend: Regularly review your total ad spend concerning the sales revenue generated. Keeping a close eye on this ratio helps make informed decisions about where to allocate your advertising budget most effectively.
  5. Analyze and Compare with Amazon Benchmark: Regularly compare your category’s ACoS with the Amazon Benchmark. Understanding where you stand about the average can guide you in adjusting your strategies to align with or outperform the benchmark.
  6. Adjust Product Cost and Pricing Strategy: If feasible, reviewing and adjusting the product cost can be a strategy. A competitive pricing strategy can lead to an increase in sales volume, potentially lowering the ACoS.
  7. Utilize Amazon FBA: For many sellers, using Amazon Fulfillment by Amazon (FBA) can lead to increased sales due to the Prime eligibility of products, which can help in reducing ACoS.
  8. Integrate with Other Platforms like Google Ads: Integrating your Amazon Ad Campaign with other platforms like Google Ads can drive additional traffic to your Amazon product page, potentially increasing sales and lowering ACoS.
  9. Experiment with Different Advertising Campaign Types: Don’t just stick to one type of campaign. Experiment with different kinds of Amazon Sponsored Ads to see which ones yield the best return on investment.
  10. Conduct Regular Campaign Audits: Regular audits of your Amazon Advertising Campaigns can uncover inefficiencies and areas for optimization. This continuous improvement process is vital to maintaining a healthy ACoS.

Reducing ACoS on Amazon requires a multifaceted approach that combines Amazon Listing Optimization, strategic advertising, and continuous performance monitoring. By focusing on these areas, Amazon Sellers can effectively lower their ACoS, leading to more profitable advertising campaigns and a healthier balance between organic sales and ad-driven revenue.

Get Started

No more manual file downloads to calculate TACoS, ROAS, ACoS, and other Amazon KPIs. Pair all of your Amazon Ads campaign data sets with Amazon Retail data feeds for a 360 view of your Seller or Vendor business.

Openbridge will collect, catalog, and unify to a private, trusted industry-leading cloud data warehouses and lakes like Azure, Snowflake, BigQuery, AWS, or Databricks. One your Amazon data is unified, you can use your favorite analytic tools like Power BI, Looker, Tableau, and many others for data-driven insights.

Get a 30-day free trial of the code-free Openbridge data integration for Amazon Advertising, Amazon Selling Partner, and Amazon Vendor Central.


What is a good ACoS on Amazon? was originally published in Openbridge on Medium, where people are continuing the conversation by highlighting and responding to this story.


from Openbridge - Medium https://ift.tt/9uGTy4z
via IFTTT

Data-Driven Amazon TACoS Insights

TACos Amazon

Harnessing the Power of Your Amazon Data in TACoS Strategies

Total Advertising Cost of Sales (TACoS) is a key metric used in e-commerce and digital marketing, especially in platforms like Amazon, to assess the impact of advertising spend on overall sales revenue. To effectively utilize TACoS, tapping into data from Amazon Ads, Seller Central, and Vendor Central is a must.

This post details how an Amazon business (Amazon Seller or Vendor) can use data from these sources to analyze TACoS and other Key Performance Indicators (KPIs). This includes the interplay of ad campaigns and organic traffic so you can craft an effective data-driven strategy that optimizes advertising efforts, profit margin, and total ad spend.

TACoS and Organic Sales & Traffic

The relationship between organic ranking on Amazon (or other platforms) and Total Advertising Cost of Sales (TACoS) is often not well understood.

Generally speaking, advertising plays a pivotal role in boosting product visibility, which in turn can enhance organic rankings. This improvement is primarily due to increased sales velocity — a key factor for better organic rankings on platforms like Amazon. As products gain higher visibility through ads and achieve more sales, they naturally start to rank higher in organic search results.

Effective advertising (Sponsored Product, Sponsored Brand, Sponsored Display, Sponsored Video) can improve visibility in organic rankings.

As the organic rankings improve, there is a flip side. When a product’s organic ranking improves, its reliance on paid advertising can decrease. This shift is reflected in the TACoS metric: a lower TACoS indicates a higher proportion of organic sales in the total sales mix.

This means a successful organic ranking can reduce the need for proportional ad spending, leading to a more cost-effective sales strategy. This is why using TACoS as a KPI is important.

  • Direct vs. Indirect Impact: TACoS doesn’t directly measure organic sales or traffic, but it indirectly influences them. A well-executed advertising strategy (reflected in a balanced TACoS) can boost brand awareness and market presence, which in turn can lead to increased organic sales and traffic.
  • Catalyst for Organic Growth: Effective advertising can introduce new customers to the brand. Satisfied customers might return for repeat purchases organically, thereby reducing future dependence on paid advertising and potentially lowering the TACoS.
  • Long-Term Brand Building: A strategic approach to advertising, even with a temporarily high TACoS, can contribute to long-term brand building. As the brand becomes more recognized and trusted, organic sales and traffic are likely to increase.

The result is a beneficial feedback loop — increased organic sales can lead to reinvestment in targeted advertising, further enhancing visibility and sales, while a decrease in TACoS can indicate effective organic growth strategies.

ACoS vs ROAS vs TACoS Amazon Advertising

Return on Advertising Spend (ROAS), Advertising Cost of Sales (ACoS), and Total Advertising Cost of Sales (TACoS) are KPI metrics in analyzing the effectiveness of advertising campaigns, especially for Sellers and Vendors using Amazon Advertising.

Here’s a breakdown of each metric:

ROAS Calculation (Return on Advertising Spend):

  • Definition: ROAS measures the gross revenue generated for every dollar spent on advertising. It’s a metric used to understand advertising campaigns’ effectiveness in revenue generation.
  • Calculation: ROAS is calculated by dividing the revenue generated from advertising by the cost of the advertising.
  • Formula: ROAS=Revenue from AdsCost of AdsROAS=Cost of AdsRevenue from Ads​
  • Interpretation: A higher ROAS indicates a more effective advertising campaign. It directly shows how much revenue is earned for each dollar spent.

ACoS Calculation (Advertising Cost of Sales):

  • Definition: ACoS is a metric used primarily on Amazon and similar e-commerce platforms. It measures the cost of advertising relative to the sales explicitly generated from those advertisements.
  • Calculation: ACoS is calculated by dividing the cost of advertising by the sales generated from advertising.
  • Formula: ACoS=Cost of AdsSales from Ads×100%ACoS=Sales from AdsCost of Ads​×100%
  • Interpretation: A lower ACoS is typically desirable, as it indicates that the advertising is more efficient (i.e., less cost for more sales). It’s beneficial for understanding the direct profitability of advertising campaigns.

TACoS Calculation (Total Advertising Cost of Sales):

  • Definition: TACoS measures the advertising cost relative to the total sales, including organic and ad-driven sales. It offers a broader view of how advertising affects overall sales.
  • Calculation: TACoS is calculated by dividing the total advertising spend by the total sales (both organic and advertising-generated).
  • Formula: TACoS=Total Advertising SpendTotal Sales×100%TACoS=Total SalesTotal Advertising Spend​×100%
  • Interpretation: TACoS helps in understanding the impact of advertising on the entire business. Unlike ACoS, which focuses solely on ad-generated sales, TACoS provides insight into how advertising influences overall sales, including organic sales.

Comparison:

  • ROAS is a general advertising metric applicable across different platforms and industries. It’s best for measuring the direct return on investment from ad campaigns.
  • ACoS is specific to e-commerce platforms like Amazon. It’s used to assess the efficiency of advertising in driving sales. It benefits sellers and marketers who need to understand the direct profit from their advertising on these platforms.
  • TACoS provides a more holistic view of advertising’s role in the overall sales strategy. It’s beneficial for long-term strategic planning, understanding the impact of advertising on total sales, and balancing advertising with other sales and marketing efforts.

Why use TACoS?

The advertiser should extend some of their focus (if you haven’t already) from ACoS and ROAS to TACoS. There are several reasons, but it is vital to understand ad investments’ overall effectiveness and impact on an e-commerce business. Here are key reasons why TACoS should be in the mix with ACoS and ROAS :

  1. Holistic View of Business Performance: TACoS measures the impact of advertising spending against the total revenue of the business, not just the revenue generated from ads. This offers a broader perspective on how advertising influences overall sales, including organic sales.
  2. Balancing Organic and Paid Sales: TACoS helps businesses understand the balance between organic and paid sales. A high ACoS might indicate effective ad-driven sales but could overshadow the status of organic sales. TACoS provides insight into how advertising contributes to overall business growth, including non-ad-driven sales.
  3. Long-Term Growth Strategy: TACoS is more aligned with long-term growth strategies. It considers the business’s overall health, factoring in how advertising contributes to brand awareness and market penetration, which may not immediately translate into direct sales but are crucial for long-term success.
  4. Efficient Resource Allocation: By focusing on TACoS, businesses can make more strategic decisions about allocating resources between advertising and other growth initiatives. It ensures that advertising budgets are being used effectively in the context of the business’s total sales performance.
  5. Adjusting for Market Dynamics: TACoS is less sensitive to short-term market fluctuations than ACoS or ROAS. It provides a more stable metric for evaluating the effectiveness of advertising strategies over time, making it suitable for adjusting long-term business plans.
  6. Branding and Market Presence: Investments in advertising to build brand recognition or capture market share might not yield immediate sales (thus potentially lowering ROAS or increasing ACoS). Still, they contribute to the overall market presence. TACoS accounts for these strategic investments.
  7. Comprehensive Marketing Insights: TACoS gives a comprehensive picture of the marketing funnel. It accounts for all stages of the customer journey, not just the final conversion, offering insights into how advertising influences customer behavior from awareness to purchase.

While ACoS and ROAS are crucial for understanding advertising campaigns’ direct profitability and efficiency, including TACoS in your metrics toolkit, you gain a more inclusive view of how advertising expenditures affect the entire spectrum of business sales. TACoS reflects a metric to help provide insights into whether a business is on a sustainable growth path, has strong market positioning, and realizes long-term brand development goals.

Based on the company, its goals, industry norms, and growth stage, it is crucial to develop insights into what constitutes an effective TACoS, the implications of a high TACoS, and how TACoS affects ad sales, overall revenue, and organic sales.

What is a Good TACoS?

TACoS is not a one-size-fits-all metric. It is a KPI that will depend on a company’s products, goals, and market dynamics.

The key is to balance TACoS with overall business objectives, aiming for a level that supports sustainable growth, brand development, and a healthy mix of organic and paid sales.

  • Depends on Business Objectives: For a business focused on aggressive growth or market penetration, a higher TACoS may be acceptable as it implies reinvestment in advertising to capture market share. For more established businesses or those prioritizing profitability, a lower TACoS might be preferable.
  • Industry Benchmarks: It’s also important to compare TACoS with industry averages. What’s considered good in one industry might be high in another.

Let’s explore an example of a high and low TACoS in the context of selling Apple iPads and watches. For simplicity, we’ll use hypothetical numbers.

High TACoS Example

Suppose Apple Inc. retailer $20,000 on advertising Apple iPads in a month.

  • Total Sales Revenue: In the same month, the total sales revenue (including both organic and ad-driven sales) for Apple iPads is $80,000.

TACoS Calculation:

  • TACoS=$20,000/$80,000×100%=25%

A TACoS of 25% is relatively high. This implies that a significant portion of the total sales revenue is being consumed by advertising costs.

Low TACoS Example

In a different situation, let’s say the Apple spends $5,000 on advertising Apple watches.

  • Total Sales Revenue: The total sales revenue for the month is $100,000.

TACoS Calculation:

  • TACoS=$5,000/$100,000×100%=5%

A TACoS of 5% is relatively low. This suggests that the Apple’s total sales are less reliant on advertising spend for the watch, indicating a strong organic sales performance, a highly efficient advertising strategy, or both!

Regular analysis and adjustment of advertising strategies based on TACoS can help businesses optimize their marketing efforts and grow more effectively.

Benefits Of Data-driven TACoS Insights

To harness the opportunity, Amazon Sellers and Vendors need to continuously monitor, analyze, and adjust their advertising strategies to stay informed about market trends and Amazon platform changes.

Overcoming the challenges of achieving a reasonable Advertising Cost of Sale (ACoS) on Amazon involves a strategic approach that leverages technology and data analytics. Here are some recommendations focusing on the use of Amazon Ads API, analytics tools, and integrating cloud data warehouses or data lakes:

Utilizing Amazon Ads API for Automation and Efficiency

  • Automate Bid Adjustments: Use the Amazon Ads API to understand trends and behaviors based on performance data. This can help optimize your campaigns based on data-driven insights, ensuring competitive bids without overspending.
  • Custom Reporting and Analysis: Develop custom reporting tools using the API to gather more granular data than what is available through Amazon’s default reporting. This can help identify specific areas for improvement.
  • Bulk Operations: Leverage the API for bulk operations to unify Sponsored Brands, Sponsored Products, and campaign data, saving time and ensuring a more holistic approach to campaign insights.
  • Performance Tracking: Employ analytics tools like Looker Studio, Tableau, Microsoft Power BI, Amazon QuickSight, SAP, Alteryx, dbt, Azure Data Factory, Qlik Sense, and many others to create insights that highlight key performance indicators (KPIs) such as TACoS, ROAS, ACoS, click-through rates (CTR), conversion rates, overall sales, and many more. This will help your team in understanding the effectiveness of your ads.
  • Testing: Use these tools to perform testing on different aspects of your ads (like keywords, ad copy, or images) to see what resonates best with your audience.
  • Customer Insights: Analyze customer behavior and preferences. Understanding your target audience can help you tailor your ads more effectively.

Integrating Cloud Data Warehouses or Data Lakes

  • Unified Data Repository: Use industry-leading data lake, data lakehouse, or cloud warehouses like Databricks, Amazon Redshift, Amazon Redshift Spectrum, Google BigQuery, Snowflake, Azure Data Lake, Ahana, and Amazon Athena. Consolidate data from various sources (Amazon sales data, advertising data, external market trends) for a holistic view.
  • Historical Data Analysis: Unified data that you control means you can efficiently analyze historical data, even when that data is no longer available from Amazon, to identify patterns and trends. This can inform your strategy for inventory management, budget allocation, and bidding strategies.
  • Scalability and Flexibility: Cloud solutions offer scalability and flexibility in handling large volumes of data, essential for comprehensive analysis and businesses with fluctuating data loads.
  • Advanced Analytics and Machine Learning: Implement advanced analytics and machine learning models to predict market trends, optimize pricing strategies, and forecast demand, which can directly impact ACoS.

Decision Making

  • Segmentation and Targeting: Utilize data to segment customers and target your ads more precisely. This can improve conversion rates and reduce wasted ad spend.
  • Real-Time Data Processing: Use real-time data processing to adapt quickly to market changes. This agility can be crucial for maintaining optimal ACoS in a dynamic marketplace.

Regular Review and Optimization

  • Continuous Monitoring: Regularly monitor campaign performance and adjust as needed. Stay agile and responsive to data insights.
  • Learning from Successes and Failures: Analyze successful and unsuccessful campaigns to understand what works and doesn’t.

Get Started

No more manual file downloads to calculate TACoS, ROAS, ACoS, and other Amazon KPIs.

Openbridge is an easy-to-use, fully-automated data automation to quickly streamline your workflow to collect, catalog, and unify your data to industry-leading cloud data warehouses and lakes. Unify Amazon data quickly with code-free pipelines so you can use your favorite analytic tools today.

Get a 30-day free trial of the code-free Openbridge data integration for Amazon Advertising, Amazon Selling Partner, and Amazon Vendor Central.


Data-Driven Amazon TACoS Insights was originally published in Openbridge on Medium, where people are continuing the conversation by highlighting and responding to this story.


from Openbridge - Medium https://ift.tt/Bm6bqwy
via IFTTT

Amazon Brand Lift and Amazon Brand Metrics: Growth Toolkit

Take advantage of Amazon Ads brand building insights data to drive sustainable growth

Building a strong brand, especially on Amazon, is a journey that combines strategy, creativity, and consistent customer engagement.

While pushing product sales is important, losing sight of the broader “brand” picture can be a detriment to that lower funnel sales effort.

Why Care About Brand Building On Amazon

Successful brands stand out not only by reaching their audience but by forging lasting connections. To accomplish this brand leaders use a blend of effective interaction, messaging, and a deep understanding of customer experiences.

Brand relevance is often a crucial and deciding element of the purchase process. As a result, brand marketing is one of the key tools for connecting with audiences, shaping perceptions, and storytelling.

Amazon offers a suite of tools to facilitate this, including Amazon Sponsored Ads (Sponsored Brand, Sponsored Product, Sponsored Display), Amazon DSP, Amazon Attribution, and Amazon Shoppers Panel

By leveraging these capabilities, brands can effectively measure and boost their presence on Amazon, leading to increased customer loyalty and sales growth.

For those interested in brand building on Amazon, they offer a couple of innovative, data-driven solutions; Amazon Brand Metrics and Amazon Brand Lift. While both offer an understanding into the performance of your investments across those Amazon capabilities, they serve different purposes.

Amazon’s Brand Metrics

A self-service solution, Amazon Brand Metrics insights data offers brands of all sizes insights into customer engagement and shopping behaviors on Amazon.

The insights data extends beyond simple ad-attributed reporting, enabling brands to quantify and optimize their performance based on shopping engagements predictive of actual sales.

Brand metrics facilitates a deeper understanding of the customer journey from initial awareness to loyalty, supporting long-term brand engagement strategies.

Examples of Brand Metrics

Brand metrics provide visibility into whether an ad-attributed purchase was made by an existing customer or a new buyer for the brand’s product on Amazon within a year. Advertisers has access to information like:

  • Total new-to-brand purchases and sales: Understand the overall impact of your campaigns on acquiring new customers and generating sales from them.
  • New-to-brand purchase rate: Measure the percentage of ad-attributed purchases made by new customers. This metric helps you assess the efficiency of your campaigns in attracting new buyers.
  • Cost per new-to-brand customer: Determine the average cost of acquiring a new customer through your advertising efforts. This metric is crucial for optimizing your budget allocation and maximizing ROI.

With these and other new-to-brand metrics, advertisers can make informed decisions about their marketing strategies, identify the most effective channels and tactics for acquiring new customers, and allocate their resources more efficiently.

Amazon Brand Metrics: Introducing New-To-Brand Analytics

Amazon Brand Lift Study

Accessible through the Amazon DSP console, Amazon Brand Lift studies allow advertisers to launch studies for fast, reliable insights. Amazon Brand Lift is powered by the Amazon Shopper Panel, an invitation-only, opt-in program that surveys at least 1,000 participants.

Amazon Brand Lift uses real feedback from people who shop on Amazon and are exposed to your ads to figure out how well your ads are working. For example, they might ask customers if they’ve seen your ads before, if they know your brand, or if they’re interested in buying something from you. By looking at this data, Amazon can give you a more accurate picture of how your ads are impacting your brand.

These studies measure the impact of ad campaigns, comparing the responses of an ad exposed group to a control group, providing insights into brand perception and loyalty shifts.

Brand Lift: Study the impact of your advertising

Do Brand Building Efforts On Amazon Deliver Results?

The impact of brand building efforts on Amazon is measurable. A study focusing on apparel, shoes, and handbags revealed that brands reaching new shoppers with awareness campaigns achieved incremental growth. Key findings include:

  • New-to-Brand Shoppers: Fashion brands using Amazon Ads for awareness campaigns saw a 19% increase in new-to-brand shoppers.
  • Repeat Purchases: These new shoppers had a 12% higher likelihood of making repeat purchases within the year.
  • Value Lift: There was a 20% lift in value when comparing new-to-brand customers acquired during campaign periods to those who came in the absence of advertising.
  • Increased ROAS: Advertisers using a combination of Sponsored Brands video, Store spotlight, and custom image ad formats saw a 5.5% increase in return on ad spend.
  • Higher Conversion Rate: A 57.8% increase in conversion rate was observed for advertisers using both Sponsored Brands custom image and Store spotlight ad formats.
  • CTR Improvement: The use of the Sponsored Brands video ad format led to a 108.1% increase in click-through rate.

Data-driven Brand Insights: Optimize The Customer Journey

Knowing brand building efforts on Amazon can deliver results, Amazon provides provides a broad collection of metrics and accurate data that is instrumental in measuring and enhancing brand awareness.

  1. Quantitative Insights: Provides quantifiable metrics on shopping engagements, offering a clearer picture of how customer interactions translate into sales.
  2. Performance Optimization: Brands can use these insights to refine their marketing strategies, both paid and organic, leading to more effective campaigns.
  3. Competitive Analysis: Brand Metrics allows brands to monitor their performance relative to their categories, offering a valuable benchmarking tool.
  4. Long-Term Value Measurement: The suite of awareness and consideration metrics within Brand Metrics helps brands measure the long-term value of customer engagement.
  5. Deeper Engagement Insights: By analyzing sales over a 12-month period, brands gain insights into the effectiveness of their strategies in fostering customer loyalty.

By measuring the impact of your upper- and mid-funnel tactics, you can see how shoppers are interacting with your brand throughout the marketing funnel. This enhanced visibility empowers advertisers to measure the true impact of their campaigns on customer acquisition and growth.

For data-driven organizations, the insights Amazon delivers allows your team to have the information needed to to evaluate the value of shopping engagements by looking at sales generated over a 12-month lookback period.

Refine Your Marketing Channels

With insights in hand, teams can make choices on how best to optimize organic marketing and advertising efforts off Amazon, on an Amazon’s store, or in ads to engage more shoppers and build your brand.

The insights can help inform investments more broadly;

  • Email Marketing Enhancements: By tracking the shopper engagement rate from Amazon, you might focus on creating emails that drive more consideration events or purchases, adjusting your content to better engage your audience.
  • Digital Marketing Refinement: Understanding the customer conversion metric can guide you in fine-tuning your digital ads, targeting actions like detail page views or ‘Add to Cart’ clicks to boost conversions.
  • Social Media Strategy Adjustments: If you’re noticing a difference in new-to-brand sales through your Amazon-driven social media posts, it could indicate a need to shift your content to attract more first-time buyers.
  • Website Analytics Strategy: Incorporating insights on branded searches can help in optimizing your website to convert shoppers who have researched your brand but haven’t yet made a purchase.
  • Content Marketing Evolution: By considering the awareness and consideration indexes from Amazon, you can tailor your blog posts and content to better align with the factors that lead to consideration and sales.
  • Video and Streaming TV Ad Optimization: Evaluating the purchase segment data can inform changes to your video content, targeting brand customers, one-time purchasers, and the most engaged shoppers to maximize impact.
  • Sales Approach Enhancement: Insights into different shopper segments — like repeat customers or Subscribe & Save users — can refine your sales team’s approach, focusing on retention strategies or upselling to your most loyal customers.
  • Revenue Focused Adjustments: Understanding the dynamics of new-to-brand sales and branded searches can help you decide where to focus your efforts for maximum revenue generation through Amazon.
  • SEO Strategy Refinement: Integrating shopper engagement and conversion metrics from Amazon into your SEO efforts can guide you to optimize for keywords and content that lead to higher engagement and conversion rates.

The process becomes cyclical as you monitor your performance relative to your category and peers at each stage of the purchase journey.

Getting Started With Amazon Brand Analytics Automation

Say goodbye to manual report downloads and errors in merging and tracking reports. Openbridge eliminates the need for cumbersome manual downloads, ensuring you have up-to-date and accurate data directly from Amazon APIs.

> Sign up for a 30-day free trial of our Amazon Brand Metrics data automation

Openbridge automates Amazon Brand Metrics API integrations and centralizes data storage in a unified data warehouse.

The trial delivers an automated and streamlined data pipeline for all of your crucial brand data to a trusted and private location like Amazon Redshift, Amazon Redshift Spectrum, Google BigQuery, Snowflake, Azure Data Lake, and Amazon Athena.

Unified data empowers your team to use best-in-class analytics tools like Google Data Studio, Tableau, Microsoft Power BI, Looker, or Amazon Quicksight. Combining various Amazon reports becomes a breeze, allowing you to gain a comprehensive and holistic view of your business.

Take action now and optimize Amazon Automation for Sellers and Vendor operations with Openbridge. Simplify your data management and unlock the full potential of your business insights.

Frequently Asked Questions

What is the Eligibility For Amazon Brand Lift?

All ad campaigns run through the Amazon DSP are eligible for Amazon Brand Lift studies. Brands are encouraged to consult with account executives to determine the feasibility of studies for their campaign types. The feasibility of studies varies by campaign type, encouraging brands to consult with account executives for best practices.

Creating a study in the Amazon DSP console is streamlined and self-service. Brands can choose orders, create study parameters, and check the status through the studies dashboard. The process is designed to be user-friendly, ensuring quick turnaround with results ready in as few as 30 days.

Are Brand Lift Studies Private?

Amazon Brand Lift studies are privacy-safe, offering detailed insights and easy reporting. They are available in multiple regions, including the United States, with the Amazon Shopper Panel providing objective, aggregated results.

What does Amazon Brand Lift Cost?

Per Amazon; “Brand Lift is free as long as campaigns meet spend and impression minimums. Minimums vary by marketplace; please visit the Amazon DSP or contact your account executive to learn more.”


Amazon Brand Lift and Amazon Brand Metrics: Growth Toolkit was originally published in Openbridge on Medium, where people are continuing the conversation by highlighting and responding to this story.


from Openbridge - Medium https://ift.tt/AWypvdl
via IFTTT

How Advertisers Can Use Amazon Attribution

Which part of the marketing budget and sales funnel activities are driving profitable growth? Is there a specific marketing effort working to drive conversions on Amazon? Display, search, social, video, or email?

Amazon Attribution performance data helps answer how non Amazon channels are drive growth (or dragging it down).

Amazon Ads Attribution Amazon Attribution metrics

There are two core report classes;

  • Promoted product analyze performance of products associated with your campaign. You can use this type of report to gauge how your campaigns impact shopping activity and sales for your products on Amazon.
  • Brand halo analyze performance of the brand products you didn’t promote (also known as brand halo) with a daily or summary performance broken out by campaign, channel, and publisher. This daily view shows one row per campaign-channel-publisher combination per product per day.

These reports contain a collection of permformance metrics;

  • Add to Cart: Number of times a promoted product is added to a customer’s cart following a click on an associated ad.
  • Brand Halo: Tracks conversions on products by the same brand as the promoted products, excluding the promoted products themselves. Abbreviated as “BH.”
  • Detail Page Views: Number of views of the advertised product’s detail pages on Amazon.
  • New-to-Brand Purchases: Number of first-time purchases for promoted products within the brand over a one-year lookback window.
  • New-to-Brand Product Sales: Total sales (in local currency) of new-to-brand orders.
  • New-to-Brand Units Sold: Quantity of promoted products purchased for the first time within the brand over a one-year lookback period post-ad delivery.
  • Product Sales: Total sales (in local currency) of promoted products purchased on Amazon post-click on an associated ad.
  • Promoted Product: A product tracked by an Amazon Attribution campaign.
  • Purchases: Number of times any amount of a promoted product or products are included in a purchase event.
  • Total Purchases: Number of times any number of products are included in a purchase event, including promoted products and those from the same brand.
  • Total Add to Carts: Number of times a product is added to a customer’s cart, including adds for promoted products and those from the same brand.
  • Total Detail Page Views: Number of ad-attributed detail page views on Amazon, including views for promoted products and those from the same brand.
  • Total Product Sales: Total sales (in local currency) of promoted products and those from the same brands as promoted products post-click on an associated ad.
  • Total Units Sold: Total quantity of promoted products and those from the same brand as promoted products purchased post-click on an associated ad.
  • Units Sold: Total quantity of promoted products purchased on Amazon post-ad exposure.

Amazon Ads Attribution Conversion metrics

You can also a number of conversion metrics designed to help you understand how shoppers engage with and make purchases on Amazon through the entire shopping journey.

Each Amazon Attribution conversion metric comes in two versions:

  • Promoted conversions that include attributed conversions for the products associated with your campaign, and
  • Total conversions that encompass attributed conversions for the products associated with your campaign plus all other products in the same brand. Total conversions equal promoted conversions plus brand halo conversions.

Each metric fits into a specific phase of the shopping journey so you can analyze the full-funnel impact of your non-Amazon marketing campaigns:

Awareness

Invest in growing the total audience of Amazon shoppers who are aware of your brand. Relevant Metric:

  • Clicks

Consideration

Help maximize purchase intent by telling your brand and product story. Relevant Metrics:

  • Detail Page Views
  • Add to Carts

Purchase

Stay present when shoppers are ready to buy. Relevant Metrics:

  • Purchases
  • Sales
  • Units Sold

Optimizing Off-Amazon Digital Marketing Campaigns with Amazon Attribution Data

What can this data offer advertisers? By exploring the rich performance data, teams can identify the most effective channels, publishers, creatives, and messaging strategies that drive customer engagement and conversions.

Strategic Testing: Uncovering Performance Drivers

An effective strategy to use once you have your data unified and ready to go is building an informed testing framework. This can be effective at uncovering the tactics that resonate with target audiences and maximize campaign delivery.

To optimize off-Amazon digital marketing efforts, consider conducting the following tests:

  1. Channel and Publisher Performance Analysis: Identify which channels and publishers are most effectively directing traffic to Amazon and contributing to sales. Focus on scaling efforts with high-performing partners.
  2. Creative and Messaging Resonance: Assess the effectiveness of various creatives and messaging approaches. Determine which combinations drive stronger engagement, conversions, and customer acquisition.
  3. High-Value Opportunity Identification: Utilize the products report to uncover potential advertising opportunities. For instance, if an ad for Product A leads to increased detail page views for Product B, consider creating a dedicated ad for Product B.
  4. Engaging Landing Page Experiences: Conduct landing page A/B tests to evaluate how shopping activities differ based on landing destinations and calls to action. Test different Store page tabs, product detail pages, and CTAs to optimize customer engagement.
  5. Unique Audience Insights: Identify the tactics that best engage specific audience segments across non-Amazon channels. Use these insights to allocate resources and tailor messaging more effectively.

Accessing Attribution Performance Data

You can access your Amazon Attribution manually via the reporting dashboard or as automated data feed from the Amazon Ads API.

Using the API allows you to create customized, multi-dimensional, visual reporting dashboards in industry leading tools like Looker Data Studio, Tableau, Microsoft Power BI, Looker, or Amazon Quicksight where you can customize the metrics displayed and toggle between campaign and ad group data.

Looker Amazon Ads Attribution Report

Amazon Attribution API Data Feeds

There are two primary report data feeds from the API

Performance Report

  • Included Dimensions: aa_campaignid, aa_adgroupid, aa_creativeid, publisher.
  • Aggregation Level: Can be aggregated at CAMPAIGN, ADGROUP, or CREATIVE level (default: CREATIVE).
  • Metrics: Click-throughs and all Promoted and Total conversion metrics.

Products Report

  • Included Dimensions: aa_campaignid, aa_adgroupid, publisher, productName, productGroup, productCategory, productSubcategory, brandName, productAsin, productConversionType.
  • Aggregation Level: Always aggregated at ad group level.
  • Metrics: Promoted and Brand halo conversion metrics, Brand Referral Bonus. No click-throughs.

Once attribution tags have been implemented and shoppers have clicked your links, Openbridge will call the report endpoint to retrieve your data. Clicks may take up to 24 hours to appear, and conversions may take up to 48 hours.

Getting Started with Amazon Ads Attribution API Automation

Ditch the messy, manual reporting for Amazon Attribution. Automated data feeds guide data-driven decision making to improve off-Amazon digital marketing campaigns. Leverage attribution insights to refine strategies, allocate resources efficiently, and enhance customer engagement across all touchpoints.

Openbridge will unify and deliver performance data to leading data lake or cloud warehouses like Redshift, Google BigQuery, Snowflake, Azure Data Lake, and Amazon Athena for an analytics-ready single source of truth to fuel informed decisions on brand building strategy, media, and customer demand for Amazon.

With your data unified, start to turbocharge reporting, analytics, and business intelligence tools like Google Data Studio, Tableau, Microsoft Power BI, Looker, Amazon QuickSight, SAP, Alteryx, dbt, Azure Data Factory, Qlik Sense, and many others.

Get a 30-day free trial so that you can try Amazon Attribution API automation for yourself


How Advertisers Can Use Amazon Attribution was originally published in Openbridge on Medium, where people are continuing the conversation by highlighting and responding to this story.


from Openbridge - Medium https://ift.tt/jdIJwet
via IFTTT