Brand Metrics provides a new measurement solution that quantifies opportunities for your brand at each stage of the customer journey in Amazon's store. Brands can understand the value of shopping engagements that impact sales in a journey.
Brand Metrics helps you:
- Understand your brand performance. Brand metrics measure the number of actual on-Amazon shopper engagements.
- Measure the impact of your upper and mid-funnel tactics and see how they contribute to shoppers moving through the purchase journey.
- Evaluate engagement metrics to understand the value of your branded intent and how brand purchasers generate additional sales in the 12 months following purchase.
- Monitor your performance relative to your category and peers at each stage of the purchase journey and over time.
- Optimize your marketing and advertising efforts in Amazon's stores to engage more shoppers and build your brand.
The metrics offer critical insights for brands to understand the value of shopping engagements during the Amazon purchase process. The metrics allow you to measure historical sales following a consideration event or purchase.
What Brand Metrics Are Available?
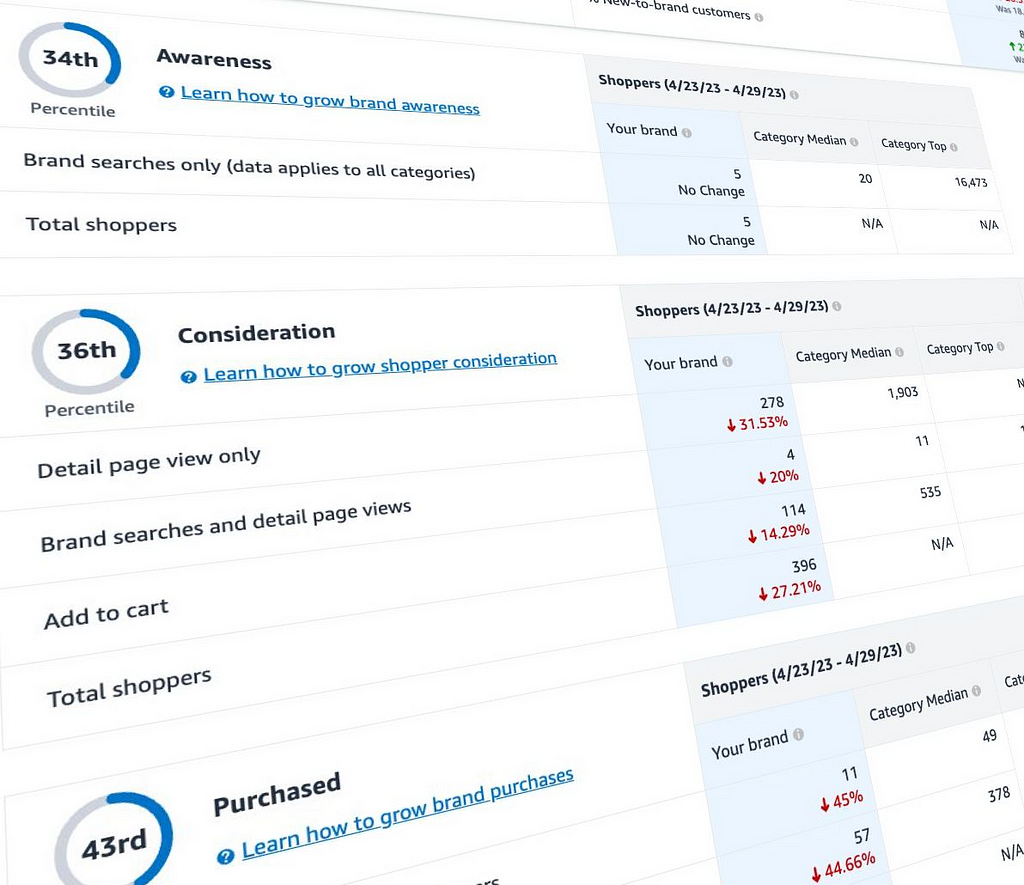
Brand Metrics offer awareness and consideration indicators that compare performance against peers. Amazon also quantifies the number of customers in your awareness and consideration marketing funnel.
The metrics include all shopping engagements with your brand on Amazon, not just ad-attributed engagements. The following is a collection of metrics Amazon makes available:
- engagedShopperRateLowerBound — Lower bound on the percentage of unique shoppers in a category that your brand has driven an engagement with or purchase from in the selected time frame divided by the total unique shoppers with 1+ detail page views in the selected category
- engagedShopperRateUpperBound — Upper bound on the percentage of unique shoppers in a category that your brand has driven an engagement with or purchase from in the selected time frame divided by the total unique shoppers with 1+ detail page views in the selected category
- engagedShopperRateCategoryMedianLowerBound — Lower bound on the percentage of unique shoppers in a category that your brand has driven an engagement with or purchased from in the selected time frame divided by the total unique shoppers with 1+ detail page view in the selected category for the median peers
- engagedShopperRateCategoryMedianUpperBound — Upper bound on the percentage of unique shoppers in a category that your brand has driven an engagement with or purchase from in the selected time frame divided by the total unique shoppers with 1+ detail page view in the selected category for the median peers
- engagedShopperRateCategoryTopPerformersLowerBound — Lower bound on the percentage of unique shoppers in a category that your brand has driven an engagement with or purchase from in the selected time frame by the total unique shoppers with 1+ detail page view in the selected category for the top 95th-99th percent of peers
- engagedShopperRateCategoryTopPerformersUpperBound — Upper bound on the percentage of unique shoppers in a category that your brand has driven an engagement with or purchase from in the selected time frame divided by the total unique shoppers with 1+ detail page view in the selected category for the top 95th-99th percent of peers
- customerConversionRate — percentage of shoppers moving from “considering” [Brand Name] in the [categoryNodePath] to “purchased” in the [lookBackPeriod]
- customerConversionRateCategoryMedian — the percentage of shoppers moving from "considering" the peer median in the [categoryNodePath] to "purchased" in the [lookBackPeriod]
- customerConversionRateCategoryTopPerformers — the percentage of shoppers moving from "considering" the average of the top 95th-99th percent of peers in the [categoryNodePath] to "purchased" in the l[lookBackPeriod]
- newToBrandCustomerRate — share of customers that had not purchased [Brand Name] products in the last 12 months but did so in the [lookBackPeriod]
- newToBrandCustomerRateCategoryMedian — share of customers that had not purchased peer median products in the last 12 months but did so in the [lookBackPeriod]
- newToBrandCustomerRateCategoryTopPerformers — share of customers that had not purchased an average of the top 95th-99th percent of peers' products in the last 12 months but did so in the [lookBackPeriod]
- brandedSearchesOnly — shoppers that searched for [Brand Name] but did not further engage or purchase from [Brand Name] and [categoryNodePath] in the [lookBackPeriod]
- brandedSearchesCategoryMedian — shoppers that searched for the peer median but did not further engage or purchase from peer median and [categoryNodePath] in the [lookBackPeriod]
- brandedSearchesCategoryTopPerformers — shoppers that searched for the avg. of the top 95th — 99th percent of peers and [categoryNodePath] but did not further engage or purchase from the Top Performers in the [lookBackPeriod]
- viewedDetailPageOnly — shoppers that viewed detail page only of [Brand Name] in [categoryNodePath] in [lookBackPeriod]
- viewedDetailPageCategoryMedian — shoppers that viewed the detail page only of peer median in [categoryNodePath] in [lookBackPeriod]
- viewedDetailPageCategoryTopPerformers — shoppers that viewed the detail page only of avg. of the top 95th — 99th percent of peers in [categoryNodePath] in [lookBackPeriod]
- viewedDetailPageOnlyReturnOnEngagement — The average number of sales per customer in this state 12 months ago drove over one year. Calculate by taking the total original population 12 months ago by the total sales this population moved over the last year for your brand in the selected category.
- viewedDetailPageROECategoryMedian — The average sales of each customer in this state for the peer median 12 months ago drove over one year. Calculate by taking the total original population 12 months ago by the total sales this population moved over the last year for your brand in the selected category.
- viewedDetailPageROECategoryTopPerformers — The average sales of each customer in this state for the 95–99 percent peers 12 months ago drove over one year. Calculate by taking the total original population 12 months ago by the total sales this population moved over the last year for your brand in the selected category.
- brandedSearchesAndDetailPageViews — shoppers that searched brand and viewed the detail page of [Brand Name] in [categoryNodePath] in [lookBackPeriod]
- brandedSearchesAndDetailPageViewsCategoryMedian — shoppers that searched brand and viewed the detail page of peer median in [categoryNodePath] in [lookBackPeriod]
- brandedSearchesAndDetailPageViewsCategoryTopPerformers — shoppers that searched brand and viewed the detail page of avg. of the top 95th — 99th percent of peers in [categoryNodePath] in [lookBackPeriod]
- brandedSearchesAndDetailPageViewsReturnOnEngagement — The average sales of each customer in this state 12 months ago drove over one year. Calculate by taking the total original population 12 months ago by the total sales this population drove over the last year for your brand in the selected category.
- brandedSearchesAndDetailPageViewsROECategoryMedian — The average sales of each customer in this state for the peer median 12 months ago drove over one year. Calculate by taking the total original population 12 months ago by the total sales this population drove over the last year for your brand in the selected category.
- brandedSearchesAndDetailPageViewsROECategoryTopPerformers — The average amount of sales each customer in this state for the 95–99 percent peers 12 months ago drove over one year. Calculate by taking the total original population 12 months ago by the total sales this population drove over the last year for your brand in the selected category.
- addToCarts — shoppers that added [Brand Name] to the cart in [categoryNodePath] in [lookBackPeriod]
- addToCartsCategoryMedian — shoppers that added the peer median to the cart in [categoryNodePath] in [lookBackPeriod]
- addToCartsCategoryTopPerformers — shoppers that added the avg. of the top 95th — 99th percent of peers to the cart in [categoryNodePath] in [lookBackPeriod]
- addToCartsReturnOnEngagement — The average sales of each customer in this state 12 months ago drove over one year. Calculate by taking the total original population 12 months ago by the total sales this population drove over the last year for your brand in the selected category.
- addToCartsROECategoryMedian — The average sales per customer in this state for the peer median 12 months ago drove over one year. Calculate by taking the total original population 12 months ago by the total sales this population drove over the last year for your brand in the selected category.
- addToCartsROECategoryTopPerformers — The average sales of each customer in this state for the 95–99 percent peers 12 months ago drove over one year. Calculate by taking the total original population 12 months ago by the total sales this population moved over the last year for your brand in the selected category.
- brandCustomers — 0%-90% of sales contributing shoppers for [Brand Name] who purchased in [categoryNodePath] in [lookBackPeriod]
- brandCustomersCategoryMedian — 0%-90% of sales contributors for the peer median who purchased in [categoryNodePath] in [lookBackPeriod]
- brandCustomersCategoryTopPerformers — 0%-90% of sales contributors for avg. of the top 95th — 99th percent of peers who purchased in [categoryNodePath] in [lookBackPeriod]
- brandCustomersReturnOnEngagement — The average sales of each customer in this state 12 months ago drove over one year. Calculate by taking the total original population 12 months ago by the total sales this population drove over the last year for your brand in the selected category.
- brandCustomersROECategoryMedian — The average sales per customer in this state for the peer median 12 months ago drove over one year. Calculate by taking the total original population 12 months ago by the total sales this population drove over the last year for your brand in the selected category.
- brandCustomersROECategoryTopPerformers — The average sales of each customer in this state for the 95–99 percent peers 12 months ago drove over one year. Calculate by taking the total original population 12 months ago by the total sales this population drove over the last year for your brand in the selected category.
- high-value customers — top 10% of sales contributing shoppers for
- highValueCustomersCategoryMedian — top 10% of sales contributing shoppers for peer median in [categoryNodePath] in [lookBackPeriod]
- highValueCustomersTopPerformers — top 10% of sales contributing shoppers for the top 95th — 99th percent of peers in [categoryNodePath] in [lookBackPeriod]
- highValueCustomersReturnOnEngagement — The average sales of each customer in this state 12 months ago drove over one year. Calculate by taking the total original population 12 months ago by the total sales this population drove over the last year for your brand in the selected category.
- highValueCustomersROECategoryMedian — The average sales per customer in this state for the peer median 12 months ago drove over one year. Calculate by taking the total original population 12 months ago by the total sales this population drove over the last year for your brand in the selected category.
- highValueCustomersCategoryTopPerformers — The average sales of each customer in this state for the 95–99 percent peers 12 months ago drove over one year. Calculate by taking the total original population 12 months ago by the total sales this population drove over the last year for your brand in the selected category.
- awarenessIndex — Awareness Index measures actual on-Amazon audience signals reflecting awareness for your brand in the short and long term across the entire on-Amazon audience. The percentile lets you know how your brand's awareness activity compares to your peers.
- considerationIndex — Consideration Index measures actual on-Amazon audience signals reflecting consideration for your brand in the short and long term across the entire audience. The percentile lets you know how your brand's consideration activity compares to your peers.
- salesIndex — Sales Index represents actual on-Amazon sales in the short term and long term across the whole on-Amazon audience. The percentile lets you know how your sales compare to your peers.
Who Is Eligible For Amazon Brand Metrics?
Brand Metrics is available in beta to professional sellers enrolled in Amazon Brand Registry and vendors selling Amazon products in the following markets: United States, Canada, United Kingdom, Germany, France, Italy, Spain, and Japan. Please note that Brands with less than 20 orders a month will not have access to Brand Metrics.
Amazon Brand Analytics Report Data Automation
Openbridge allows Amazon sellers to streamline the data management process by automating Amazon Brand Analytics API integrations and storing data in a unified data warehouse. This service saves sellers time manually downloading reports and reduces errors in merging and tracking downloaded reports.
Automation eliminates manual download wrangling, ensuring up-to-date and accurate data straight from Amazon APIs. With data stored in a unified data warehouse like Amazon Redshift, Amazon Redshift Spectrum, Google BigQuery, Snowflake, Azure Data Lake, and Amazon Athena, you can combine different Amazon reports is easier to gain a more holistic view of the business.
The automated, streamlined process enables sellers to access all their important data in one private, trusted destination. Your team can then leverage best-in-class analytics and business tools like Google Data Studio, Tableau, Microsoft Power BI, Looker, or Amazon Quicksight.
Sign up for a 30-day free trial of our Brand Analytics Amazon Insights Report automation.
Brand Analytics Amazon: Insights To Optimize Sales Performance was originally published in Openbridge on Medium, where people are continuing the conversation by highlighting and responding to this story.
from Openbridge - Medium https://ift.tt/BCTUuN8
via IFTTT