Unlocking the building blocks of AI-Powered Amazon Advertising solutions
Today, we’re excited to announce the release of the Amazon Ads MCP SDK — the first comprehensive Ads API open-source project that bridges the gap between your favorite AI tools and Amazon’s advertising platform.
Democratizing AI-Powered Advertising
As an Amazon Ads Partner, Openbridge has witnessed firsthand the challenges that businesses face when trying to harness the full potential of Amazon’s advertising ecosystem with AI. While the Amazon Ads API offers incredible capabilities, integrating it with AI systems has traditionally required significant technical expertise and development resources.
That’s why we built the Amazon Ads API MCP SDK — a community-driven, open-source project designed to unlock the value of AI with Amazon Ads API for everyone.
What Makes This Different?
The Amazon Ads API MCP SDK leverages the Model Context Protocol (MCP), which acts as a universal translator between AI models like Claude and external systems.
Comprehensive API Coverage
The SDK doesn’t just cover the basics — it provides access to the full breadth of Amazon’s advertising ecosystem:
Campaign Management — Sponsored Products, Brands, Display, and TV
Amazon Marketing Cloud — Advanced analytics and insights
Reporting & Analytics — Performance data and optimization insights
Creative Management — Asset optimization and testing
Audience Tools — Targeting and segmentation
Getting Started in Minutes
Whether you’re using Claude Desktop, building custom applications, or integrating with existing systems, the MCP SDK provides flexible authentication options and comprehensive documentation to get you up and running quickly.
The Amazon Ads API MCP SDK is just the beginning. We’re building a community of developers, marketers, and innovators who believe in the power of AI to transform advertising.
Get involved:
⭐ Star the project on GitHub to show your support
📚 Explore the documentation and get started with your first integration
🐛 Report issues and suggest improvements
🤝 Contribute code, documentation, or use cases
💬 Join the conversation and share your experiences
Visit our GitHub repository to get started today, and join us in shaping the future of AI-powered advertising.
The Amazon Ads API MCP SDK is developed and maintained by Openbridge, an Amazon Ads Partner. This open-source project is not affiliated with or endorsed by Amazon, but is designed to work seamlessly with Amazon’s advertising platforms.
Amazon provides powerful analytics tools to help sellers optimize their product listings and better understand customer behavior.
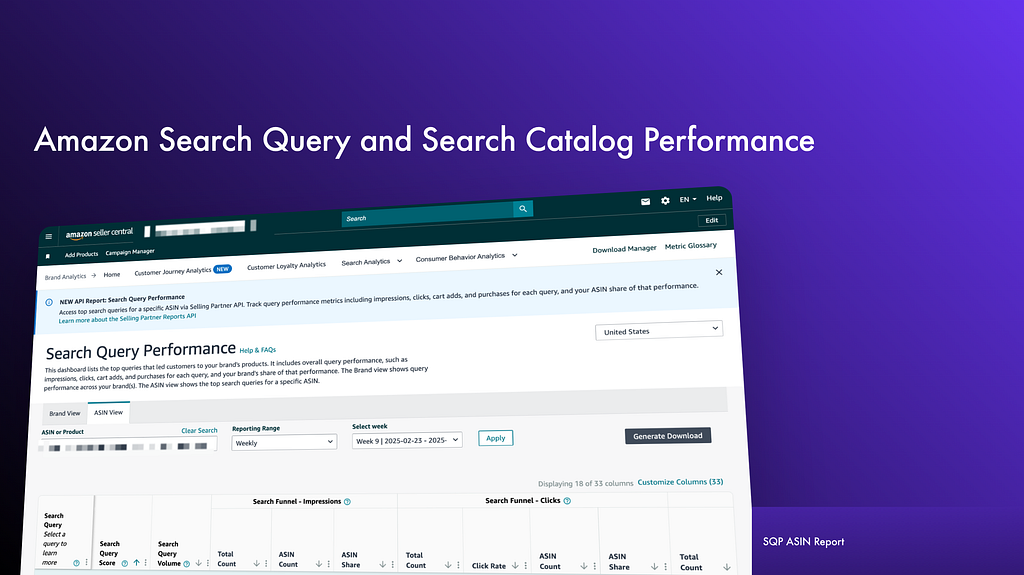
Two essential tools for sellers are the Search Catalog Performance Data and the Search Query Performance Data. Both datasets offer a roadmap to Amazon’s search algorithm.
By pairing metrics like Brand Share, Purchase Rate, and Shipping Speed with competitor insights, you can Refine PPC campaigns, Optimize listings for high-intent queries, and Anticipate buyer needs (e.g., fast shipping for urgent queries).
Get automated, code free access to Amazon SQP data directly from Openbridge:
Why Your Amazon Sales Funnel Needs the Search Query Performance and Search Catalog Data
If your Amazon sales are stagnating or customers are abandoning their journey, the Search Query Performance (SQP) and Search Catalog Performance (SCP), launched Q1 2025 in the Selling Partner API, are your secret weapons.
These tools decode how shoppers search for and buy products, offering granular insights into:
Search Query Behavior: What terms customers use.
Funnel Drop-Offs: Where they lose interest (clicks, cart adds, purchases).
Competitor Benchmarks: How your ASINs stack up against rivals.
This guide dives into every metric, strategy, and hidden detail to transform raw data into actionable wins.
What Types of Search Query Performance and Search Catalog Performance Data Is Available?
Search Query Volume
Definition: Total searches for a term (e.g., “water bottle” = 100 searches/month).
Use Case: Prioritize high-volume, low-competition terms for PPC campaigns.
Impressions
Total Count: Products displayed for a query (e.g., 1,000 products for “yoga mat”).
Brand/ASIN Count: Your products shown (e.g., 200 impressions for your brand).
Brand/ASIN Share**: Your % of total impressions (e.g., 20% brand share).
Fine Print: Includes below-the-fold and refined search impressions (e.g., “yoga mat + eco-friendly”).
Conversion Rate (Purchase Rate): Efficiency of converting clicks into actual purchases.
Purchase Rate Calculation
Indicates successful customer transitions from clicks to purchases.
Counts only purchases originating directly from search results within 24 hours.
Search Catalog Performance Dashboard: The SQP’s Perfect Partner
While SQP focuses on search terms, the Search Catalog Dashboard zooms into ASIN-level metrics:
Impressions: How often your ASIN appears organically.
Attribution Rules: Only counts actions from search results (excludes widgets/external traffic).
Sales vs. Search Traffic Sales: Compare total sales (all sources) vs. search-driven sales to gauge channel effectiveness.
Search Catalog Performance Metrics
This information focuses specifically on how your products perform within Amazon search results, offering insights about how often and how effectively customers discover, click, add products to carts, and ultimately purchase.
Metrics such as Same Day Shipping Speed, 1D, and 2D Shipping Speeds are incorrect for specific dates (03/31/23 and 04/01/23), affecting minor reporting accuracy for specific periods in 2023 (Weeks 9 & 13, March, April, Q1, and Q2).
Product Title
Represents your product’s title in search results (limited initially to 50 characters).
ASIN ID and Category
Combines the Amazon Standard Identification Number (ASIN) and product category.
ASIN is unique within a marketplace.
Categories help contextualize the product (e.g., “Health and Personal Care”).
Shipping Speeds
Same-Day Shipping: Products purchased, processed, packaged, and delivered within 24 hours. Critical for evaluating how quickly shipping impacts product performance.
1-Day (1D) Shipping: Next-day delivery allows sellers extra time to organize and package orders carefully.
2-Day (2D) Shipping: Two-day delivery speed, crucial for understanding slower but still rapid shipping impacts compared to same-day and 1D.
Median Price
Median price of ASINs at the time of search impressions.
Purchase price may vary due to coupons, shipping, discounts, and more.
Helps evaluate if price influences impressions, clicks, cart adds, and purchases.
Putting SQP and SCP Together: Understanding the Search Funnel
The search funnel illustrates product interactions from initial impression to final purchase.
Impressions
Total views from the search results page, excluding widgets.
Includes organic and sponsored products, refinements, and pages actively viewed by customers.
Clicks & Click Rate (CTR)
Clicks represent detail page views from search results.
Click Rate (CTR) measures engagement by the ratio of clicks to impressions (e.g., 3% CTR if 300 clicks from 10,000 impressions).
No universal “good” CTR — depends on product and device type.
Cart Adds
Counted only when originating from search results.
Indicates customer intent toward purchasing a product.
Purchases
Measures completed sales originating from search within 24 hours.
Excludes sales from widgets or external sources.
Counts purchases regardless of cancellations or returns.
Search Funnel — Purchase Metrics
Includes only transactions initiated and completed within 24 hours from search queries.
Helps sellers understand product conversion and customer intent from clicks to purchases.
Advanced Strategies to Maximize the SQP
Fix Funnel Leaks with Brand Share Analysis
Low Click Share: Weak titles/imagery. Test high-resolution images and keyword-rich titles.
Low Cart Add Share: Poor product descriptions. Use A+ Content to highlight USPs.
Low Purchase Share: Price sensitivity. Run promotions or bundle deals.
Optimize Shipping Speed for Conversions
Queries with high “Same-Day Shipping” clicks indicate urgency (e.g., “last-minute gifts”). Partner with Amazon FBA for faster fulfillment.
Reverse-Engineer Amazon’s Algorithm
Search Query Score: Amazon ranks queries by impressions, clicks, cart adds, and purchases. Target high-score terms with Sponsored Brands ads.
Common Pitfalls & Pro Tips
Data Mismatches: SQP data won’t match Seller Central sales reports due to attribution rules. Use both for holistic insights.
Shipping Speed Metrics: Propagated from impression time (e.g., if a product had 1-day shipping during the click but changed later, the metric still reflects 1-day).
Median Price vs. Purchase Price: Median excludes coupons/taxes, but purchase price includes them — explain price discrepancies to customers proactively.
Getting Started with Amazon Search Query Performance Reports Automation
Ditch the messy, manual reporting for Amazon Search Query Performance Reports. Automated data feeds guide data-driven decision-making to improve off-Amazon digital marketing campaigns.
Openbridge will unify and deliver SQP data to data lakes or warehouses like Redshift, Google BigQuery, Snowflake, Azure Data Lake, and Amazon Athena, giving you a single source of truth. This unified data can turbocharge reporting and analytics tools like Google Data Studio, Tableau, Microsoft Power BI, Looker, Amazon QuickSight, SAP, Alteryx, dbt, Azure Data Factory, and Qlik Sense.
A deferred transaction refers to a sale where the payment is temporarily held and will be paid out at a future date. Amazon reserves funds from your sales until a specific number of days after your shipments are delivered.
What Are Deferred Transactions?
Deferred transactions are sales proceeds that Amazon holds until certain conditions are met. These conditions typically involve ensuring that the buyer has received the order in the promised condition and that there are sufficient funds to cover potential returns, claims, or chargebacks.
Reasons for Transaction Deferral Transactions may be deferred for the following reasons:
Delivery Date Policy (Orders Awaiting Delivery): Orders placed by customers are typically subject to delivery date-based reserve policies. Sales proceeds are reserved until Amazon confirms that the buyer received the order in the promised condition. This policy ensures that a Seller has sufficient funds to fulfill any returns, claims, or chargebacks.
Invoiced Orders (Orders Pending Buyer Payment): Invoiced orders placed by Amazon Business customers are deferred while awaiting payment by the buyer. These transactions are released after the customer completes their invoice payment, which typically occurs within 30–45 days after the order date. These orders are also subject to delivery date policies, but in most cases, the invoice due date will be later than the reserve period.
Viewing Deferred Transactions
Only released transactions are included for payout in a settlement period. Deferred transactions will not be in yoursettlement reports. Amazon will not return deferred events in theFinance API, which means deferred transactions will will not show up in the API until in they are released.
At the moment, to monitor your deferred transactions:
Navigate to the Transaction View page in Amazon Seller Central.
Select “Deferred transactions” from the “Transaction Status” dropdown menu.
Click “Update” to view the deferral reasons and the expected payment release dates for all deferred transactions.
After the payment release date, the transaction status will update to “Released.”
Understanding Delivery Date Reserves
Delivery date reserves ensure you have enough funds to fulfill financial obligations, such as refunds, claims, or chargebacks.
Duration of Fund Reservation Funds are reserved until a shipment is delivered, plus a reserve period. The standard reserve period is 7 days after the delivery date (“DD + 7” reserve policy). For example, if you sell an item on January 1, and it is delivered on January 6, then under the DD + 7 policy, your funds will become available for disbursement starting on January 14. Your reserve period may be extended following an assessment of your overall risk and historical performance.
Amount of Funds Held Back Delivery date reserves are calculated based on shipment delivery dates. You can view the list of transactions and the corresponding amounts subjected to reserve on the Payments Transaction view, and their total is included as part of the deferred transactions line of the Total Balance tile on the Payments Dashboard.
Impact of Delivery Date Reserves If you recently had a delivery date reserve policy applied to your account, or if you have just started selling, it is normal for all of your funds to be held in reserve.
This is because your reserve amount is based on the funds from shipments that were delivered within your reserve period (with the standard being seven days, or “DD+7”).
When you ship a product, you can view the corresponding payment transaction on Payments > Transaction view. Filter for Transaction status Deferred transactions and click Update to see a list of all transactions currently held in reserve, and the expected payment release date for each transaction.
Funds from these transactions will be released in accordance with the shipment’s delivery date, at which point, the transaction status will update to “released” and funds will be available for transfer to your bank account.
You can also download a detailed report of these transactions by navigating to the Payments Reports Repository and requesting the Report type “Deferred transactions.”
Determining Shipment Delivery Dates When you use an integrated shipping carrier, Amazon will use the actual delivery date of the order. In the absence of valid tracking data, Amazon will use the latest estimated delivery date (EDD).
Strategies to Accelerate Payment Release To expedite the release of your funds:
Prompt Dispatch: Ship your items as soon as possible and confirm dispatch in Manage Orders.
Provide Valid Tracking Numbers: Use integrated carriers and provide valid tracking numbers when confirming shipments. This gives buyers peace of mind, knowing that their package is on the way.
Choose Faster Delivery: Opt for faster delivery methods to reduce the time between shipment and delivery.
By understanding and effectively managing deferred transactions, you can better plan your finances and maintain a healthy cash flow as an Amazon seller.
Customers often head to Amazon in search of items that fit their needs, while also hoping to discover new products and brands. Brand Stores, a free self-service tool, offer brands the chance not only to feature their merchandise but also to communicate their brand’s unique benefits, build a distinctive shopping journey, and potentially increase purchases as well as foster customer loyalty.
According to Amazon data, new-to-brand shoppers who visit a Brand Store are 62.7% more likely to make a purchase compared to those who don’t. Moreover, these shoppers spend 72.3% more on average when they buy after visiting a Brand Store versus those who don’t. In this guide, you’ll learn what Brand Stores are, how to create one for your brand, and how to maximize its advantages.
What Are Brand Stores?
Think of a Brand Store as your brand’s digital storefront on Amazon. It offers a multi-page, immersive shopping environment that increases the likelihood of customers getting to know — and growing to love — your brand. In turn, this familiarity can lead them to purchase your products.
A Brand Store allows you to:
Showcase your full product lineup.
Feature specific collections, seasonal offers, and discounts.
Present storytelling content about your brand’s background.
Best of all, creating a Brand Store is completely free.
How To Create Brand Store In Amazon
There is no cost to create a store, and no design background is required.
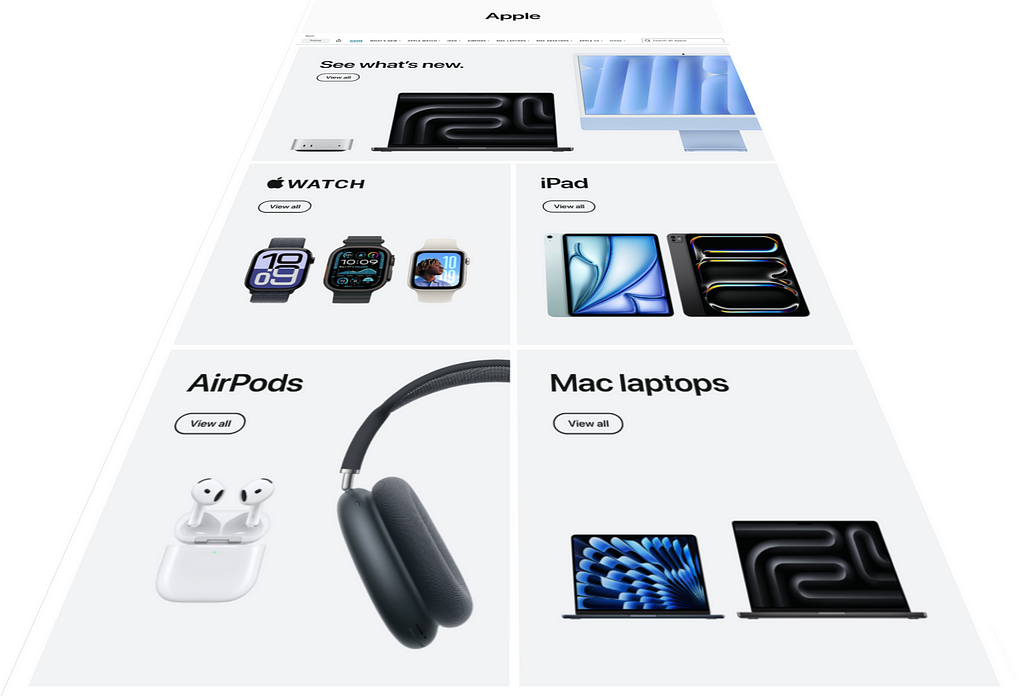
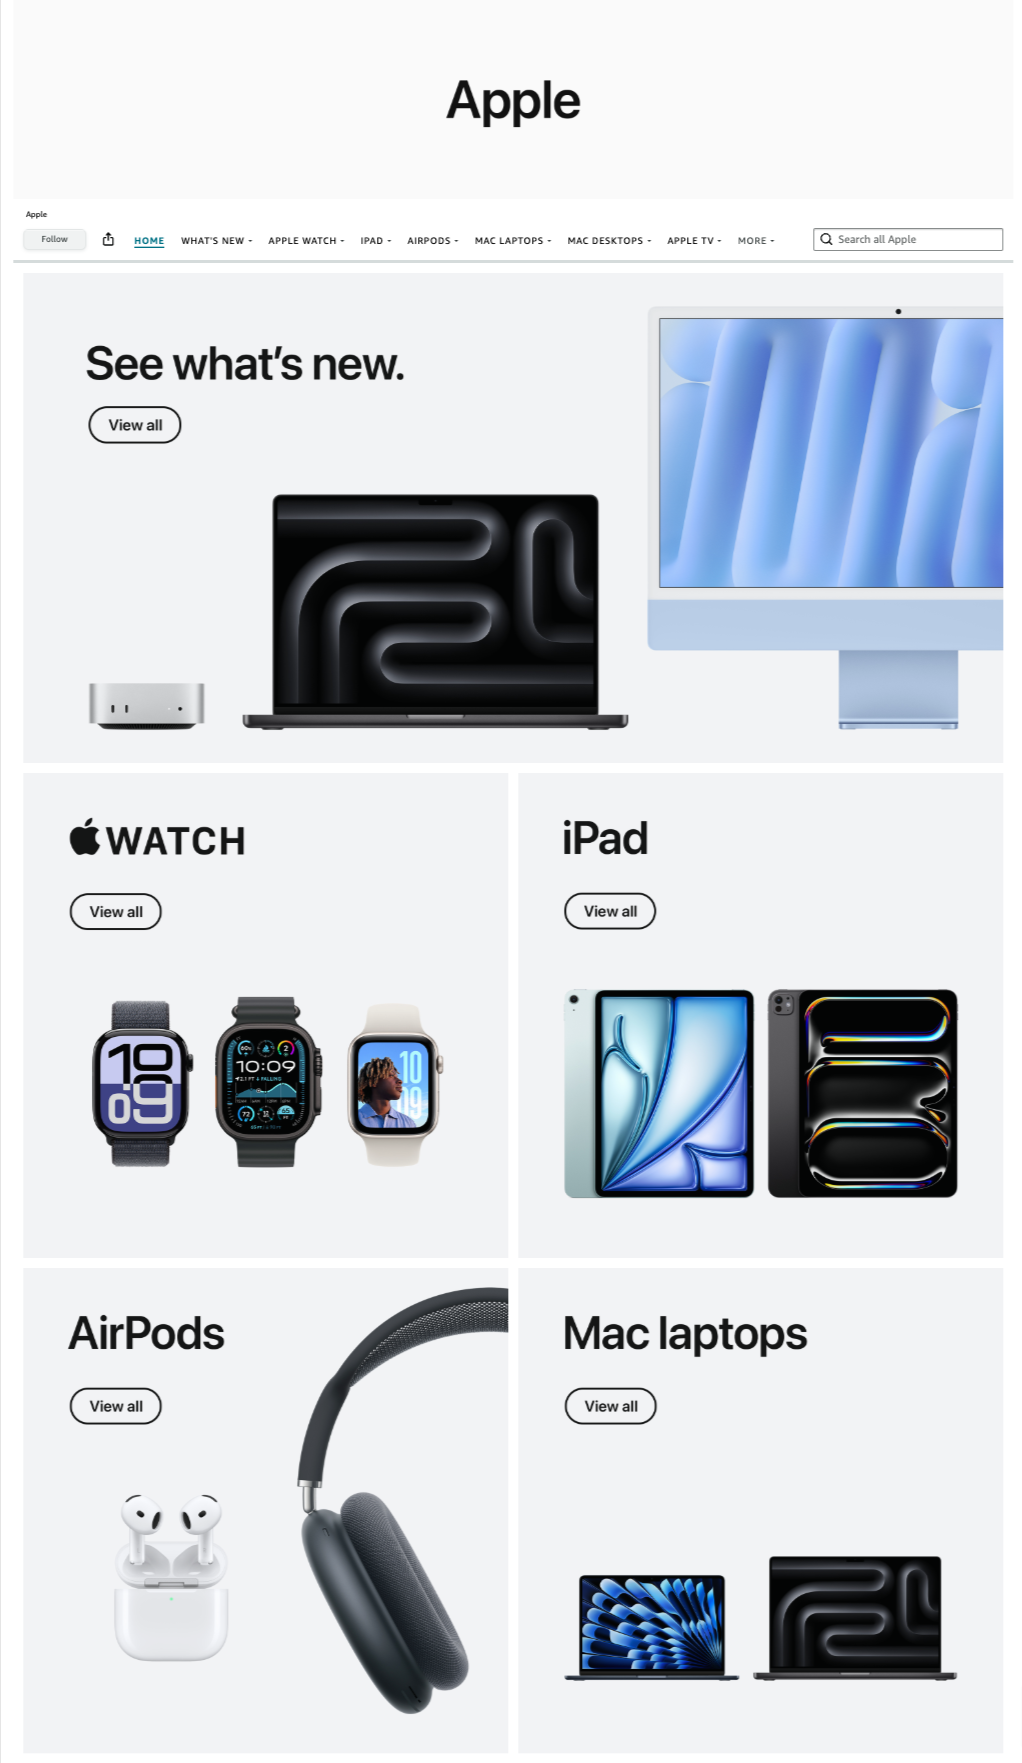
Below is an example of the Apple Brand store design. It excels in delivering a clean, minimalist aesthetic that aligns perfectly with Apple’s premium branding. The clear product categorization, high-quality images, and intuitive navigation create a seamless shopping experience that feels refined and sophisticated.
Apple Amazon Brand Store Example
Clean and Minimalist Design — The store features a sleek, modern aesthetic with ample white space, making it visually appealing and easy to navigate.
Clear Product Categorization — The layout effectively separates product categories (Mac laptops, iPads, Apple Watch, AirPods), making it easy for users to find what they’re looking for.
High-Quality Product Images — The store uses crisp, high-resolution images that showcase the products effectively, improving engagement and conversion rates.
Easy Navigation — The top navigation bar includes a clear structure with product categories, a search bar, and a “View All” button under each category, which aligns with Amazon’s best practices for user-friendly navigation.
Strong Branding — The store maintains Apple’s consistent branding with its iconic typography, imagery, and design language, enhancing trust and brand recognition.
While traditional e-commerce best practices often emphasize promotions, reviews, and aggressive CTAs, Apple’s approach prioritizes elegance, simplicity, and brand trust over clutter.
The absence of discounts or social proof may seem like a drawback in a typical online store, but for a brand like Apple, it reinforces exclusivity and confidence in its products.
Instead of overwhelming customers with urgency-driven tactics, the design encourages exploration and discovery through subtle yet effective navigation cues. This balance ensures the store remains both aesthetically appealing and functionally effective, reflecting Apple’s philosophy of merging technology with effortless user experiences.
Amazon Brand Store Templates
You can use pre-made templates and a drag-and-drop interface to develop a store that suits your brand identity and highlights your best-selling products.
One design best practices is the “above the fold” section of a Store — what it is, why it matters, and how to leverage it effectively. Traditionally, “above the fold” refers to the top section of a newspaper or newsletter, visible without unfolding the page. In a digital context, particularly for Amazon Stores, it represents the content immediately visible when a shopper lands on the page — before scrolling.
Source: Amazon
This prime real estate is crucial for capturing attention, establishing brand identity, and making a strong first impression. Since shoppers tend to focus on this area, optimizing it can significantly impact engagement and conversions.
Once you’ve built your Brand Store, the next step is attracting visitors. Customers can find your store by clicking on your brand byline on Amazon product detail pages or by visiting the short URL for your store. The “store byline” is the link near the top of a product detail page.
You can also use your store as a landing page for Amazon or non-Amazon marketing efforts, helping boost brand awareness and cross-selling opportunities.
Below are five strategies to help generate traffic and engagement:
Sponsored Brands
One of Amazon’s self-service advertising tools is Sponsored Brands. When configuring a Sponsored Brands campaign, you decide whether to direct customers to a custom landing page featuring a product collection or to your Brand Store. Data shows advertisers who linked their Sponsored Brands campaigns to a Store saw shoppers spend twice as long on their Store. Additionally, there was a 55% increase in product detail page views and a 15% increase in sales.
Byline
The byline appears near the product title in blue text on product detail pages. This link can drive organic traffic to your Brand Store. Shoppers curious about your brand can click on the byline and land directly on your Store.
Posts Posts on Amazon can also help drive visitors to your Brand Store. When customers see your post and feel inspired, they can click through to reach your Store directly. This creates a smooth transition from your content to exploring more about your brand, products, and story.
External Traffic
You can also encourage audiences on external platforms — such as social media, email marketing, or your own website — to visit your Brand Store by sharing a trackable link. In your Store’s insights dashboard, you can create a source tag for each link, then track the traffic and engagement from these external sources.
Search Engine Optimization (SEO)
You can leverage SEO in a few ways to drive traffic:
Google Sitemap: Brand Store pages’ URLs are included in Google’s Sitemap, which notifies search engines about your pages to crawl and index.
Canonical URLs: For Brand Stores that share the same name as the brand byline, a canonical URL is generated containing both the Store and page name. This helps search bots recognize the relationship between the Brand Store and relevant keywords.
Deep-linking on iOS: Brand Store links posted on third-party sites automatically open the Amazon Shopping app on iOS if it’s installed, leading shoppers directly to your Store page.
Stores Insights
The Stores insights feature provides data on your Store’s performance, including traffic metrics and sales figures broken down by both traffic source and Store page.
Once your Brand Store is live, you can monitor its progress using the insights dashboard. Here’s how to access it:
In the left navigation menu of your Amazon Ads console, click the Brand home icon.
Select Stores.
Locate your Store and click See Insights.
If you’re using the Store builder, switch to the Insights tab within the builder. You can view metrics for the entire Store or for specific pages currently being viewed.
The insights dashboard highlights daily visitors, page views, and sales attributed to your Store. You can export some of this data as a CSV file, but there are no dedicated Stores insights reports beyond what’s in the dashboard. Data appears as follows:
Page views and visits: Available the next day.
Attributed units and sales: Available after two days.
For example, on a Wednesday, you can see views and daily visits up to Tuesday and attributed units and sales up to Monday.
Navigating the Stores Insights Dashboard
A sidebar lets you switch between the different reports: Overview, Traffic, Engagement, Sales, Pages, and Sources. Each view displays your data in graph form.
You can adjust the date range to get insights over various windows of time and compare performance across different periods.
The Overview tab provides a big-picture summary of your Store’s performance. You can see multiple dimensions at once, then dive deeper into each individual metric through the other tabs.
Traffic
The Traffic section has four key dashboards:
Daily Visitors: Displays the number of visitors per day. Use this to assess whether your Store promotions or advertising tactics are attracting consistent traffic.
Page Views: Shows how many page views you receive each day, including repeat views by the same audience. You can gauge whether customers are browsing multiple pages and how often they’re returning.
Top Sources by Views: Shows where visitors are coming from, helping you identify which channels are most effective in driving Store traffic. This can inform adjustments to your marketing strategy.
Top Pages by Views: Lists the most frequently viewed pages in your Store. These insights help you learn which product categories or collections are generating the most interest.
Engagement
The Engagement tab focuses on how customers interact with ASINs within your Brand Store. Insights on ASIN clicks, click-through rates, and purchases can help you improve your Store layout and increase overall engagement.
Benefits of using the Engagement tab:
Identify high-performing and most-viewed ASINs to optimize the Store layout and increase click-through and purchase rates.
Gain visibility into products with the best engagement (view-based CTR) and sales (click-based CVR), guiding decisions on which ASINs to feature more prominently.
Spot consumer trends around pricing, inventory, and product planning.
Data available in this tab includes:
Product Engagement Totals: Summaries of ASIN views, clicks, and overall click-through rates.
Top-Clicked Product: Identifies the most-clicked ASIN and displays its views, clicks, CTR, purchases, conversion ratio, and average sale price.
Product Engagement: Detailed metrics for each ASIN, including renders, views, in-stock views, in-stock view rate, average in-stock price, clicks, CTR, add-to-cart, purchases, units sold, conversion ratio, and average sales price.
You can scroll horizontally to see all columns, or use the search box to filter for specific ASINs. For more details, visit the Stores metrics section.
Sales
The Sales tab has four primary dashboards:
Sales: Shows total sales over the chosen time frame, with a dotted line indicating the average daily sales. Use this to see whether your Store and marketing efforts are boosting revenue.
Units Sold: Reveals how many individual products you’ve sold (in units). A dotted line indicates your average daily unit sales for the period.
Top Sources by Sales: Breaks down how customers found your Store before making a purchase. This helps you pinpoint which traffic sources are most profitable.
Top Pages by Units: Shows which pages lead to the most units sold. By examining this data, you can see which pages are most effective at prompting deeper exploration of your products.
Stores Metrics
The Stores insights dashboard offers detailed information on traffic and sales so you can evaluate your Store’s performance.
Here are the key metrics included:
Add to cart: Number of times customers clicked the “Add to cart” button in your Store.
Avg. sales price: Average price of units sold on Amazon within 14 days of the shopper’s last visit to your Store. Includes products listed on your Store or elsewhere under your brand.
Clicks: Number of times a shopper clicked a product in your Store.
Click-through rate (CTR): Percentage of viewers who click a product, calculated as clicks divided by views.
Conversion ratio: Percentage of units sold (attributed to your Store) divided by clicks. Attributed sales are products purchased within 14 days of a visitor’s Store visit.
In stock views: Views where more than 50% of the product tile was visible for over 1 second while the product’s availability status was “in stock.”
In stock view avg. price: Average product price when the product was viewed in-stock.
In stock view rate: Percentage of product views in your Store that occur while the product is in stock.
Orders: Estimated total orders placed by Store visitors within 14 days of their visit. Each order can contain one or multiple units sold.
Purchases: Number of orders in which a specific product was purchased, attributed to your Store. One order can include multiple products.
Renders: Number of times the product fully loaded within your Store’s interface.
Sales: Estimated total sales generated by Store visitors within 14 days of their visit.
Sales/Order: Average sales per order.
Sales/Visit: Average sales per visit.
Sales/Visitor: Average sales per visitor.
Units sold:Number of individual units sold (across any products under your brand) within 14 days of their last Store visit.
Units/Order:Average units purchased per order.
Views:Number of times more than 50% of a product tile was viewed for more than 1 second.
Views/Visitor: Average page views per visitor.
Views/Visit: Average page views per visit.
Visitors: Total unique visitors to your Store during the selected period. A single visitor may view multiple pages or arrive through multiple sources.
Visits:Total visits to a page or from a traffic source on a single day. One visitor can make multiple visits, and can also arrive via different sources.
Dimensions
Date: Calendar date of the visit.
Page: Which Store page was viewed. Data for deleted pages is aggregated under “deleted page.”
Traffic source: The channel that led the visitor to your Store.
Traffic Source Types
Sponsored Brands: Traffic from Sponsored Brands ads.
Amazon organic traffic: Traffic from the brand byline link on product detail pages.
Your tags: Traffic that came from a custom source tag you created.
Other sources: All other traffic, for instance, URL shares on various social media platforms.
Watch For Out-of-Stock Products in Stores
When featured products in your Store go out of stock, these best practices can help maintain a positive customer experience:
If you have fewer than 16 ASINs in a product grid, avoid using “Hide out of stock”. Instead, keep products visible, so customers don’t encounter empty product grids.
If you have more than 16 ASINs and anticipate some going out of stock, you can use Hide out of stock to show only in-stock items.
If a large portion or an entire product grid is out of stock, consider updating your grid to highlight only the most vital ASINs. Alternatively, feature a top product using a full-width product tile without using “Hide out of stock.” You can re-expand the collection once the items return to stock.
If your page only displays a product grid, incorporate other elements (like video) to keep shoppers engaged when items are out of stock.
Short URL for Stores
Once your Store is published, a long URL is automatically created. You can replace it with a short URL for easier recall. Note that this short URL only links to the homepage of your Store.
Tip:Plan URL edits or deletions wellin advance of major sales or holiday eventsto avoid disruptions.
Best Practices for Creating a Short URL
DoDon’t Ensure the short URL includes your brand name or something closely related to your Amazon Ads account. For example, amazon.com/[brandname] Use generic category names, such as amazon.com/toys, or Amazon-owned trademarks (e.g., Fire, Kindle, Alexa, Echo). Characters like “-” or “_” can replace spaces if needed, for example: amazon.com/brand_name Start or end your short URL with “-” or “_” or use special characters like @, $, #, *, /. City names are allowed if they’re part of your brand name, e.g., amazon.com/BostonLager Use a city name that conflicts with an Amazon internal product or trademark, e.g., amazon.com/Seattle.
Note:The short URL works across all marketplaces, but is only displayed on the Amazon.com domain.
Stores Eligibility Requirements
Brand Stores are available to sellers enrolled in Amazon Brand Registry, vendors, and agencies. You don’t need to run Amazon ads to create a Store, but you must meet the Stores eligibility requirements.
Content Requirements
In addition to having a valid account, your Store must comply with all Stores content guidelines to pass moderation and go live. Most reviews finish within 24 hours, but they may take up to three business days.
Why the Search Terms Report is Essential for Sponsored Brands
Choosing the right keywords can be tricky. You want to reach shoppers most likely to buy, not waste your budget on terms that don’t convert. The Keyword Report shows you exactly which keywords are working and which aren’t, helping you:
Understand which search terms lead to sales and which don’t
Make smarter decisions about bidding and budget
Find new keyword ideas to grow your brand reach
By seeing actual data on impressions, clicks, and conversions, you’ll spend your money more wisely and gain an edge in the marketplace.
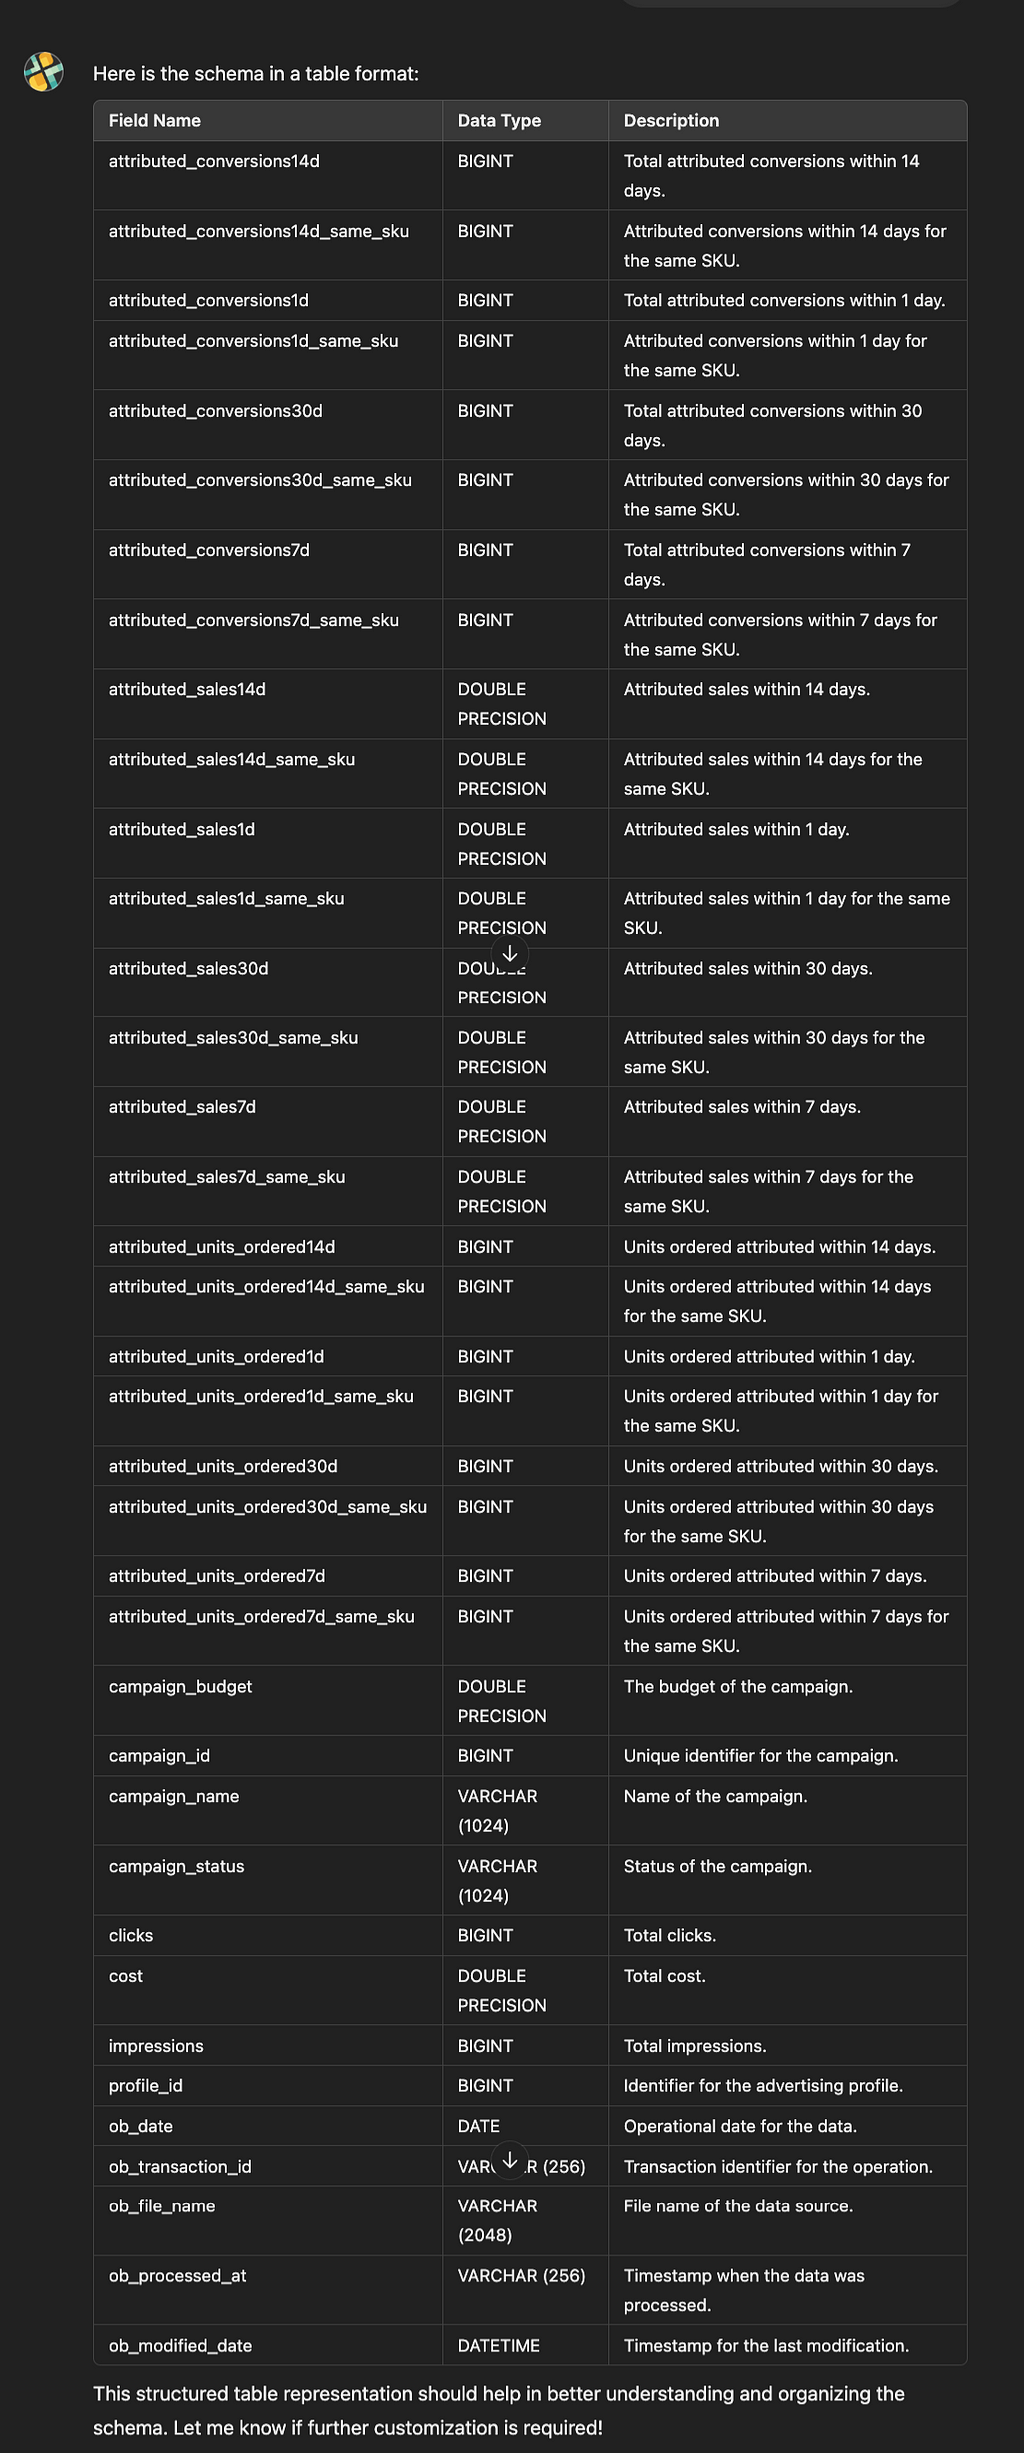
Key Metrics Featured in the Sponsored Brands Search TermsReport
The report includes a few essential metrics. Understanding them will help you spot trends and opportunities:
Impressions: How often does your ad show up?
Clicks & Click-Through Rate (CTR): Are people who see your ad clicking it?
Cost-Per-Click (CPC): How much you pay each time someone clicks.
Conversions & Conversion Rate: How many clicks lead to sales.
New-to-Brand Sales: How many first-time customers your brand is winning.
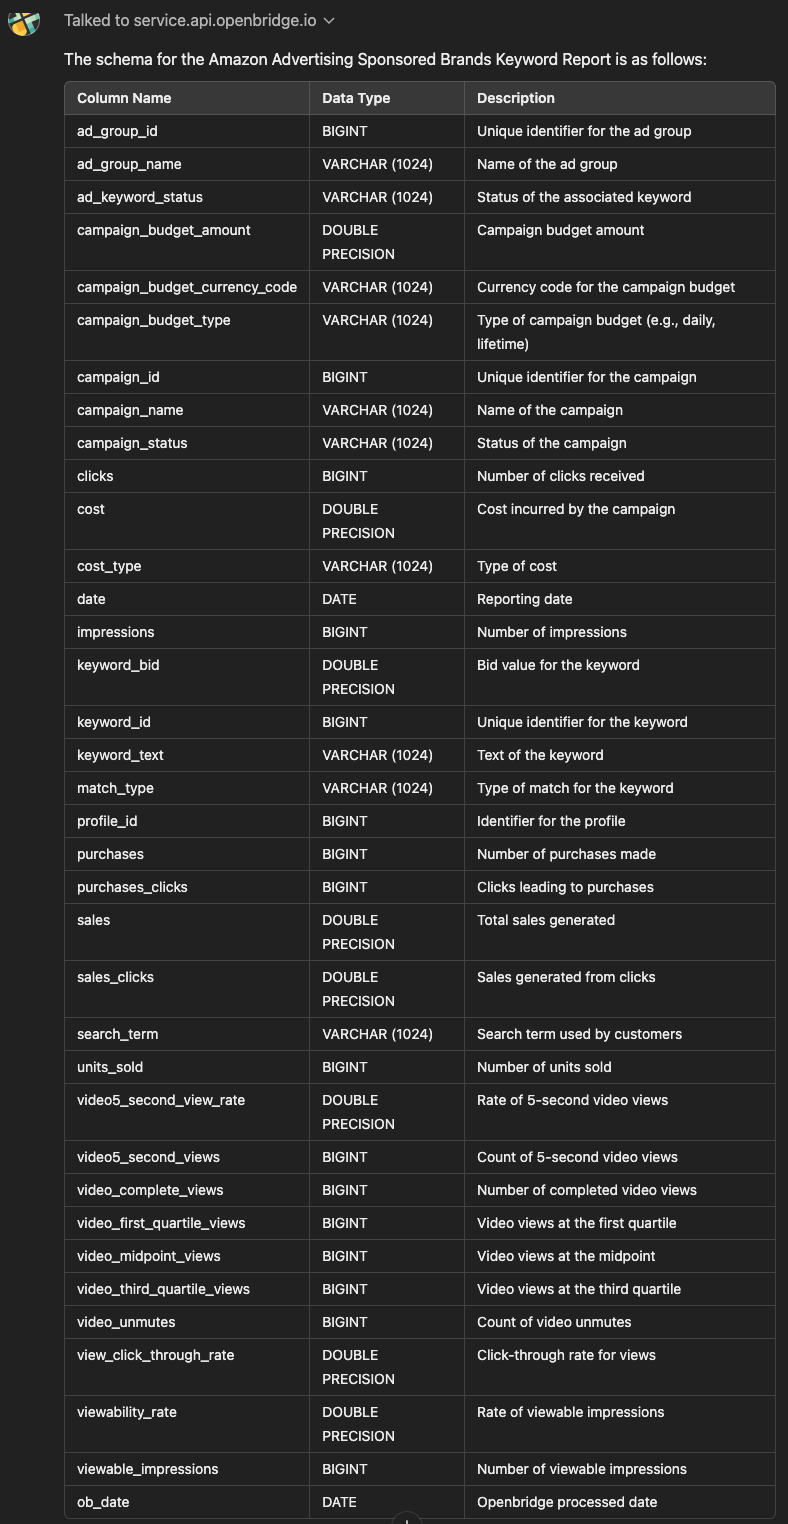
These are not the only metrics, using the Openbridge AI Data Copilot, you can see the complete Sponsored Brands Search Term Report schema:
With the various report metrics, you can see what’s working and what’s not. For example, a high CTR but a low conversion rate might mean shoppers are curious but unconvinced. A strong New-to-Brand number suggests you’re drawing fresh eyes to your brand.
Identifying High-Performing and Low-Performing Keywords
Once you have the report, it’s time to dig in. Looking for winners? Check for:
High CTR and conversions
Low CPC
Strong New-to-Brand sales
These are the keywords you may want to invest more in. Conversely, consider lowering bids or pausing keywords with low CTR, high costs, or weak sales. For example, if “organic dog treats” drive strong conversions while “healthy dog snacks” barely get clicks, focus on “organic dog treats (seeAmazon Ads Learning Console — Optimization Tips).
Leveraging Match Types for Better Targeting
Match types control how closely a shopper’s search must match your keyword. If the Keyword Report shows:
Exact match terms are converting well, you might raise bids on those terms.
Broad match terms are getting clicks but not sales; it might be time to refine them.
Phrase match terms doing well might be worth testing as exact matches to fine-tune targeting.
Using the report’s data, you can adjust which match types you emphasize. For instance, switching a high-performing broad match keyword to an exact match can focus your reach and reduce wasted ad spend.
Integrating Insights from the Search Term Report into Campaign Management
The Keyword Report isn’t just a bunch of numbers — it’s a roadmap. Use it to:
Adjust bids: Spend more on keywords that drive profits and spend less on ones that don’t.
Revise budgets: Shift more of the budget to performing the best campaigns.
Add or remove keywords: Add fresh keywords or remove those that don’t measure up.
Make it a habit to review your Keyword Report regularly. Checking it every month or quarter can help you stay on top of trends and respond to changes quickly. Pairing these insights with other Amazon ads reports — like the Search Term Report — gives you a complete picture of your campaign performance.
Expanding Keyword Lists with Search Term Insights
Your Search Term Report can also help you grow. You can add those as new keywords by reviewing the search terms that deliver strong results. On the flip side, you can also add low-performing search terms as negative keywords to block them, saving money. This constant refining helps you reach the right shoppers and improve your campaign health.
How to Be a Data-Driven Advertiser: Manual or Automation?
Here’s how to manually get your Search Term Report:
Log in: Access your Amazon Advertising console.
Find Reports: Click on the “Reports” tab in your dashboard.
Choose Sponsored Brands: Select “Sponsored Brands” and then pick “Keyword” as the type.
Select Timeframe: Pick “daily” or “summary” data.
Download: Hit “Run Report” and then download the file (usually in CSV format).
Looking to automate the flow of these reports?
Getting Started with Keyword Report Automation
Ditch the messy, manual reporting for Sponsored Brands Keyword Reports. Automated data feeds guide data-driven decision-making to improve off-Amazon digital marketing campaigns. Leverage attribution insights to refine strategies, allocate resources efficiently, and enhance customer engagement across all touchpoints.
Openbridge will unify and deliver performance data to data lakes or warehouses like Redshift, Google BigQuery, Snowflake, Azure Data Lake, and Amazon Athena, giving you a single source of truth. This unified data can turbocharge reporting and analytics tools like Google Data Studio, Tableau, Microsoft Power BI, Looker, Amazon QuickSight, SAP, Alteryx, dbt, Azure Data Factory, and Qlik Sense.
If you’re selling products on Amazon and running ads, you’re probably familiar with the importance of tracking and optimizing your ad performance. But how can you know if your efforts are paying off? That’s where the Amazon Advertising Sponsored Product Campaign Report comes in.
Whether new to Amazon advertising or looking to sharpen your strategy, understanding these reports can make a huge difference in maximizing your ad spending and growing your business.
Understanding the Campaign Report for Sponsored Products
The Campaign Report for Sponsored Products is a comprehensive tool designed to show how well your ads perform over a specified period. You can use it to evaluate everything from daily performance to monthly trends, allowing you to make informed decisions on improving your campaigns.
This report summarizes the performance of your Sponsored Products ads across different campaigns. It tracks crucial metrics and helps you analyze the effectiveness of your ad strategies. You can use it to:
Track your ad spend
See how many impressions (views) your ads are getting
Measure how often people are clicking on your ads
Evaluate how much revenue your ads are generating
In short, the Campaign Report is your one-stop shop for tracking how well your ads are doing and what changes need to be made.
Types of Data Available in the Report
The Sponsored Product campaign report offers a variety of data types that can be helpful depending on how deep you want to dive into your ad performance. When you drill down into your report, you’ll see a variety of metrics that give a complete view of your campaign’s performance. Key metrics include:
Impressions: Understanding impressions can help you gauge the reach of your ads. If your impressions are low, it might indicate that your ads aren’t being shown to enough people.
Clicks: Clicks are a critical metric. A high click-through rate (CTR) generally means your ad appeals to customers. If clicks are low, your ad needs better call-to-action or more engaging visuals.
Spend: This metric shows how much money you’ve invested in the campaign. Tracking spend is essential for understanding whether you’re getting a good return on your investment.
Sales: Sales data is crucial in determining the effectiveness of your ads. If you get lots of clicks but low sales, your landing pages or product listings may need improvement.
ACoS and RoAS: These two metrics go hand-in-hand. A low ACoS means you’re spending less on ads than the sales generated, while a high ROAS shows that your advertising dollars are being used effectively.
If you want a real-time AI-driven Amazon Advertising data copilot, the Openbridge AI Data Copilot can get you there fast:
How to Use Campaign Reports to Optimize Ad Performance
As you continue using these reports, remember that consistent analysis and optimization are the keys to success. Regularly review your campaigns, make necessary changes, and continue testing new strategies. The more you engage with your campaign data, the better your results will be.
Identify High-Performing Campaigns The first step is to identify which campaigns are doing well. Look for campaigns with high sales and a low ACoS. These campaigns are performing effectively, and consider increasing your budget for them or scaling your efforts.
Spotting Underperforming Campaigns If some campaigns have high ACoS or low sales, it might be time to re-evaluate. Here’s what you can do to improve underperforming campaigns:
Adjust your bids: If your ads aren’t getting enough impressions, you might need to increase your bid.
Change your targeting: Try targeting different keywords or your product targeting to reach a more relevant audience.
Update your ad copy: Sometimes, the wording or images in your ads might not resonate with customers. Test different versions to see what works best.
Adjusting Campaign Settings Once you’ve reviewed your data, it’s time to make adjustments. Consider:
Reallocating your budget: If a particular campaign performs well, consider increasing its budget while cutting back on less effective ones.
Modifying your targeting: Targeting the right audience is key. Use your report data to see which keywords or products generate the best results and focus more on those.
Optimizing your bidding strategy: If certain keywords are performing better than others, increase your bid for those keywords to ensure your ads get shown more often.
Getting Started with Amazon Ads Sponsored Products Data Automation
Ditch the messy, manual reporting for the Amazon Ads Sponsored Product Campaign Report. Automated data feeds guide data-driven decision-making to improve off-Amazon digital marketing campaigns. Leverage insights to refine strategies, allocate resources efficiently, and enhance customer engagement across all touchpoints.
Openbridge will unify and deliver performance data to leading data lakes or cloud warehouses like Redshift, Google BigQuery, Snowflake, Azure Data Lake, and Amazon Athena for an analytics-ready single source of truth to fuel informed decisions on brand building strategy, media, and customer demand for Amazon.
With your data unified, start to turbocharge reporting, analytics, and business intelligence tools like Google Data Studio, Tableau, Microsoft Power BI, Looker, Amazon QuickSight, SAP, Alteryx, dbt, Azure Data Factory, Qlik Sense, and many others.
For Amazon Sellers and Vendors, the Amazon AdvertisingCampaign Report for Sponsored Brands is a vital tool that offers deep insights into campaign performance. By understanding and utilizing the wealth of information it provides, you can optimize your campaigns, improve ROI, and strategically grow your business.
Understanding the Amazon Advertising Sponsored Brand Campaign Report
The Amazon Advertising Sponsored Brand Campaign Report summarizes your campaign performance over a selected date range. It’s available for Amazon Sellers and Vendor Central retailers running Sponsored brand campaigns.
Key Features of the Campaign Report
By leveraging this report, you can gain valuable insights into your campaigns’ performance and make informed decisions to enhance your advertising efforts. The report offers an aggregated overview of your campaign performance.
Assess Campaign Effectiveness: Identify which campaigns are meeting objectives.
Optimize Budget Allocation: Redirect funds to high-performing campaigns.
Strategize Growth Opportunities: Spot areas for expansion and increased ROI.
Branded Searches: Measures brand awareness by tracking how often customers search for your brand.
New-to-Brand Metrics: Indicates the number of first-time purchasers, highlighting customer acquisition success.
Sales: Total revenue generated from campaigns.
Return on Ad Spend (ROAS): Evaluate the efficiency of your advertising spend.
Analyzing these metrics allows you to tailor strategies to different customer journey stages, from awareness to conversion.
Optimizing Campaigns Based on Report Insights
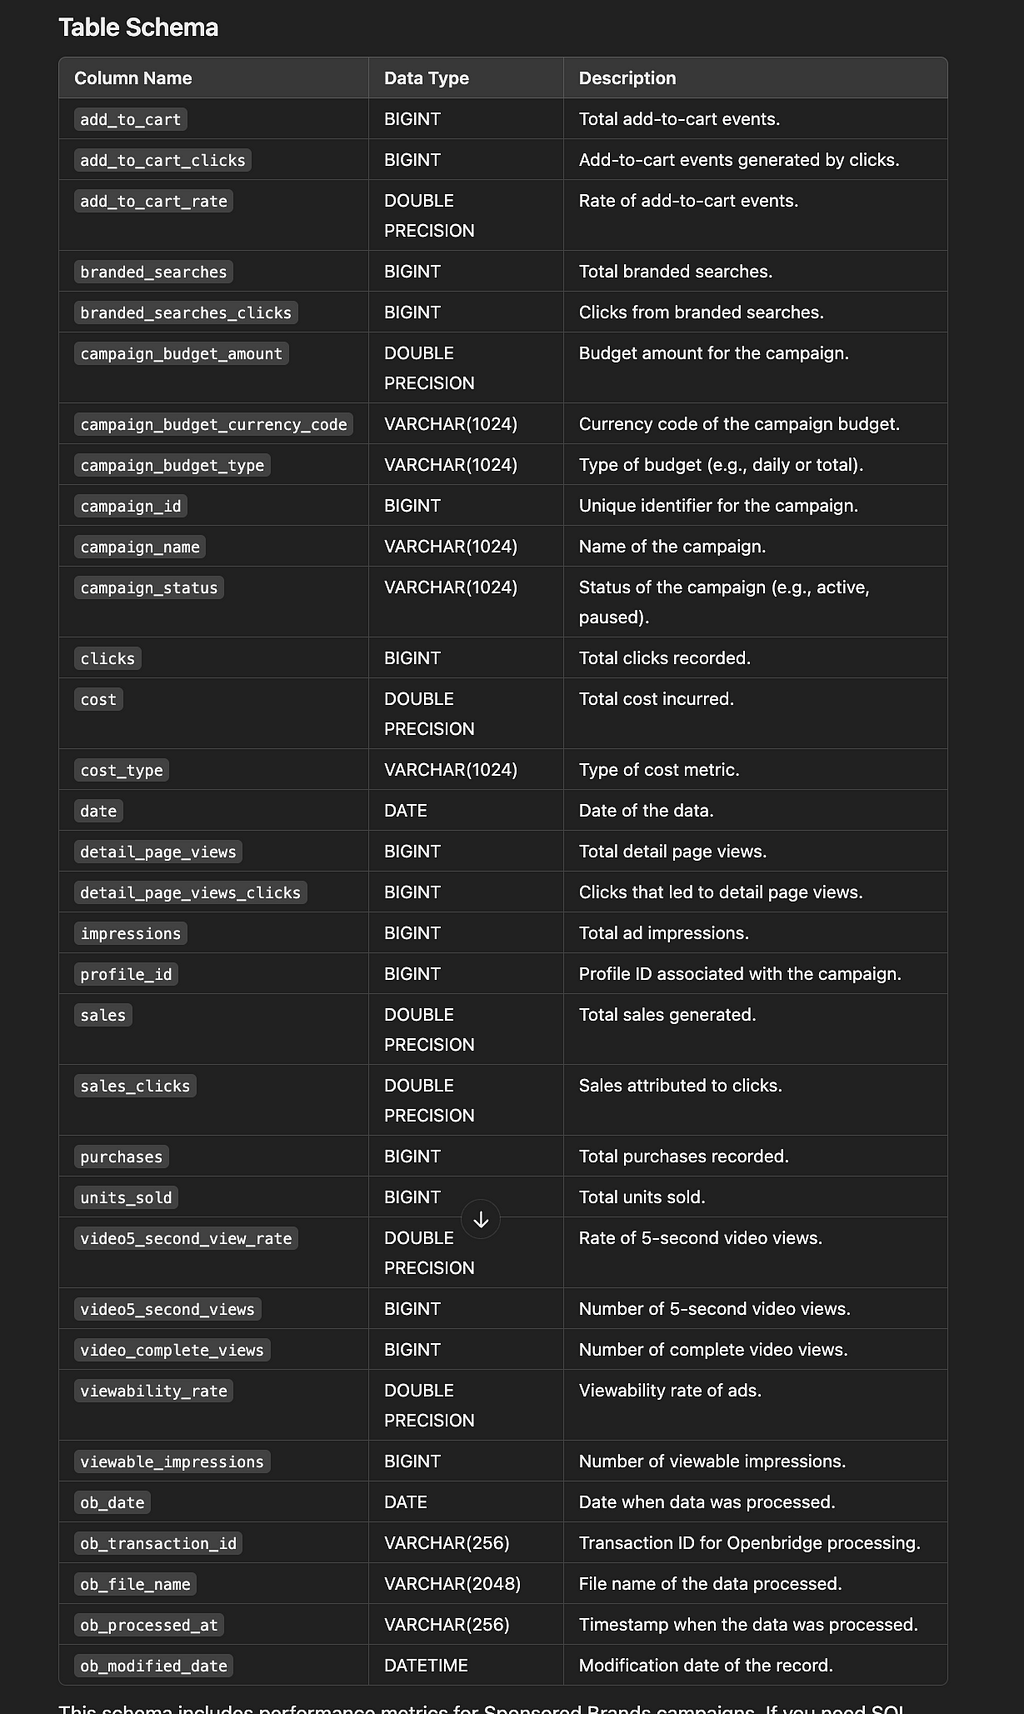
Here are suggestions for optimizing your Sponsored Brand campaigns based on the insights provided in the amzn_ads_sb_campaigns report:
Enhance Budget Allocation
Action: Monitor campaign_budget_amount and campaign_budget_type to ensure campaigns with high conversion rates (sales/clicks) or click-through rates (view_click_through_rate) have a sufficient budget.
Why: High-performing campaigns may require increased budgets to avoid missed opportunities due to budget constraints.
Improve Targeting Strategy
Action: Use data on branded_searches and branded_searches_clicks to identify the effectiveness of brand-related keywords. Invest in high-converting branded terms. Exclude underperforming or irrelevant keywords (negative targeting).
Why: Focus on targeting terms with the highest relevance and performance to maximize return on ad spend (ROAS).
Analyze Audience Behavior
Action: Leverage new_to_brand_detail_page_views and new_to_brand_units_sold to evaluate the acquisition of new customers. Develop campaigns targeting segments that show high engagement or conversion potential.
Why: Prioritizing new-to-brand customers can grow your customer base and ensure long-term profitability.
Optimize Ad Creative
Action: Review video5_second_view_rate, video_complete_views, and viewability_rate for video campaigns. Test new creatives with higher engagement. Improve video length, content relevance, and call-to-action clarity to increase completion rates.
Why: High-performing visuals and engaging videos enhance brand recall and drive action.
Refine Bidding Strategy
Action: Analyze top_of_search_impression_share to evaluate visibility. Increase bids for high-performing campaigns or keywords with strong conversion rates. Lower bids for underperforming campaigns to improve cost efficiency.
Why: Competitive bids improve placement in high-visibility areas like the top of search results, maximizing clicks and conversions.
Adjust for Seasonality
Action: Use the date column to identify seasonality trends in performance metrics like impressions, clicks, and sales. Increase spend during peak periods for your category. Decrease spend during slower periods while maintaining brand visibility.
Why: Aligning budgets and strategies with demand cycles ensures efficient use of advertising resources.
Monitor Campaign Status
Action: Regularly review campaign_status for campaigns that may be paused or not delivering impressions. Address issues causing campaigns to pause (e.g., budget exhaustion, eligibility issues).
Why: Active management ensures consistent campaign performance and avoids downtime.
Focus on Conversion Optimization
Action: Track metrics like purchases, units_sold, and sales for campaigns and refine: Ad copy or offers to boost conversions. Landing pages to reduce friction and improve purchase likelihood.
Why: Conversion-centric strategies improve overall campaign profitability and ROAS.
Manage Invalid Traffic
Action: Use metrics like gross_impressions and invalid_impressions (from other related datasets) to identify and reduce invalid traffic.
Why: Reducing invalid impressions and clicks protects ad spend and ensures a higher share of genuine customer engagement.
A/B Testing
Action: Test variations in creatives, budgets, or targeting strategies and compare performance metrics (add_to_cart_rate, detail_page_views_clicks, new_to_brand_purchases_rate).
Why: Continuous testing uncovers strategies that drive better performance over time.
Enhancing Data Analytics with Openbridge
Ditch the messy, manual reporting for the Amazon Advertising Sponsored Brand Campaign Report. Automated data feeds guide data-driven decision-making to improve off-Amazon digital marketing campaigns. Leverage attribution insights to refine strategies, allocate resources efficiently, and enhance customer engagement across all touchpoints.
Openbridge unifies and delivers performance data to leading data lakes and cloud warehouses, including:
Amazon Redshift
Google BigQuery
Snowflake
Azure Data Lake
Amazon Athena
Databricks
This creates an analytics-ready single source of truth, fueling informed decisions on brand strategy, media planning, and understanding customer demand on Amazon. Unified data from Openbridge can turbocharge reporting and analytics tools like:
Looker Data Studio
Tableau
Microsoft Power BI
Looker
Amazon QuickSight
SAP
Alteryx
dbt
Azure Data Factory
Qlik Sense
Integrating with these platforms can enhance customer engagement across all touchpoints.
Getting Started with Amazon Advertising Campaign Report Automation
Openbridge specializes in delivering unified, analytics-ready data solutions. By providing code-free, fully managed data pipelines, Openbridge helps businesses harness the full potential of their data without the complexities of manual processes.
This guide will provide an in-depth overview of managing orders in Amazon Vendor Central, covering everything from onboarding to effectively handling bulk shipments. Whether you’re just getting started or looking to refine your processes, this comprehensive post will guide you through the core features of Direct Fulfillment.
Key Differences in Managing Direct Fulfillment Orders
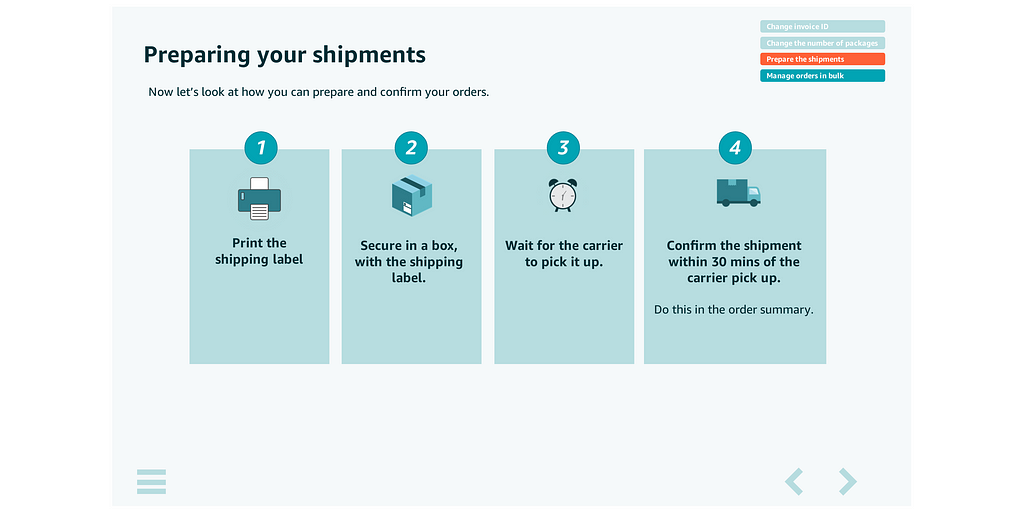
One significant difference between direct fulfillment and traditional fulfillment by Amazon (FBA) is the prep work for each ASIN. Unlike FBA, where products are sent to Amazon’s fulfillment centers in bulk, Direct Fulfillment requires individual packing, and vendors need to apply specific labels to each package.
Additionally, Direct Fulfillment requires confirming the order right after the carrier picks it up, ensuring Amazon and the customer are notified immediately about the shipment’s progress.
What is Amazon’s Direct Fulfillment program for?
This program is designed for vendors onboarded into Amazon’s Direct Fulfillment program. Direct Fulfillment is Amazon’s drop-ship model, where vendors pack and ship products directly to customers rather than sending stock to Amazon’s fulfillment centers.
If you haven’t been onboarded onto Direct Fulfillment yet, Amazon offers a separate training called What Direct Fulfillment? in the Vendor Central Training Center. This training provides essential insights into the program and its benefits.
Critical Tasks in Order Management
Managing orders in Vendor Central involves a few essential tasks to ensure a smooth fulfillment process. These include:
Changing the Invoice ID: Vendors may need to update the invoice ID to avoid confusion with internal accounting systems. You must note that you can only do this before shipping the item.
Changing the Number of Packages to be Shipped: Sometimes, an order may need to be adjusted based on packaging requirements.
Preparing Shipments: Ensuring all items are packed properly with appropriate labels.
Managing Orders in Bulk: Efficiently managing multiple orders using spreadsheets.
We’ll dive into the specifics of these tasks to help you manage your orders more effectively.
Changing the Invoice ID
To change the invoice ID in Vendor Central, follow these steps:
Select “Update with Spreadsheet”: At the top of the Customer Orders page, click on “Update with Spreadsheet.”
Download and Edit the Spreadsheet**: Select the appropriate warehouse and download the shipments template file. Once downloaded, modify the **Order ID** column in Excel, ensuring that the correct ID is used for your records.
Upload the Updated Spreadsheet**: Save the edited file and upload it back to Vendor Central using the “Browse for updated file” button.
What Happens If You Don’t Ship Within the Required Ship Date?
Timeliness is crucial in Direct Fulfillment. If you fail to ship an order within the required ship date, Amazon grants a grace period of 7 days to confirm the shipment of the item.
Failure to meet this deadline will automatically cancel the order. In this case, a chargeback will be issued, and you cannot invoice the item.
Accessing Your Orders
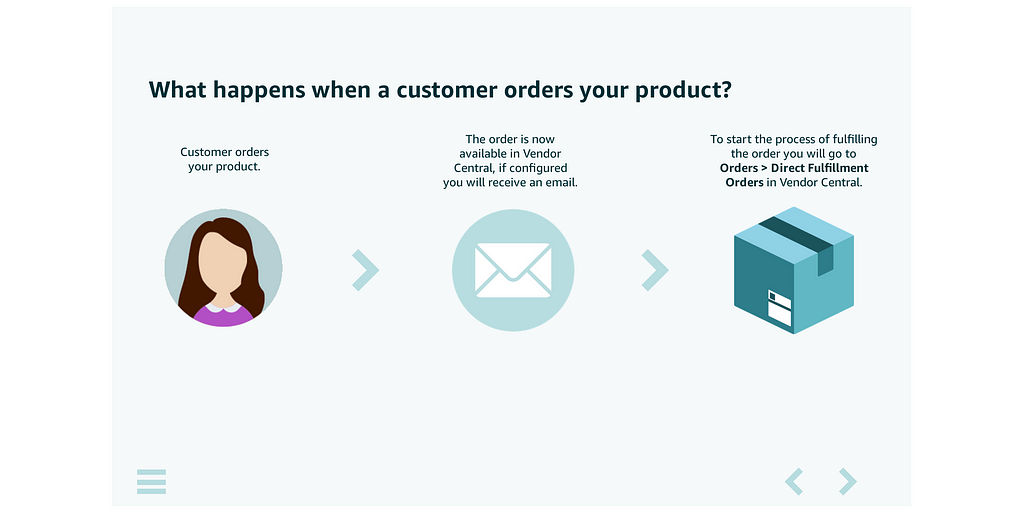
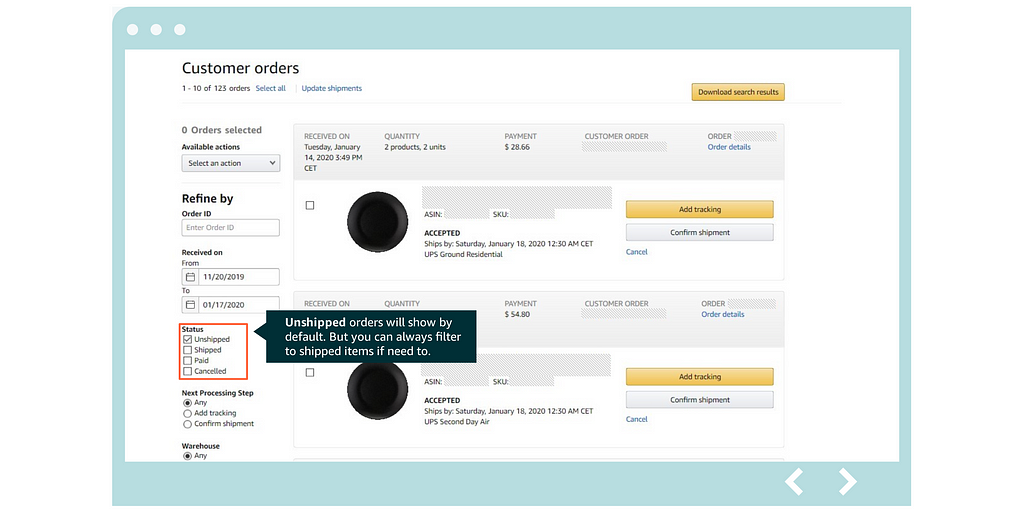
To access your Direct Fulfillment orders in Vendor Central, go to: Orders > Direct Fulfillment Orders
You can view both unshipped and shipped orders. By default, unshipped orders will be displayed, but you can filter to show shipped items if needed.
Receiving Orders
Orders received through Direct Fulfillment include detailed information on the latest shipping date and time. This information can be viewed under the “Expected Ship Date (ExSD)” and “Ship Method (SM).” It’s essential to note these details to avoid any delays or penalties.
Managing Orders in Bulk
Direct Fulfillment allows for bulk order management through spreadsheet updates, making it easier for vendors to process multiple shipments simultaneously. To manage orders in bulk:
Download the Shipment Template: This template helps update all the relevant information for multiple orders.
Edit Shipment Details: Fill in details like tracking numbers, package contents, etc.
Submit the Spreadsheet: Upload the updated spreadsheet to Vendor Central to apply the changes.
Vendor Central Direct Fulfillment is a powerful tool for vendors who want to take control of the shipping process while leveraging Amazon’s vast reach. Staying proactive and detail-oriented with each order will lead to a smoother fulfillment experience, better customer satisfaction, and a strong partnership with Amazon.
For more information on the Amazon technical documentation for Vendor Central, see start with the SP-API Vendor Direct Fulfillment guide.
Unlock Effortless Data Management With Our Code-Free Amazon Vendor Central Integration
Amazon vendors can spend a lot of time and effort manually processing their data. Say goodbye to the hassle.
Openbridge automation will automatically collect, process, route, and load your Vendor Central data to a private destination.
Openbridge offers a seamless, automated solution that unifies your data into a private, trusted data warehouse or data lake like Amazon Redshift, Snowflake, Databricks, Google BigQuery, and more — all without a single line of code.
Why Choose Openbridge?
Automate with Ease: Skip the manual report downloads and enjoy automated data feeds directly into your private cloud data warehouse or data lake.
Data-Driven Insights: Leverage high-velocity data for machine learning, business intelligence, and more.
Versatile Compatibility: Works effortlessly with Google Data Studio, Tableau, Microsoft Power BI, and other tools.
Openbridge automation extends beyond inventory to a broad collection of Amazon and non-Amazon data sources;
Automate And Unify Your Vendor Central Data — Free For 30 Days
Start your journey towards data-driven growth and profit with Openbridge. Our code-free, fully automated Selling Partner API integration simplifies your Vendor Central operations.
Ready to harness the power of your Vendor Central data?
Leverage Near Real-Time Price Updates, BuyBox Insights, and Competitor Analysis to Boost Your Amazon Sales Performance
Amazon provides sellers with continuous data points that deliver valuable insights into everything from pricing changes to inventory levels. These data points enable businesses to make informed decisions quickly, whether adjusting prices, monitoring sales trends, or ensuring products are eligible for the BuyBox.
Rather than manually checking for updates, third-party tools, or waiting for reports, this data can flow directly from Amazon, delivering data in near real-time. This is first-party, authoritative data directly from Amazon systems, which includes product-level price adjustments by competitors, shifts in BuyBox eligibility, and changes in product rankings.
Has A Product Offer Changed On Amazon?
Amazon will send data whenever the top 20 offers for a product change, such as a price adjustment or a change in the BuyBox winner.
What can you do with this data?
Pricing Optimization: By constantly monitoring the landed and BuyBox prices, you can understand changes over time and optimize pricing strategies that balance sell-thru and profitability.
BuyBox Eligibility Tracking: Monitoring the BuyBox eligible offers and BuyBox prices allows you to understand when and why you lose the BuyBox. This data can help inform adjustments to your pricing, shipping, and fulfillment strategy to increase your chances of winning.
Competitor Analysis: By analyzing the lowest prices and the number of offers in various conditions, you can identify when competitors are undercutting your prices. This can trigger strategic adjustments in your offers, such as free shipping or discounts, to regain a competitive edge.
Sales Performance Monitoring: Tracking the sales rank in various product categories helps you understand how price changes affect your product’s visibility and performance. A decline in sales rank could indicate the need to lower your price or offer promotional deals.
What Triggers Cause Changed Offers Updates?
There are a few primary types of changes to offers that will trigger new data to be sent by Amazon:
External: A price change from a non-Amazon seller.
Internal: A price change on Amazon’s retail site.
Featured Offer: A change in the BuyBox winner or BuyBox price.
In addition to those changes, the item’s condition may experience a change (e.g., new, used, collectible), triggering an update from Amazon.
Now that we know what will trigger Amazon to send data, we can dig into the available data.
What types of offer data are available?
Amazon offers various products and competitive offers of data specific to the Amazon marketplace.
Number Of Offers
Condition: The condition of the item (e.g., new, used, collectible).
Fulfillment Channel: Whether the offer is fulfilled by Amazon (FBA) or the seller (MFN).
Offer Count: The total number of offers for the specified condition and fulfillment channel.
Tracking the number of offers for each condition and fulfillment channel helps monitor market competitiveness. For example, many new offers suggest increasing competition, requiring you to revisit your pricing or inventory management.
Lowest Prices
Landed Price: The price of the item plus shipping minus any Amazon Points.
Listing Price: The price of the item before shipping costs.
Shipping: The cost of shipping.
This pricing information provides a view of the cost to the customer. Comparing your landed price against the lowest offer enables you to refine pricing and offer strategies to remain competitive.
Buy Box Prices
Landed Price: The total price (item price + shipping — points) for the BuyBox-winning offer.
Listing Price: The price of the item for the BuyBox-winning offer.
Shipping: The shipping cost for the BuyBox-winning offer.
Understanding the current BuyBox price allows you to adjust your offer to increase the likelihood of winning the BuyBox. If your landed price is too high compared to the BuyBox price, consider adjusting your listing price or offering free shipping to stay competitive.
ListPrice
Amount: The suggested retail price from the manufacturer.
Comparing your price to the list price helps you gauge how aggressively you are pricing your item. Offering discounts below the list price can make your product more attractive to buyers, especially if competitors are sticking close to the MSRP.
Sales Rankings
Product Category Id: The product category (e.g., lawn_and_garden_display_on_website).
Rank: The rank of the product in that category.
Monitoring sales rank in specific categories helps track the performance of your product over time. If you notice a drop in rank, it might indicate that your product is priced too high, or that competitors are offering more attractive deals.
Number Of BuyBox Eligible Offers
Condition: The condition of the item (e.g., new, used, collectible).
Fulfillment Channel: Whether Amazon or the seller fulfills the offer.
Offer Count: The total number of BuyBox-eligible offers.
Knowing how many offers BuyBox is eligible for allows you to better understand the competition. If there are many eligible offers, BuyBox becomes more competitive, requiring more aggressive pricing or fulfillment optimizations.
Understanding Competitive Product Offers
This section provides details about the top 20 competitive offers for the product, including seller ratings, shipping times, and prices.
Seller Id: The identifier for the seller of the offer.
Sub Condition: The sub-condition of the item (e.g., new, mint, very good).
Seller Feedback Rating: Data on the seller’s feedback rating and total feedback count.
Shipping Time: The estimated minimum and maximum shipping times for the offer.
Listing Price: The price of the item.
Shipping: The shipping cost.
Is Fulfilled By Amazon: Indicates whether the offer is fulfilled by Amazon.
Is BuyBox Winner: Indicates whether this offer is currently the BuyBox winner.
Analyze competitive offers to understand how they compare to your own. Offers with better seller feedback ratings or shorter shipping times might win the BuyBox even if their prices are slightly higher. Monitoring whether an offer is fulfilled by Amazon or eligible for Prime can also guide fulfillment decisions to stay competitive.
The Power of Storing Offer Snapshot Data for Long-Term Analysis
Many of these data points, such as pricing changes, offer fluctuations, and BuyBox eligibility, are transitory, meaning they reflect the current state of the market at a particular moment. If you do not store the snapshot, it is gone forever.
Without retaining this information, you cannot look back and see how these metrics evolved over time. Storing this data in your private data warehouse or data lake allows access to the cumulative history of how your offers, prices, and inventory have changed over time. This historical perspective allows for a level of analysis and strategic planning that competitors relying solely on real-time data will not have.
Here are a few opportunities:
Historical Trend Analysis: By capturing data in real-time, you can build daily, weekly, or monthly trends for price fluctuations, inventory levels, and sales rank changes. This enables you to see how your pricing decisions impacted sales or how seasonality affects your product categories.
Performance Benchmarking: Over time, you can use this data to set benchmarks for your performance. By comparing current metrics against previous weeks, months, quarters, or years, you can assess how well your strategies are performing and make data-driven decisions to adjust course if needed.
Competitive Pricing Insights: Analyzing historical pricing data allows you to spot patterns in competitor behavior. For instance, you may notice recurring discounts from competitors at certain times of the year, allowing you to proactively adjust your pricing strategy to stay competitive.
BuyBox Eligibility Monitoring: Monitoring changes in BuyBox ownership and tracking how often you’ve won or lost the BuyBox can reveal opportunities for optimization. By understanding the factors that influenced past BuyBox wins, such as pricing or fulfillment methods, you can refine your approach for future success.
Seasonal and Market Trend Identification: Storing data over long periods allows for detailed analysis of broader market trends. Whether identifying product seasonality or spotting shifts in consumer behavior, long-term data can provide unique insights that are not available from real-time data alone.
Looking back over weeks, months, or even years can offer powerful and actionable insights, turning data into a long-term strategic asset.
Openbridge: A Code-Free, Fully Automated Solution
Teams seeking a rapid, hassle-free implementation with minimal setup time and no coding required will find Openbridge the perfect fit.
Automation Accelerates Insights: Seamlessly integrate data with tools like Tableau, Looker, Power BI, Looker Data Studio, and AWS Quicksight for forecasting, analysis, reporting, and marketing efforts.
Unify Data in Your Cloud Warehouse: Consolidate data in a trusted, private data lake or cloud warehouse such as Snowflake, Azure Data Lake, AWS Redshift, Databricks, AWS Athena, and Google BigQuery.
Openbridge provides a code-free, fully automated solution that swiftly and securely gets your offer data up and running.
Go Faster With Amazon Warehousing and Distribution
Unraveling AWD: Key Features and Benefits for Amazon Seller Central
Amazon Warehousing and Distribution (AWD) significantly advances Seller supply chain management solutions.
Launched in 2022, AWD is Amazon’s answer to the growing complexities and challenges sellers face in managing their inventory across multiple sales channels.
This service is designed to revolutionize how businesses handle their upstream inventory, offering a seamless integration with Amazon’s vast logistics network.
What is Amazon Warehousing and Distribution?
AWD is a low-cost bulk inventory storage and distribution solution engineered explicitly for long-term inventory storage and efficient distribution to Amazon fulfillment centers and other non-Amazon channels.
Its primary purpose is to address critical supply chain challenges that sellers face, particularly in areas of storage capacity, cost management, and inventory replenishment.
Key aspects of AWD’s purpose include:
Solving storage dilemmas: AWD provides a solution to the common problem of insufficient storage capacity, allowing sellers to store large quantities of inventory without the need for their own warehousing facilities.
Cost optimization: By offering competitive storage rates, AWD aims to reduce the overall operational costs associated with inventory management.
Streamlining logistics: The service simplifies moving inventory from upstream facilities to Amazon fulfillment centers, making inventory management more efficient and less time-consuming.
Enhancing inventory visibility: AWD gives sellers a centralized view of their inventory across multiple channels, improving overall supply chain transparency.
Supporting multi-channel selling: The service is designed to support sellers who operate across various sales platforms, not just on Amazon.
Part of the Supply Chain by Amazon
AWD is a crucial component of the broader “Supply Chain by Amazon” initiative. This comprehensive suite of services brings Amazon’s advanced capabilities to the entire seller supply chain, offering an end-to-end solution that gets products from manufacturers to customers worldwide.
Within the Supply Chain of the Amazon ecosystem, AWD works in conjunction with:
Amazon Global Logistics (AGL): Handles international shipping and customs clearance.
Partnered Carrier Program (PCP): Provides domestic transportation solutions.
Fulfillment by Amazon (FBA): Manages order fulfillment for Amazon store sales.
Multi-Channel Fulfillment (MCF): Handles order fulfillment for non-Amazon sales channels.
Buy with Prime: Extends Prime benefits to sellers’ own websites.
This integration allows sellers to leverage Amazon’s logistics expertise across their entire supply chain, from sourcing to last-mile delivery.
Key features and benefits
AWD offers a range of features and benefits designed to address the most pressing needs of e-commerce sellers:
Low-cost bulk storage: AWD provides cost-effective storage solutions, with rates particularly competitive during peak seasons compared to FBA storage fees.
Auto-replenishment: The service automatically replenishes FBA inventory, ensuring products remain in stock and available for fast delivery.
Multi-channel distribution: AWD supports inventory distribution not just to Amazon fulfillment centers, but also to other sales channels, including wholesalers and brick-and-mortar stores.
Improved inventory management: Sellers can view and manage their global inventory through Seller Central, providing a unified inventory management experience.
Increased sales potential: By keeping products in stock and Prime-eligible, AWD can help drive a 15% increase in unit sales on average.
Cost savings: Using AWD can lead to significant cost reductions, including savings on FBA storage fees and elimination of certain FBA-related charges like inbound placement fees.
Streamlined operations: AWD simplifies the entire inventory management process, from receipt to distribution, reducing the complexity of supply chain operations.
Enhanced visibility: The service provides real-time tracking of inventory at every milestone, improving overall supply chain transparency.
Flexibility: AWD allows sellers to store inventory for as long as needed, providing flexibility in managing seasonal fluctuations and long-tail products.
Integration with Amazon’s logistics network: By leveraging Amazon’s advanced logistics capabilities, AWD ensures faster and more reliable movement of products from manufacturers to customers.
Amazon Warehousing and Distribution represents a significant step forward in Amazon’s efforts to provide comprehensive supply chain solutions. It addresses key pain points for sellers, offers substantial cost savings, and enhances overall operational efficiency, making it a valuable tool for businesses looking to optimize their e-commerce operations.
Amazon Warehousing and Distribution Program Comparison with Traditional 3PL Solutions
Amazon Warehousing and Distribution (AWD) offers a compelling alternative to traditional third-party logistics (3PL) providers. Let’s explore how AWD compares to traditional 3PL solutions and why it might be a game-changer for many sellers.
Advantages of AWD
Transparent pricing: AWD offers a simple, volume-based pricing structure without hidden fees or long-term contracts.
Consistent rates: Unlike many 3PLs that increase during peak seasons, AWD maintains consistent pricing year-round.
Economies of scale: Leveraging Amazon’s vast network often results in lower overall costs than traditional 3PLs.
Flexible storage: AWD can easily accommodate fluctuations in inventory levels without penalties.
Global reach: Access to Amazon’s worldwide logistics network allows for easier international expansion.
Multi-channel support: AWD facilitates inventory management across various sales channels, a feature not always available with traditional 3PLs.
Advanced inventory management: AWD’s systems provide real-time visibility and predictive analytics.
Auto-replenishment: Automated inventory replenishment to FBA reduces the risk of stockouts.
Integration with seller tools: Seamless connection with Seller Central for streamlined operations.
Fast processing: Inventory typically becomes visible in AWD within 2–4 days of arrival.
Rapid distribution: Quick movement of goods to FBA centers (usually 10–14 days) ensures products are available for fast shipping.
Established network: Amazon’s extensive logistics network often outperforms traditional 3PLs in terms of speed and reliability.
One-stop solution: AWD combines storage, distribution, and fulfillment in a single service.
Reduced complexity: Sellers deal with one provider instead of multiple 3PLs for different services.
Standardized processes: Amazon’s established procedures can simplify inventory management.
Prime eligibility: AWD ensures products remain Prime-eligible, potentially boosting sales.
Consistent delivery: Amazon’s reputation for reliable shipping can improve customer satisfaction.
Multi-channel fulfillment: Ability to offer fast shipping across various sales channels.
Advanced analytics: Access to Amazon’s data analytics can provide valuable insights for inventory optimization.
Demand forecasting: Better prediction of inventory needs based on Amazon’s vast data resources.
Performance metrics: Detailed reporting on storage, distribution, and fulfillment performance.
No long-term commitments: Pay-as-you-go model allows for more flexibility compared to traditional 3PL contracts.
Easy entry and exit: Simpler process to start using the service or discontinue if needed.
Customizable services: Ability to choose which supply chain components to leverage through Amazon.
Amazon Warehousing and Distribution (AWD) Challenges and Considerations
While Amazon Warehousing and Distribution (AWD) offers numerous benefits, it’s crucial for sellers to be aware of potential challenges and carefully consider various factors before fully committing to the service.
Understanding these aspects will help sellers make informed decisions and develop strategies to maximize the benefits of AWD while mitigating risks.
A. Potential pitfalls
1. Over-reliance on Amazon’s ecosystem:
- Risk: Becoming too dependent on Amazon’s services may limit flexibility and control over your supply chain.
- Consideration: Maintain relationships with alternative logistics providers and consider a hybrid approach to preserve some independence.
2. Inventory forecasting challenges:
- Risk: Inaccurate forecasting can lead to overstocking or stockouts, especially with AWD’s auto-replenishment feature.
- Consideration: Regularly review and adjust forecasting models, considering factors like seasonality, promotions, and market trends.
3. Cost management complexities:
- Risk: While AWD can offer cost savings, mismanagement of inventory levels or frequent movements between AWD and FBA can increase costs.
- Consideration: Implement robust inventory management strategies and carefully monitor all associated costs.
4. Limited customization options:
- Risk: AWD’s standardized processes may not accommodate all unique product or business requirements.
- Consideration: Evaluate whether your products or business model require specialized handling that AWD might not provide.
5. Potential for commingled inventory:
- Risk: If opting for commingled inventory in FBA, counterfeit products can be mixed with genuine items.
- Consideration: Choose the “sticker-free, label-free” option if concerned about commingling, although this may increase costs.
6. Changes in Amazon’s policies:
- Risk: Amazon may modify AWD terms, pricing, or features, potentially impacting your business model.
- Consideration: Stay informed about Amazon’s policy updates and maintain flexibility in your logistics strategy.
7. Data privacy and competitive concerns:
- Risk: Sharing detailed inventory and sales data with Amazon could potentially be used to Amazon’s advantage.
- Consideration: Understand Amazon’s data usage policies and consider the trade-offs between data sharing and service benefits.
8. Integration challenges:
- Risk: Difficulties in integrating AWD with existing systems or other sales channels could lead to operational inefficiencies.
- Consideration: Invest in proper integration and training to ensure smooth platform operations.
9. Inventory aging and long-term storage:
- Risk: While AWD offers long-term storage, keeping slow-moving inventory can accumulate costs over time.
- Consideration: Regularly review inventory performance and implement strategies to manage slow-moving stock.
10. Geographical limitations:
- Risk: AWD’s effectiveness might vary depending on your target markets and product types.
- Consideration: Evaluate AWD’s network coverage in relation to your key markets and consider supplementary solutions if needed.
B. Balancing inventory across channels
1. Multi-channel inventory allocation:
- Challenge: Determining optimal inventory levels for each sales channel while using a centralized AWD inventory pool.
- Strategy: Implement advanced inventory management software that can dynamically allocate stock based on real-time demand across channels.
2. Maintaining consistent stock levels:
- Challenge: Ensuring adequate stock levels across all channels without overstocking.
- Strategy: Utilize AWD’s auto-replenishment feature in combination with channel-specific reorder points to maintain optimal inventory levels.
3. Handling channel-specific promotions:
- Challenge: Managing inventory for promotions on specific channels without disrupting stock levels for other channels.
- Strategy: Create separate inventory allocations for promotional events and adjust AWD replenishment thresholds accordingly.
4. Seasonal demand variations:
- Challenge: Adapting to different seasonal patterns across various sales channels.
- Strategy: Develop channel-specific forecasting models and use AWD’s flexible storage to manage seasonal inventory efficiently.
5. Product lifecycle management:
- Challenge: Managing inventory for products at different stages of their lifecycle across multiple channels.
- Strategy: Implement a product lifecycle management system integrated with AWD to optimize inventory levels based on each product’s performance across channels.
6. Returns and refurbishment:
- Challenge: Handling returns from multiple channels and reintegrating refurbished items into inventory.
- Strategy: Establish a centralized returns process through AWD and develop clear protocols for restocking refurbished items across channels.
7. Cross-channel fulfillment:
- Challenge: Deciding when to fulfill orders for one channel using inventory allocated for another.
- Strategy: Set up rules in your inventory management system for cross-channel fulfillment, considering factors like shipping speeds and costs.
8. Inventory visibility:
- Challenge: Maintaining real-time visibility of inventory across all channels and AWD.
- Strategy: Invest in an integrated inventory management system that provides a unified view of stock levels across AWD, FBA, and other sales channels.
9. Buffer stock management:
- Challenge: Determining appropriate safety stock levels for each channel while minimizing overall inventory costs.
- Strategy: Use AWD’s storage capacity to maintain centralized buffer stock, adjusting levels based on aggregated demand across all channels.
10. New product introductions:
- Challenge: Allocating inventory for new product launches across multiple channels.
- Strategy: Utilize AWD for initial stock holding and implement a phased rollout strategy across channels based on performance data.
While AWD offers powerful tools for inventory management and distribution, sellers must approach it with a clear understanding of potential challenges. By carefully considering these pitfalls and implementing strategies to balance inventory across channels, sellers can leverage AWD to its full potential.
The key lies in maintaining flexibility, continuously monitoring performance, and being prepared to adjust strategies as needed. With the right approach, AWD can be valuable in creating a robust, multi-channel e-commerce operation.
Amazon Warehousing and Distribution Fees, Costs and Pricing Structure
Amazon Warehousing and Distribution (AWD) offers a transparent and competitive pricing structure to provide cost-effective solutions for sellers’ storage and distribution needs. Understanding this pricing structure is crucial for sellers to maximize their cost savings and optimize inventory management strategies.
AWD storage costs are based on the physical volume of inventory and are calculated per cubic foot per month. The pricing is divided into two main periods:
1. Non-holiday period (January through September):
- Base rate: $0.48 per cubic foot per month
- Integrated rate (using AGL or PCP): $0.36 per cubic foot per month (25% discount)
2. Holiday period (October through December):
- Base rate: $0.48 per cubic foot per month (remains the same as non-holiday)
- Integrated rate (using AGL or PCP): $0.36 per cubic foot per month (25% discount)
Key points about AWD storage costs:
- Consistent pricing throughout the year, including during peak holiday seasons
- Significant savings compared to FBA storage, especially during Q4
- No long-term contracts or complex pricing schemes
- Pay-as-you-go model for flexibility
B. Processing fees
AWD processing fees cover the costs associated with receiving, handling, and preparing inventory for storage or distribution. The fee structure is as follows:
- Base rate: $2.50 per box
- Integrated rate (using AGL or PCP): $2.13 per box (15% discount)
These fees are charged when:
- Inventory is initially received at AWD facilities
- Inventory is prepared for shipment to FBA or other channels
C. Transportation fees
AWD charges transportation fees for moving inventory from AWD facilities to other destinations. The fee structure is:
1. Transportation to FBA:
- Base rate: $1.00 per cubic foot
- Integrated rate (using AGL or PCP): $0.85 per cubic foot (15% discount)
2. Transportation to other distribution channels:
- Flat rate: $1.65 per cubic foot (no discount for integrated services)
These fees cover the costs of:
- Preparing inventory for shipment
- Transportation to the destination
- Any necessary documentation and tracking
D. Comparison with FBA storage costs
AWD offers significant cost savings compared to FBA storage, especially during peak seasons:
1. Non-holiday period (January through September):
- AWD: $0.48 per cubic foot per month
- FBA (standard-size): $0.78 per cubic foot per month (effective April 1, 2024)
- Savings with AWD: 38%
2. Holiday period (October through December):
- AWD: $0.48 per cubic foot per month
- FBA (standard-size): $2.40 per cubic foot per month
- Savings with AWD: 80%
Additional cost benefits of AWD:
- No FBA inbound placement service fees
- Waiver of FBA storage-utilization surcharges when using AWD auto-replenishment
- Waiver of low-inventory-level costs and storage-overage costs with AWD auto-replenishment
E. Integrated rates with AGL or PCP
Amazon offers significant discounts for sellers who use Amazon Global Logistics (AGL) or the Partnered Carrier Program (PCP) in conjunction with AWD:
1. Storage costs: 25% discount
- Standard rate: $0.48 per cubic foot per month
- Integrated rate: $0.36 per cubic foot per month
2. Processing fees: 15% discount
- Standard rate: $2.50 per box
- Integrated rate: $2.13 per box
3. Transportation to FBA: 15% discount
- Standard rate: $1.00 per cubic foot
- Integrated rate: $0.85 per cubic foot
Key considerations for AWD pricing:
1. Volume-based savings: The more you store and ship through AWD, the more you can save.
2. Seasonal strategy: AWD’s consistent pricing allows for more predictable costs during peak seasons.
3. Integration benefits: Using AGL or PCP can lead to substantial savings across storage, processing, and transportation.
4. Long-term storage efficiency: AWD is particularly cost-effective for items that require longer storage periods.
5. Multi-channel optimization: The pricing structure supports efficient inventory management across multiple sales channels.
AWD’s pricing structure offers a transparent, flexible, and cost-effective inventory storage and distribution solution. By leveraging the integrated rates with AGL or PCP, sellers can achieve significant cost savings while streamlining their entire supply chain process.
The substantial savings compared to FBA storage, especially during peak seasons, make AWD an attractive option for sellers looking to optimize their inventory management and reduce operational costs.