Data-driven customer engagement and sales growth with Vendor Central Traffic analysis
Traffic reports for Amazon Vendor Central contain valuable information for understanding customer interest and demand for various products.
Here is how Amazon describes the Vendor Central Traffic Report;
Quickly identify changes in relevant traffic-related metrics
That description does not do the report justice! Let’s dig in and help Amazon out. 😊
What Is The Vendor Central Traffic Report?
The Traffic Report analyses the views your ASINs get on Amazon. The key metric in the report is “Glance Views,” which are the number of views the product detail page receives from our customers on the Amazon website.
The report allows vendors to analyze trends, which allows you to identify high and low-traffic products. You can then optimize activities such as running Amazon Ads, supporting marketing activities like targeted emails to increase traffic, or setting up promotions to convert high views to more sales.
Vendor Central Real-Time Traffic Data? Yes!
Unlike traditional Traffic Reports, Amazon released Rapid Retail Analytics, an hourly stream of real-time traffic, sales, and inventory data. The real-time data offers unparalleled access to ASIN-level to generate insights into customer activity on Amazon.
Amazon Rapid Retail Analytics: New API for Real-time Metrics
What are the benefits of the Amazon Vendor Central Traffic Reports?
The data is focused on providing insights into customer traffic (measured through glance views) for a specific set of products under the brand in the specific Amazon marketplaces. The data can be used for product visibility analysis, customer interest, and potential areas for marketing and sales strategy optimization.
Since the Traffic Report focuses on trends at an ASIN level, it allows vendors to assess traffic levels, seasonal variations, and brand/product performance. Vendors can link the Traffic Report data to other ASIN-specific data sets like Vendor Sales, Inventory, or Amazon Advertising reports like the Sponsored Products Advertised product report or Sponsored Brands Attributed Purchases report.
The following are typical analytics use cases:
- Traffic Measurement: These reports track customer traffic to product pages (glance views or GVs).
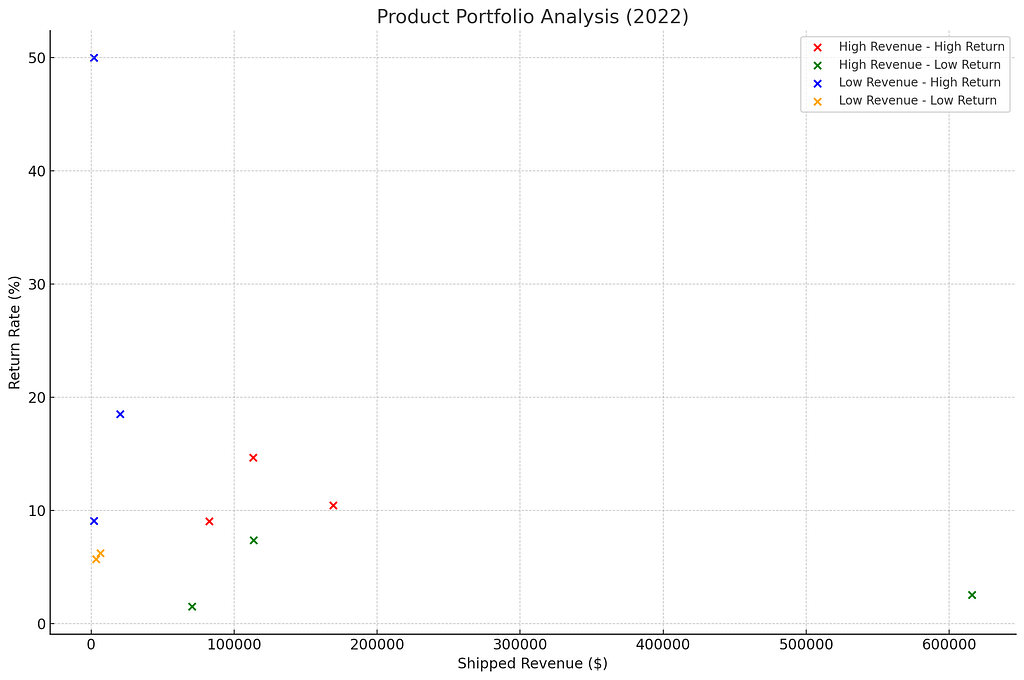
- Performance Analysis: They help in understanding how different factors contribute to traffic and, subsequently, to sales performance.
- Identifying Opportunities: By analyzing traffic data, vendors can identify trends, opportunities for improvement, and strategies that are working.
- Strategic Insights: Vendors can refine their marketing and sales strategies by analyzing traffic data.
- Operational Adjustments: The insights can lead to adjustments in inventory, pricing, and promotions.
- Benchmarking and Trend Analysis: Vendors can benchmark their performance against past data or industry standards and spot trends.
What Data Is Included In The Vendor Central Forecasting Report?
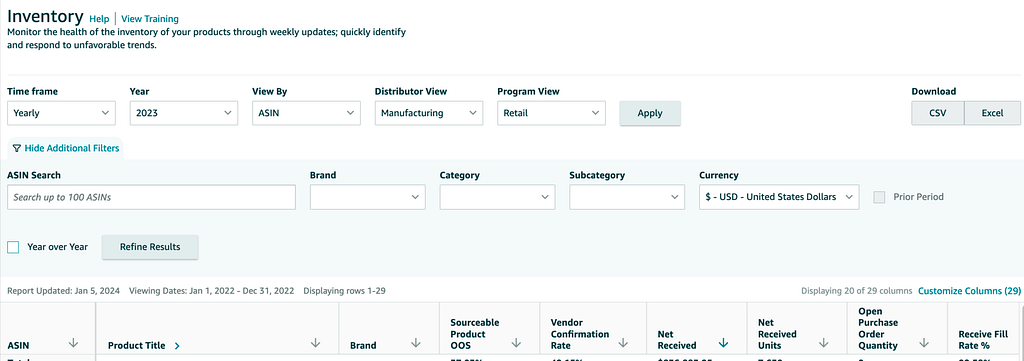
The Traffic Report you’ve provided contains the following columns, based on the first few rows:
- Distributor View: This column lists the ASIN (Amazon Standard Identification Number), which uniquely identifies each product listed on Amazon.
- View By [ASIN]: This column provides the product title, clearly identifying each product associated with the ASIN.
- Countries: This indicates the country for which the traffic data is applicable.
- Businesses: This column represents the business unit or the specific brand under which the products are listed.
- Locale: Account locale.
- Glance Views: This is a crucial metric, showing the number of views each product detail page received. It’s vital for analyzing customer interest and traffic.
Using Traffic Reports With Amazon Advertising Reports
As a stand-alone data set, Traffic reports offer vital insights to vendors. However, pairing Traffic reports with other ASIN-level data sets starts to expand insights opportunities.
For example, you can join your Traffic Report with the Amazon Ads Sponsored Products Advertised product report. You can use the ‘Advertised ASIN’ from the Advertising Report and the ‘ASIN’ from the Traffic Report as the keys to join.
You can enhance your visibility in performance drivers with these two data sets. Here are a few examples;
- Effectiveness of Advertising Campaigns: Assess how advertising impacts glance views and sales.
- Conversion Analysis: Compare impressions and clicks from the Advertising Report with glance views and sales data to calculate and understand conversion rates.
- Cost-Benefit Analysis: Analyze the ACOS and ROAS about traffic and sales to understand the financial efficiency of advertising campaigns.
- Product-Level Insights: Determine which products perform well in organic and paid channels.
- Temporal Trends: Evaluate how advertising campaigns affect traffic and sales over specific periods.:
- Correlation Analysis: Examine the relationship between advertising metrics (like clicks and impressions) and traffic/sales metrics.
- ROI Analysis: Compare advertising spending against the increase in sales or glance views.
- Segmentation and Pattern Recognition: Identify which types of products, campaigns, channels, or periods are most effective.
While our example focused on traffic reports + sponsored products and advertised product reports, you can extend this further to include other ad reports for sponsored display, sponsored brand, or sponsored product reports. Why stop there? Extend the analysis further with off-Amazon data sets like ASIN-level promotional emails, social media posts, or third-party ad platforms like Google Ads or Facebook.
For a deep dive into more examples, see our post about how to harness the power of your Amazon data:
Unleashing Business Insights With Amazon Rapid Retail Analytics
How To Access Vendor Central Traffic Reports?
Vendors have two primary paths to access reports: manual downloads or API automation.
Manual downloading occurs in your Vendor Central account interface. Automation taps into the Amazon Selling Partner API (Amazon SP-API) to automate report processing and storage in a cloud warehouse or data lake (see the Amazon docs here).
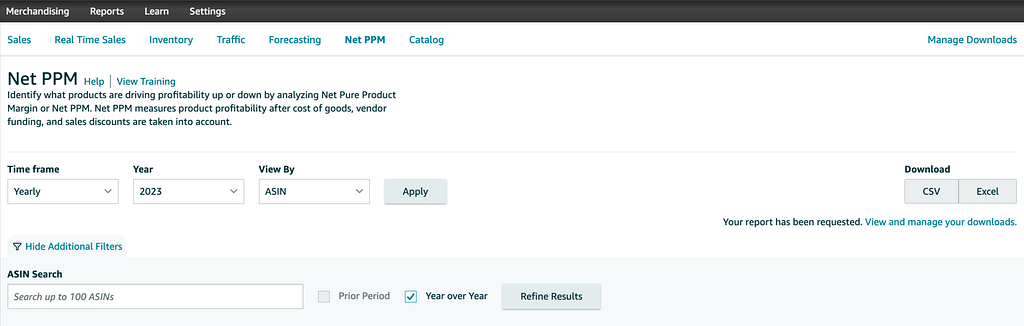
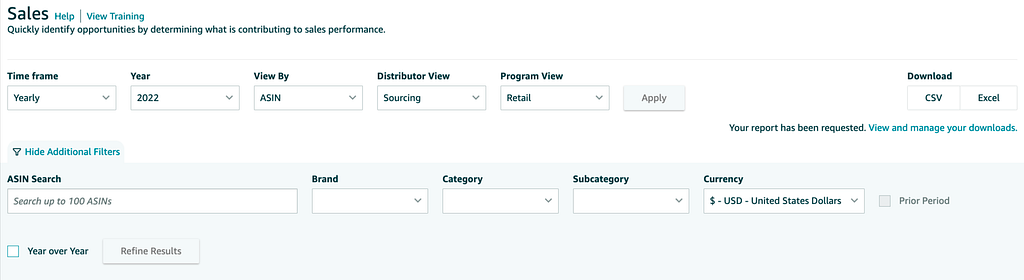
Manual Access via Vendor Central:
- Login: First, sellers must log into their Amazon Vendor Central account.
- Navigate to Reports: Usually found in the main navigation bar, this section contains various sales, inventory, and performance reports.
- Locate the ‘Traffic’ Within the Reports section.
- Select Date Range: Amazon allows sellers to pull reports based on specific dates. Choose the desired range.
- Download: Once the report has been generated, there will typically be an option to download it. The report is often available in different formats .csv or .xls.
Note: Manual downloads are more time-consuming and may not be ideal for frequent and up-to-date data analytics.
Automating Vendor Central Data:
The Amazon Selling Partner API (SP-API) allows for direct, automated access to Amazon forecasting data, making it easier for businesses to integrate it into their systems. Openbridge allows Amazon Vendors to save time manually downloading reports, increasing data velocity and reducing errors in messy merging and tracking downloaded reports.
Unlock Effortless Traffic Insights With Our Code-Free Amazon Integration
Are you struggling with complex, messy traffic report data management for Vendor Central? Say goodbye to the hassle. Openbridge offers a seamless, automated solution that unifies your data into a private, trusted data warehouse or data lake like Amazon Redshift, Databricks, Google BigQuery, and more — all without a single line of code.
Openbridge automation extends beyond inventory to a broad collection of Amazon and non-Amazon data sources;
- Brand Analytics
- Retail Analytics
- Retail Procurement
- Direct Fulfillment
- Real-time Traffic, Sales, and Inventory
- Amazon Advertising
Automate And Unify Your Vendor Central Data — Free For 30 Days
Start your journey towards data-driven growth and profit with Openbridge. Our code-free, fully automated Selling Partner API integration simplifies your Amazon Vendor Central operations.
Ready to harness the power of your Amazon traffic data?
→ Sign Up Now for Your Free 30-day Trial For Vendor Central Traffic Report Automation.
Amazon Vendor Central Traffic Report Insights was originally published in Openbridge on Medium, where people are continuing the conversation by highlighting and responding to this story.
from Openbridge - Medium https://ift.tt/KG0CLSF
via IFTTT