
How to use your Net PPM calculations to optimize your Amazon Advertising efforts
We previously discussed Net Pure Product Margin (Automating Amazon Vendor Central Net PPM Reporting) reports for Amazon Vendor Central, detailing how they are essential to vendors' analytical efforts.
As a recap, here is how Amazon describes the report;
Identify what products are driving profitability up or down by analyzing Net Pure Product Margin or Net PPM. The metric measures product profitability after cost of goods, vendor funding, and sales discounts are taken into account.
In this post, we will dive deeper into the report's contents and provide an example of how you can use tailored Amazon Net PPM Calculations to impact your Amazon Advertising efforts.
How Can Net PPM Calculations Be Used To Drive Growth?
First, the data can be used in several data analysis efforts. Below is just a small sample of the value of this report and the calculated metrics that reside in it for assessing performance:
- Profitability Analysis: These reports are designed to analyze the profitability of products after accounting for various costs and deductions. It’s a more refined measure than gross profit since it includes specific cost factors relevant to Amazon’s platform.
- Decision-Making Tool: These reports aid in making informed decisions about product strategy, pricing, promotions, and inventory management.
- Competitive Edge: Understanding profitability at a granular level can provide a competitive advantage in the marketplace.
- Performance Tracking: Vendors can track how individual products or product lines contribute to profitability.
- Cost Management: Understanding the components of the report helps manage costs more effectively, especially those specific to Amazon’s ecosystem, like vendor funding and sales discounts.
As a next step, we will explore how to use Net PPM Calculations to identify target ASINs that should warrant more advertising investments.
Amazon Net PPM Calculation And Analysis For Amazon Advertising
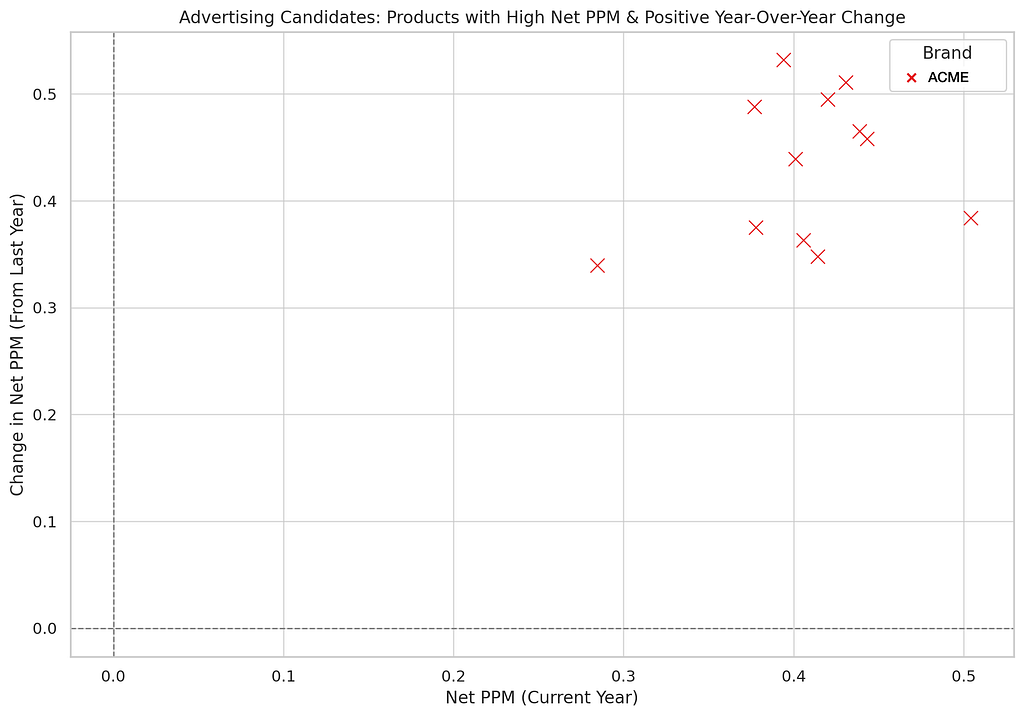
The scatter plot visualizes potential candidates for advertising investment based on the data. This analysis is aimed at helping you decide which products might benefit most from additional media dollars for advertising.
Here are some of the details of this example analysis;
Plot Overview
- X-Axis (Current Year): This represents the calculation of each product for the current year.
- Y-Axis (Change from Last Year): Shows the change compared to the previous year.
- Data Points: Each point symbolizes a product, colored by its brand.
- Reference Lines: The grey dashed lines represent zero Net PPM and zero change in Net PPM.
Insights for Advertising Decisions
- Products in the Upper Right Quadrant: These are ideal candidates for advertising. They not only have a high Net PPM, indicating current profitability but also show a positive trend compared to the previous year, suggesting growing or sustained success.
- Strength of Performance: The further right and higher the point, the stronger the product’s profitability and positive trend. These are prime candidates for advertising to capitalize on their momentum.
Strategy for Investment
- Focus on Growth and Profitability: Prioritize advertising dollars on products that are both profitable and showing a positive trend. This dual focus helps maximize the return on advertising investment.
- Brand Considerations: The spread of brands among these products can also guide brand-level marketing strategies.
By targeting products with these characteristics, you can leverage advertising to enhance further the success of already profitable and improving products, potentially boosting sales and overall revenue.
Other Examples of Net PMM Data Analysis
With access to the report data, you can undertake a broad range of data analysis. Below are just a few examples;
- Top and Bottom Performing Products: Identifying which products have the highest and lowest.
- Year-over-Year Changes: Understanding how product profitability has changed compared to the previous year.
- Brand Performance: Analyzing if specific brands are consistently performing better or worse.
- General Trends and Insights: Any notable patterns or trends in the data that could inform business decisions.
What Data Is Included In Net PPM Reports?
The report structures and organizes the data to capture the essential elements needed for analysis. Below is a reference schema for the report:
ASIN (String)
- Description: Amazon Standard Identification Number is a unique code for identifying products on Amazon.
- Example: B079YLPGSC
Product Title (String)
- Description: The name or title of the product.
- Example: Chevy Silverado 12-Volt Battery Ride-On Vehicle
Brand (String)
- Description: The brand associated with the product.
- Example: Rollplay
Net PPM (Float)
- Description: Net Pure Product Margin, calculated as a percentage. It measures product profitability after accounting for the cost of goods, vendor funding, and sales discounts.
- Example: 0.5043 (50.43%)
Net PPM Last Year (Float)
- Description: The same period in the previous year for year-over-year comparison.
- Example: 0.1206 (12.06%)
Net PPM Change (Float) [Calculated]
- Description: The change from the previous year. This derived field is calculated as Last Year.
- Example: 0.3837 (38.37%)
Categories (String/Array) [Optional]
- Description: Product categories or subcategories, if relevant for analysis.
- Examples: “Toys & Games,” “Electronic Toys”
Price (Float) [Optional]
- Description: Current price of the product.
- Example: 199.99
Cost of Goods Sold (COGS) (Float) [Optional]
- Description: The direct costs attributable to the production of the products sold.
- Example: 120.00
Sales Discounts (Float) [Optional]
- Description: Any discounts provided on the product during the reporting period.
- Example: 10.00
Shipped Revenue (Float) [Optional]
- Description: Total revenue from the product shipped during the reporting period.
- Example: 300000.00
Units Sold (Integer) [Optional]
- Description: The total number of units sold during the reporting period.
- Example: 1500
Reporting Range (Date Range)
- Description: The time period for which the report is generated.
- Example: 1/1/2022–12/31/2022
Report Updated (Date)
- Description: The date when the report was last updated or generated.
- Example: 1/7/2024
How do you access Vendor Central Net PPM Reports?
Vendors have two primary paths to access reports: manual downloads or API automation.
Manual downloading occurs in your Vendor Central account interface. Automation taps into the Amazon Selling Partner API (Amazon SP-API) to automate report processing and store the info in a cloud warehouse or data lake (see the Amazon docs here).
Manual Access via Vendor Central
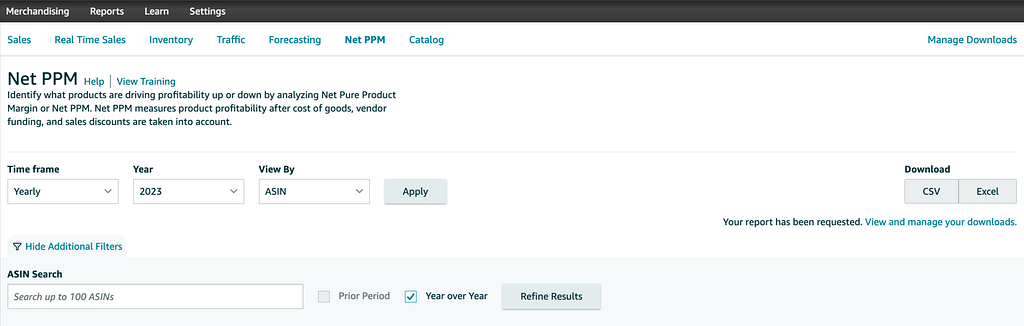
- Login: First, sellers must log into their Amazon Vendor Central account.
- Navigate to Reports: Usually found in the main navigation bar, this section contains various sales, inventory, and performance reports.
- Locate the ‘Net PPM’ Within the Reports section
- Select Date Range: Amazon allows sellers to pull reports based on specific dates. Choose the desired range.
- Download: Once the report has been generated, there will typically be an option to download it. The report is often available in different formats .csv or .xls.
Note: Manual downloads are more time-consuming and may not be ideal for frequent and up-to-date data analytics.
Automating Vendor Central Data
The Amazon Selling Partner API (SP-API) allows for direct, automated access to Amazon Net PPM data, making it easier for businesses to integrate it into their systems. Openbridge allows Amazon Vendors to save time manually downloading reports, increasing data velocity and reducing errors in messy merging and tracking downloaded reports.
Unlock Effortless Inventory Management With Our Code-Free Amazon Integration
Are you struggling with complex, messy Net PPM data management for Vendor Central? Say goodbye to the hassle. Openbridge offers a seamless, automated solution that unifies your data into a private, trusted data warehouse or data lake like Amazon Redshift, Databricks, Google BigQuery, and more — all without a single line of code.
With data organized and automated, this “analytics-ready” data supercharges tools like Google Data Studio, Tableau, and Microsoft Power BI.
Automate And Unify Your Vendor Central Data — Free For 30 Days
Start your journey towards data-driven growth and profit with Openbridge. Our code-free, fully automated Selling Partner API integration simplifies your Amazon Vendor Central operations.
Ready to harness the power of your Amazon data?
→ Sign up for a 30-day free trial of our fully-automated Net PPM data feed!
The Missing Amazon Net PPM Calculation was originally published in Openbridge on Medium, where people are continuing the conversation by highlighting and responding to this story.
from Openbridge - Medium https://ift.tt/y70FiWo
via Openbridge