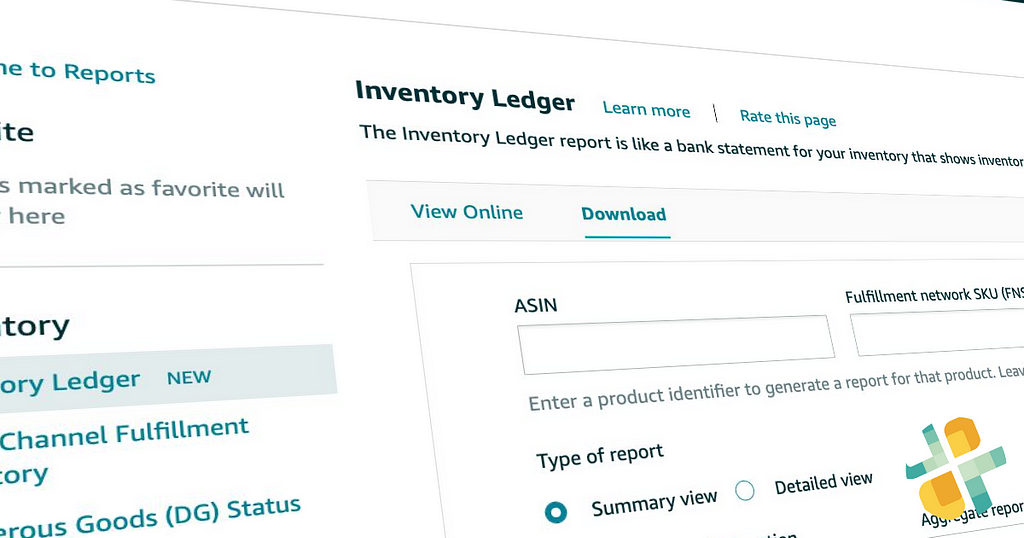
The Inventory Ledger report provides an Amazon FBA Seller with a consolidated view of an Amazon Seller inventory.
The Inventory Ledger report is like a bank statement for an Amazon Seller inventory. It provides end-to-end inventory reconciliation capability by showing your starting inventory balance, received Inventory, customer orders, customer returns, adjustments, removals, and ending balance for an Amazon account.
The Inventory Ledger report supports inventory management and accounting analysis. Also, since it includes Inventory received in the fulfillment center, adjustments, and reconciliation events, you can see inventory movement within Amazon fulfillment centers.
Amazon Sellers should use this report to analyze inventory movements to and from fulfillment centers, including sold, returned, removed, disposed of, damaged, lost, and found products. As a result, it is common for an Amazon Seller to use this data in their accounting software.
Amazon delivers this report’s historical movement data of Seller inventory for 18 months.
Per Amazon, the Inventory Ledger report replaces six reports:
Daily Inventory History
Monthly Inventory History
Inventory Event Detail
Inventory Adjustments
Inventory Reconciliation
Received Inventory
As of January 31, 2023, these six reports are no longer available.
What Is Included In The Amazon Inventory Ledger Report?
You can view inventory events in the Inventory Ledger report using the Summary and Detailed views.
Ledger Report: Summary View
The summary view of the Inventory Ledger report shows a history of inventory events (such as receipts, shipments, and adjustments) by SKU and disposition (such as sellable, customer damaged, carrier damaged, fulfillment center damaged, expired, distributor damaged, and defective).
The freshness of the data depends on the period by which the report is aggregated. For daily aggregation, the data is refreshed each day. For weekly, the data is refreshed every Monday. The data is refreshed monthly on the second day of the month.
Ledger Report: Detailed View
The detailed View of the Inventory Ledger report details all inventory events in fulfillment centers, including event type, quantity, location, country, and disposition. Data in the detailed View is updated in near real-time.
If you notice any discrepancies, try expanding the dates of your report. An inventory event could have occurred in the previous month, which would affect your data in the report window. Extending the dates of your report can give you a better understanding of your inventory movements. The best way to reconcile Inventory is to use the FNSKU field to specify the product in each report.
You can also view your reimbursements in the online report by clicking See reimbursements for the reported dates. Reimbursements for lost or damaged units may take up to 45 days to post to your account. To learn more about reimbursements, go to the FBA inventory reimbursement policy.
Understanding Ledger Report Adjustment Types And Reason Codes
Adjustment-type rows in the Inventory Ledger report’s detailed View show the history of adjustments to your Inventory in response to issues such as disposition changes, misplaced Inventory, found Inventory, and ownership corrections. Inventory adjustments are categorized by type and reason code.
The type shows whether an adjustment increases or decreases your inventory level.
The reason code describes the adjustment that was made.
Inventory adjustments often occur in pairs. For example, suppose your Inventory changes disposition from sellable to expired. In that case, there will be two adjustments to your Inventory: a decrease in your sellable Inventory and an increase in your expired Inventory.
The following table lists all inventory adjustment reason codes and their type.
Inventory dispositions
Inventory disposition represents the physical state of a unit or units for an Amazon Seller account.
Reconciliation events
Inventory adjustments for misplaced Inventory found and Damaged at the Amazon fulfillment center will have corresponding reconciliations. You can view these reconciliations in both online and downloadable views.
The following table lists all possible original event and reconciliation event combinations.
Inventory adjustments other than Inventory misplaced, Inventory found, and Damaged at the Amazon fulfillment center will not show a reconciliation reason in the online or downloadable View.
Why are my items being researched?
You will notice a new inventory classification on the Manage FBA inventory page and report called Researching. This represents the misplaced or fulfillment-center-damaged Inventory that is actively being confirmed at our fulfillment centers.
A timeline shows the duration of the research, which will always be at most 30 days. Once the Inventory being researched has been reimbursed or exceeded the 30-day period, an Amazon Seller will see the corresponding adjustment to the Inventory Ledger report’s detailed View. For inventory adjustments after March 19, 2021, an Amazon FBA Seller does not have to wait 30 days to file a claim because Amazon will handle the 30-day research duration for them.
How Access Your Ledger Reports: Manual Wrangling or Full Automation?
Amazon offers the Selling Partner API to Vendors and Sellers for direct, official access to reports. Amazon also allows online viewing and manual downloads by logging into your Seller Central account.
Amazon Automation: Ledger Summary and Detail Reports
Automation ensures your team can skip the manual data wrangling and take control of your Inventory Ledger data.
Manual Reporting: Online Or Request Report For Download
You can view adjustments to your Inventory online in Seller Central or by downloading the Inventory Ledger report’s detailed View.
The View online method is recommended for quickly viewing inventory adjustments and reconciliations. When there is a reconciliation for an inventory adjustment, a link will connect you to either the reconciliation adjustment in the Inventory Ledger report’s detailed View or the reimbursement transaction in the Reimbursement report.
The Download method is recommended for understanding the reconciliation status of inventory adjustments at scale.
To manually view your inventory or download adjustments online, follow these steps:
In the Inventory Ledger report, click View online.
Select Summary or Detailed View, and select the desired date range in the Date Range drop-down menu.
If you want to filter the results further, add the Merchant SKU, Fulfillment Network SKU, ASIN, or any combination of those identifiers.
Click Generate report.
The report will generate multiple pages if there are more than 50 inventory adjustments.
You can get more information in the online View about the reconciled quantities with reason codes for Damaged at the Amazon fulfillment center, Inventory misplaced, or Inventory found. For unreconciled quantities with reason codes for Damaged at the Amazon fulfillment center and Inventory misplaced, you may be eligible for reimbursement under the FBA inventory reimbursement policy.
Get Started Automating Inventory Ledger Reports — For Free
Ditch the legacy manual report downloads for code-free Amazon SP-API automation. Openbridge offers official SP-API data automation, one of the most powerful tools Amazon Sellers can tap into. Accelerate the speed at which your team can gain valuable insights to deliver data-driven growth and profit.
Amazon Inventory Ledger Report was originally published in Openbridge on Medium, where people are continuing the conversation by highlighting and responding to this story.
from Openbridge - Medium https://ift.tt/2EZlvLb
via IFTTT
Harness the power of automated Amazon FBA Reserved Inventory performance insights reporting
Per Amazon, inventory in the reserved status will be tied to a customer order shipped between fulfillment centers or set aside at a fulfillment center for additional processing. While inventory is being sent to another fulfillment center, it is still available for purchase.
Why is my Amazon Inventory Reserved?
Units can be reserved for the following reasons:
Customer order: These units are used to fulfill customer orders.
Fulfillment center transfer: These units are being transferred from one fulfillment center to another to help place the inventory closer to customers. Units in the FC transfer status are available for customers to buy. However, customers might be shown a future ship date if no other units are available in the fulfillment centers for immediate fulfillment. Transfers may take up to 22 to 25 days to complete. In some cases, transfers may take longer, and investigation may be required (for example, delays due to COVID-19 or weather restrictions).
Fulfillment center processing: These units have been sidelined at the fulfillment center for additional processing, such as verification of item dimensions and weight, pending investigations, or pending removal orders.
What does Amazon “FC” mean?
The acronym Fulfillment Center (FC) is employed to signify a specific condition of your existing inventory or those items located in the “processing” status at an Amazon warehouse. This depicts the elements housed in one of Amazon’s distribution hubs globally. Once your FBA supply reaches the FC processing stage at an Amazon center, it is categorized and shipped to other warehouses so that Amazon can dispatch orders quickly and proficiently while lessening costs.
When inventory is being processed for transfer to another Amazon fulfillment center, those units might show up under FC transfer and FC processing for a short time. Units in FC transfer are available for sale but can only be eligible for Prime delivery once they are transferred to destination fulfillment centers.
What is Amazon Inventory Reserved in relation to overall inventory levels?
The total number of units you have for an SKU in a shipment sent to a fulfillment center equals:
*Reserved quantity is not included in Available or Unsellable quantities.
Is there an Amazon Reserved Inventory Report for an FBA seller to review?
The reserved inventory report is part of a broader inventory performance and management datasets collection. Specifically, the Amazon Reserved Inventory report shows a breakdown of reserved units in your inventory. Here is a snapshot of the data you can get in an Amazon Reserved Inventory Report;
sku: SKUs are unique blocks of letters or numbers that identify your products. SKUs are assigned by you as the seller.
fnsku: A unique identifier assigned by Amazon to items stored in and fulfilled from a fulfillment center.
asin: ASINs are unique blocks of 10 letters or numbers that identify items. Amazon assigns ASINs. You can find the ASIN on the product detail page.
product-name: The title of your product.
reserved_qty: The total number of units in the reserved status.
reserved_customerorders: The number of units reserved for customer orders.
reserved_fc-transfers: The number of units transferred from one fulfillment center to another.
reserved_fc-processing: The number of units that have been sidelined at the fulfillment center for additional processing, which includes units tied to a removal order.
The report can also help you find more information about the reserved units. Amazon reserved inventory levels are available for sellers globally.
Is the Amazon Seller Central Reserved Inventory data available for export?
The Amazon FBA reserved inventory report can be downloaded manually as a CSV report. However, rather than messy and time-consuming manual data wrangling, you can automate the flow of reserved amazon inventory information to a leading data lake or cloud warehouses like Databricks, Redshift, Google BigQuery, Snowflake, Azure Data Lake, Ahana, and Amazon Athena.
Automation provides a unified, analytics-ready single source of truth for BI tools. For example, you can use your tools for e-commerce insights like business intelligence, data visualization, SQL, or data science tools. Examples are Google Data Studio, Tableau, Microsoft Power BI, Looker, and Amazon Quicksight.
What type of data is available to help with Amazon inventory management?
Amazon FBA inventory reports cover a broad cross-section of data points. There are reports for Amazon fulfilled, stranded inventory, active listing, all listings, and many others. For example, here are a collection of FBA-specific reports;
Inventory Ledger NEW
Multi-Channel Fulfillment Inventory
Dangerous Goods (DG) Status
Restock Inventory
Stranded Inventory
Reserved Inventory
Subscribe & Save Forecasting
Inventory Reconciliation
Small and Light Inventory
Amazon Fulfilled Inventory
Multi-Country Inventory
Daily Inventory History
Monthly Inventory History
Received Inventory
Inventory Event Detail
Inventory Adjustments
Manage FBA Inventory
Manage FBA Inventory Report — Archived
Inbound Performance
Exportable Inventory (US)
Bulk Fix Stranded Inventory
FBA Inventory
These Seller reports will contain data about Amazon sales, stock level, restock limits, storage fees, storage type, storage limits, and many others for inventory planning or analysis.
Get Started Automating Amazon Seller Central Reserved Inventory Reports — For Free.
Ditch the manual AmazonReserved Inventory report downloads. Openbridge is a verified partner Amazon Selling Partner API developer and offers code-free data automation, one of the most potent tools FBA sellers can tap. Automation accelerates performance and the speed at which your team can gain valuable insights to deliver data-driven growth and profit.
How to use Amazon Vendor Central, optimize sales performance, and become a data-driven retailer.
Optimizing your e-commerce sales can be challenging for a brand or business owner. From establishing an Amazon store to leveraging Amazon Advertising products like Sponsored products or Sponsored brands, reaching Amazon customers is critical to success.
This Amazon Vendor Central FAQ covers various performance reports in your Vendor Central account, business metrics, definitions, and areas of opportunity as you optimize sales and operational performance.
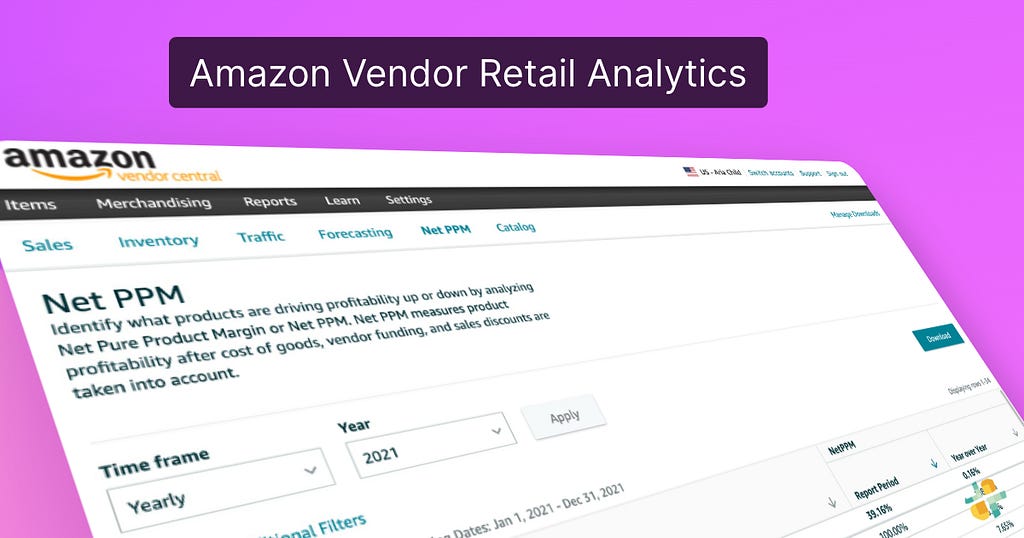
What is Amazon Retail Analytics?
Amazon Retail Analytics (ARA) provides reports that let an Amazon Vendor analyze sales and operational data, such as revenue and inventory levels.
All vendors have access to ARA, including manufacturers and authorized resellers.
Amazon Brand Analytics (ABA) is a set of reports that lets you analyze your customers’ buying and search behavior. To access ABA, you must be enrolled in Brand Registry and be responsible for selling the brand in the Amazon store. Brand Registry enrollment is not required for ARA.
Vendors have access to performance data they need to manage and grow their business with Amazon Retail. Through vendor-specific dashboards, reports, or API, you can monitor your retail KPIs, evaluate your performance, identify operational improvement opportunities, and glean valuable insights to shape your business strategy.
What types of ARA Reports are available?
A collection of specific report types available; Sales, Traffic, Net Pure Product Margin (PPM), Inventory, Catalog, and Forecasting. The Traffic, Net Pure Product Margin (PPM), and Forecasting dashboards are only displayed to manufacturers.
Do I have to download Reports manually? Is Vendor Reporting Automation supported?
Automation will automatically generate reports, process, route, and load to your private data destination so you can manage and optimize your sales and inventory. This is accomplished via the Selling Partner API for Vendors.
What are the benefits of Vendor Report Automation?
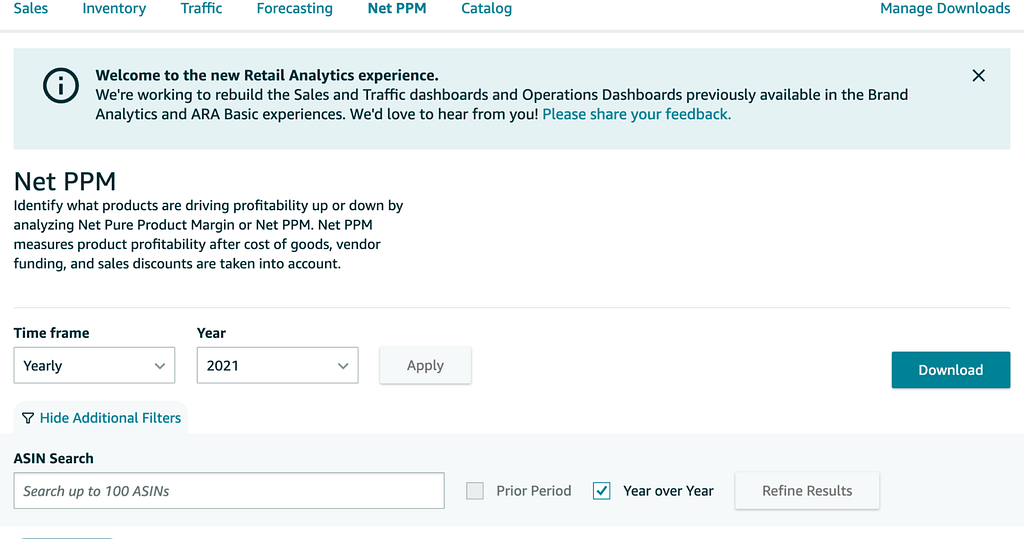
Can I select prior reporting periods in the Amazon reporting interface?
Select Trailing in the Time frame drop-down menu to see trailing period options. Trailing period options include four weeks, 13 weeks, and 12 months. To see the prior period, select Show additional filters.
Regular period options include year-to-date, quarter-to-date, month-to-date, and week-to-date. Select Recurring in the Time frame drop-down menu to see recurring period options. To see year over year, select Show additional filters.
What is the cadence of reporting data availability?
Reports may take up to a week to populate data after a reporting period closes. Amazon targets to update all weekly reports within 72 hours and continuously improves its system to get Vendor reports out faster.
Does ARA support the Lost buy box (LBB)?
The Amazon pricing team no longer supports LBB and can’t provide an LBB metric in ARA until an effective replacement metric is available. An alternative metric, the Lost featured offer (LFO), is in development, but we need to guide when that metric is available.
Are Conversion and average sale prices derived metrics?
Yes, conversion and average sale prices (ASP) are derived metrics, meaning they can be calculated using other metrics already provided in the sales dashboard. Conversion means the number of ordered units divided by glance views. ASP means the amount of shipped revenue divided by shipped units.
Difference between the Manufacturing view and the Sourcing view
All vendors have access to Sourcing views, which will show the sales data for ASINs sourced from a vendor code in the vendor group. If you are a manufacturer, you will also have access to the Manufacturing view, which shows data for any ASIN manufactured by the Vendor, regardless of who sourced the product to Amazon.
There needs to be ASINs in the ARA dashboard. Why?
Here are a few possible reasons:
Distributor view: Make sure you’ve selected the correct distributor view. The Manufacturing view shows data for ASIN numbers you’ve made regardless of where they came from. The Sourcing View displays data of ASINs directly imported into your inventory system from suppliers’ codes in your Suppliers’ Groups.
No data in the period: A product must have data on one of the metrics in a dashboard to display in that particular DashBoard. For example, a product with stock will show in the Stock DashBoard but not in the Sales Dashboard if there were no sales for that product during the time frame specified.
ASIN mapping: Vendors can create an ASIN catalog to map to ARA. When they do so, they must also configure the ASINs to match the ARA report structure. They must wait until the dashboard reflects the changes before seeing them.
Why are there Unowned ASINs in the dashboard?
An ASIN mapping is a likely root cause. If ASINs are correctly mapped to ARA via the correct vendor hierarchies, vendor groups, and attribute setups, they may appear correctly in ARA dashboards. If you’re having trouble with ASIN mappings, contact your retailers or submit an issue through our Support Center, and Amazon will be happy to assist you.
Data does not match the data from the vendor manager or account manager.
You can use Amazon Seller Central (ASIN) level data parity between Amazon Retail Analytics (ARA) and your retailers’ internal systems to report their sales performance. If you want to know if your retailer has reported you for any issues, contact them directly or open a Contact Us request.
Why are some users able to see a particular dashboard while others can’t?
Users who aren’t admins need Financial Reports permission turned on for them to view their inventory. Admins already have all permissions turned on by default. Only an Administrator can turn off another user’s permissions.
What is the Vendor Forecasting dashboard?
The Forecasting dashboard allows you to identify the future demands for your product so you can plan for production and inventory. It doesn’t promise precisely when your potential buyers may buy your product.
What is the meaning of the different P-levels?
The forecasting tool generates forecasts for an ASIN with different levels of certainty or critical ratios (CR) or probabilities. A higher CR or probability level indicates more significant amounts of inventory. For example, if you set a CR of.80 shows an 80 percent chance that the item will be available within 30 days.
Do Vendor purchase orders match with the units forecast?
The report forecasts unconstrained customer demands, which does not guarantee future purchases. If already on-hand or on-ordered units are available to meet customer demands, these would be considered when issuing buy requests.
What is the Vendor Inventory dashboard?
The Inventory Dashboard let you monitor the health of the products in your store by providing weekly reports. You can quickly identify any issues and take action accordingly.
What is the sellable on-hand unit calculation?
In the Inventory dashboard, sellable on-hand units refer to the product’s physical condition as recorded in our inventory before we account for any outbound units, such as customer shipments, transfers, or removals. The sellable inventory does not necessarily mean that it is available on the Amazon website, only that it is not considered defective.
Why am I unable to view inventory metrics at the daily granularity
Some inventory reports aren’t available daily, so the “Inventory Dashboard” report has been disabled.
Out-of-stock (OOS) metrics are not replenishable out of stock (Rep OOS).
ARA surfaces procurable consider both replenishable and non-replenishable products. However, Rep OOS only looks at replenishable ASINs. Since there are more replenishable ASINs than non-replenishable ones, Rep OOS has fewer opportunities to surface new non-replenishable ASIN
There are no ROOS or unfilled orders in the Sourcing view.
This is normal behavior because the data from ROOS (returns ordered online) and unfilled orders (orders not filled by the manufacturer) are only available for manufacturers. These are ASIN-level data, so they cannot be attributed to any particular manufacturer.
If the vendor is a supplier, they will have access to the Supplier Inventory Management (SIM) views, which show ASIN-based inventory levels for each item sold by the vendor code designated in the vendor’s SIM profile. These views are enabled by default. Retailers can disable them if needed.
Net pure product margin (PPM) is calculated as shipped revenue minus shipped PCOGS + CCOGS (cost of goods) minus sales discounts, then divided by shipped revenue.
Why is the Net PPM dashboard not visible?
The Net PPM dashboard is commonly offered only to manufacturers.
Are warehouse deals excluded from the net PPM metric?
Your retailers’ internal systems may include “warehousing” deals. Because these deals aren’t included in Brand Analytics, they’re excluded from the metric. Since the vendor does not collect proceeds from Warehouse Deals sales, they do not account for these transactions.
What is the Vendor Sales dashboard?
The Sales Dashboards allow a Vendor to quickly identify opportunities by showing you how your team is doing against others and where they’re falling behind. The performance reports help companies improve their sales process and increase revenue. The data provides a single view of all data related to sales activities.
Do Vendors have access to Sales Dashboards?
Yes, Vendors can see their own offers’ sales reports, including the number of units sold, the total revenue generated by each offer, and the average price per unit.
Are warehouse deals are excluded from sales metrics?
Your retail partner’s internal warehouse deal reporting tool may include Warehouse Deals. However, ARAs do not report Warehouse Deals in their reported metrics.
Because the vendor does not collect revenue from warehouse deals sales, we don’t count them when calculating our gross profit margin.
If you need to know whether warehouse discounts are included in your internal metrics, contact your retailer or open a Contact Us case.
Will shoppers who return products and receive refunds are counted in shipped items and sales?
ARA accounts for customer returns and refunds in shipments and revenues. When a customer returns their product, the date they returned and canceled orders are attributed to them. Based on the original order dates, sales orders are adjusted for customer returns and cancellations.
Suppose the vendor is an OEM (Original Equipment Manufacturer). In that case, they will have access to their ASIN-specific views, including ASIN-specific data, such as traffic and forecast, for any ASINs they manufacture. Contact retail partners to enable these views.
How does Amazon define a glance view?
GV measures customer traffic and is defined by the number of times someone has viewed the products’ details pages.
How can brands calculate “glance views” (or “looks”)?
When using Brand Analytics reports, GVs are calculated on the ASIN-featured-seller-retailer-product-detail-viewed-by-user-session basis. We expose raw GVs for each session so that retailers can see which sessions were converted by their products.
Because the brand analytics reports show impressions, but the brand analytics metrics don’t include any impression data.
Glance metrics can vary depending on the type of report being run. For example, advertising reports track impression and click data to determine whether an advertisement effectively drove shoppers to the shelf.
However, brand analytics reports measure conversion rates to see if a campaign successfully moved customers to a product detail screen. These two types of reports may differ significantly in calculating glance metrics.
Can you use glances to calculate conversions?
Conversion is the percentage of times a glance view was converted into a sale. It is a derived metric calculated by dividing ordered revenue by glance views.
What is the Vendor Catalog dashboard?
The Catalog Dashboards let you access the latest product details for your items.
How do you access the Catalog dashboard?
This Dashboards module is available to all vendors who have access to ARA regardless if they have additional permissions. Vendors can choose between two views: the manufacturing and sourcing views. Only manufacturers will see the manufacturing tab. Retailers will not see any tabs unless they are a retailer.
Some people don’t see the manufacturing view in the catalog dashboard, while others can’t.
All users will have full access to the Sourcing View if they have access to ARA.
Only administrators can view manufacturing reports for their accounts.
Admins will already be given all permissions by default. An administrator can only grant or remove permission to another user.
What is the Catalog dashboard update frequency?
The reports will automatically refresh every time an updated ASIN attribute becomes available. You cannot manually change the report’s refresh interval.
Do Vendors have access to Amazon Advertising performance reports and data?
Amazon Vendors have direct access to their digital marketing analytics data for each Amazon Marketplace they advertise. The data can be used for Amazon SEO efforts, campaign sales diagnostic, brand lift analytics, and other performance analysis. See Amazon Vendor Central Advertising.
What is Seller and Vendor Brand Analytics?
Brand Analytics reports in-depth cover sales, marketing, operations, customer behavior, and enhanced trends to enable you to make more informed business decisions, assess your market share, identify new opportunities, and monitor factors that affect sales. See Why Amazon Brand Analytics Fuels Growth
Data is generally available in Brand Analytics within 72 hours of the close of a given period.
The key features of Brand Analytics are:
Search: See how customers (in aggregate) find your products and other products on Amazon, including each product’s relative search popularity, click share, and conversion share.
Market basket analysis: Learn what other products are bought along with your products.
Repeat purchase behavior: This shows the number of orders received for each product or brand and the unique customers who placed the orders.
Brand Analytics is located under the Reports tab. This feature is only available if you own your brand and are responsible for selling the brand on Amazon. You must also be internal to the brand and not a third-party company supporting the brand.
If you don’t have access to Brand Analytics, you have not been identified as a vendor who meets the Amazon Brand Registry criteria. You must be a brand owner for an Amazon Vendor Central ( or Amazon Seller Central) account.
Should I use the Amazon Retail Analytics API or the legacy EDI?
APIs are the preferred integration solution compared to EDI and will offer more long-term functionality. APIs have lower infrastructure and development costs relative to EDI, are easier to use, do not require specialized knowledge, and enable efficient near-real-time processing.
Benefits of the SP-API vendor retail analytics report types include:
Source data for the API reports are from the same source used by Amazon retail category teams
Data parity across API reports and Amazon Retail Analytics dashboards in Vendor Central
Enabling integrators to specify and request data from different time range aggregations, such as daily, weekly, monthly, quarterly, yearly, and trailing four weeks
Easy-to-access data backfills for historical data
Openbridge is a cloud-based Amazon Vendor Central software tool designed specifically for Amazon Sellers and Vendors. It allows you to simultaneously automate API data feeds across multiple accounts, monitor sales performance across all channels, and automate inventory management and shipping processes.
Do you need a verified Amazon Vendor Central Partner? Looking for data automation?
Amazon's Net Pure Profit Margin (Net PPM) is an essential key performance indicator (KPI) for Amazon Vendors.
What is Net PPM?
Net PPM reflects the product profitability after expenses like the cost of goods, vendor funding (co-op activities), and sales discounts. Per Amazon, the metric will;
"identify what products are driving profitability up or down by analyzing Net Pure Product Margin or Net PPM. Net PPM measures product profitability after the cost of goods, vendor funding, and sales discounts are considered."
The good news? No need to worry about calculating your Vendor Net PPM; Amazon offers data to analyze this metric as part of a collection of Amazon Retail Analytics reports.
How about some more good news? The metric is part of a more extensive collection of ARA reports. The reports include data for glance views, margins, sales performance, and many others. The metrics in the ARA support deep dives into sales diagnostics, the financial health of your vendor account, trending product sales, and insight into products that can be optimized.
ARA reports are available for Vendors in North America, Europe, and APAC.
Why is Net PPM crucial for your business?
Amazon Net PPM provides insight into whether a product generates enough profit from its sales, providing clues that help ensure operating and overhead costs are contained.
While companies use Net PPM to assess operational profitability performance, the metric can also impact other aspects of an Amazon business. For example, poor performance can;
affect your ability to sell products through Amazon Advertising because you cannot continue supporting your marketing campaign with paid media.
impact future Amazon purchase orders due to "Amazon Can't Realize a Profit (CRaP)."
cause Amazon to concede the buy box to competitors.
Amazon automatically provides a Net PPM in reports. As a result, there is no need to invest the effort to calculate it yourself. However, it can be helpful to understand how it is calculated so you can make informed decisions to optimize your Vendor operations.
As we have stated previously, Net PPM measures the profitability (profit/cost) of an item sold through Amazon.com.
Amazon calculates ASIN level Net PPM based on the following formula:
Average Selling Price - Cost Price + Vendor Negotiated Contract Terms) / Average Selling Price
Note that your Vendor terms, at the account level, will impact your performance, so ensure you negotiate favorable terms to maximize your opportunity for profit.
A sales discount is deducted from your margin when a customer receives a discount. A discount may be promo code redemptions, lightning deals, and similar. Amazon includes these sales discounts as part of the Net PPM in Vendor Central. Also, note that the Net PPM metric Amazon shares does not factor spending on Amazon Advertising, any chargebacks, or specific costs related to payment terms.
Where Can I Find Net PPM in Amazon Vendor Central?
Amazon offers two primary methods to access Net PPM data in Vendor Central. The first method is manual reporting downloads, and the second is Amazon API automation software.
Manual Downloads: Log into your Vendor Central account and download the report.
Automation: Ensures your team can skip the manual data wrangling and take control of your Inventory data and store it in a private data lake or cloud warehouses such as Snowflake, BigQuery, Amazon Athena, Redshift, and Azure Data Lake. Your team can then leverage best-in-class analytics and business tools like Tableau Looker, Power BI, and Google Data Studio to fuel Amazon analytics via custom reports, interactive graphs, and sales dashboards.
Manual Download Net PPM Reports
The first method we mentioned is a downloaded report file available on the account interface. Select "Reports" and "Retail Analytics. "There will be a report listed called "Net PPM" similar to the screen below:
What is the downside of manual report downloads? Someone logging in daily, downloading reports, and manually tracking 100s of report files needs to scale better. This approach can result in time-consuming and error-prone work, especially if you need consistent access.
Amazon Vendor Central Software Automation For Reports
Suppose you are an individual Vendor, a large brand, an agency, or an FBA acquisition company. In that case, API automation provides various features, including the ability to perform code-free, fully automated Net PPM reporting data feeds to a data lake or cloud data warehouse.
Automation will automatically generate reports, process, route, and load to your private data destination so you can manage and optimize your sales and inventory. Automation also supports other Vendor Retail Analytic reports for which items are selling best, sales history, glance views, and other Amazon Vendor Central reports.
Vendors also have direct API access to Amazon Advertising (Sponsored Ads, DSP, Attribution) performance data.
Tools For Amazon Automation
No more manual data wrangling. With data unified and accessible, quickly optimize for poor conversion rates, identify gaps in operational performance, uncover the percentage of customers converting, or refine advertising efforts on and off Amazon.
Data automation unlocks the ability to use BI tools that can spot trends and adjust your business in response to changing market conditions.
Rather than a mess of file downloads, automation will unify your data to a leading data lake or cloud warehouses like Databricks, Redshift, Redshift Spectrum, Google BigQuery, Snowflake, Azure Data Lake, Ahana, and Amazon Athena for a unified, analytics-ready single source of truth to fuel informed decisions on product, media, and customer demand.
Unified data opens new opportunities for Vendor analytics. For example, for self-service reporting and insights, you can use your Google Data Studio, Tableau, Microsoft Power BI, Looker, Amazon Quicksight, or many others.
Get Started — For Free
Ditch manual report file downloads! Openbridge offers direct, code-free, and fully-automated access to Amazon Net PPM data. Our Amazon automation gets you the data you need to accelerate your Vendor Central business.
Does Amazon’s Net Pure Profit Margin reflect the financial health of my Vendor business with Amazon?
Yes, it can. However, it should not be viewed in isolation from other product and account metrics.
Is there an API for Vendors?
Yes, the Amazon Selling Partner API and Amazon Advertising API provide direct, official access to Vendor sales performance, inventory, net pure profit margin, purchase order, and other report metrics. The API supports yearly, daily, and weekly reporting periods.
Amazon brand analytics, sales diagnostics, amazon search terms report, Glance Views, and other report automation is available, saving your team from manual file downloads.
Rather than manually dealing with a single report and export a comma-separated report each day, the API supports fast, code-free access via Openbridge Amazon Vendor Central software.
Does my brand need to enroll in Amazon Brand Registry?
Yes, your brand should be enrolled in the Amazon brand registry. Not only does this protect your brand, but your Vendor account will also be able to access Brand Analytics reporting.