Discover the potential of a unified non-Amazon and Amazon digital shelf with an automated, private data shelf
The digital shelf is one of the most talked about topics in retail today. And it’s easy to see why. Digital shelves are where consumers go to find products and make purchases. They are becoming increasingly important as shoppers shift away from traditional brick-and-mortar stores. Retailers want to capitalize on this trend by creating a seamless experience across channels.
But most companies aren’t taking full advantage of their “data shelf” for performance insights. A survey by Shopify stated that only one in five retailers use a digital shelf strategy and digital shelf analytics. And many of those who do, admit they don’t fully capitalize on the opportunity.
So why are some businesses still missing out on an opportunity? Because they haven’t taken advantage of the data at their fingertips to fuel their digital shelf analytics.
What Is a Digital Shelf?
The broadest of the digital shelf is that it reflects the shopper’s journey. As a result, a digital shelf demonstrates a collection of product images, emails, videos, reviews, ratings, price information, social media posts, etc., displayed prominently in a shopping experience aligned with your channels.
These elements help customers discover products and learn more about them. For example, Amazon displays product images, customer reviews, and prices on its site. Walmart uses similar tactics to display product information and photos.
How Does a Strong Digital Shelf Help Increase Sales?
A strong digital shelf often reflects a robust shopper experience strategy. This includes a comprehensive digital marketing model that reflects the broader customer journey, from an advertising strategy, social, merchandising, and targeting the right keywords in your SEO strategy.
A robust digital shelf improves consideration, and brand awareness helps reduce abandonment rates and increases conversion rates. Here are a few core benefits of an insights-driven digital shelf;
- Improves your cross-channel marketing efforts and connects them to the user and company goals. Don’t rely solely on upper-funnels metrics for your different marketing campaigns. Get a full-funnel perspective of how your marketing strategies benefit your users and company regardless of which campaign they’re part of.
- Delivers digital self insights, you’ll discover new ways to engage with shoppers on and off Amazon to increase product consideration, sales volume, and conversion rates.
- Whether your campaigns are paid or organic, you can make in-flight optimizations, informed by Amazon conversion reporting, to ensure your strategies effectively and efficiently drive sales.
- Understand which parts of your business are driving sales performance so you can optimize future products and campaigns with the insights needed to be successful.
How Do You Understand The Digital Shelf on Amazon (and off Amazon)?
The Amazon digital shelf is a collection of product detail pages, reviews, images, videos, ads, and other information about products that are displayed on Amazon.
Marketing, social, and shopper engagement off Amazon also drives to your listings so this is a critical part of your shelf. These items help shoppers become aware of your products and make better decisions about what to buy and when to buy, including repeat purchases.
Brands should understand the importance of the Amazon digital shelf because it provides a way to connect with consumers where they’re looking. Amazon provides brands with opportunities to interact with consumers in ways that go beyond traditional advertising. For example, Amazon Attribution provides insight into how brands’ non-Amazon marketing channels (social, organic, direct, and email marketing…) impact digital shelf performance on Amazon.
The following are various aspects of the Amazon digital shelf that contain key metrics for different aspects of the shopper journey;
Amazon Sponsored Advertising
Amazon Advertising offers Sponsored Products, Sponsored Brands, Sponsored Display, Stores, and Video Ads. The services cover a gamut of Ad related activities like relevant keywords, search ads, product display ads, sponsored product ads, and many others.
This data is available as manual downloads or via Amazon Advertising API Automation. Also, see Amazon Advertising Reports: Performance Data for a deeper dive into the available data.
Amazon DSP (Demand Side Platform)
Allows advertisers to buy high-quality Amazon search, display advertising, video ads, brand awareness, and audio ads on and off Amazon at scale to target a relevant audience in real time.
See How To Unlock Amazon DSP Insights, Reporting, & Optimization
Amazon Attribution
Extends the reach of your digital shelf marketing efforts to non-Amazon channels. It allows you to understand better purchase rates and customer journeys to optimize digital marketing strategies and advertising channel effectiveness.
See Why Amazon Attribution Reporting Data Supercharges Insights
Amazon Retail Analytics
Amazon offers an incredibly robust array of data on retail product performance. They get you the data you need to go deep from orders, returns, inventory, and fulfillment.
- Amazon Inventory: Get FBA Inventory Reports data for the listing, condition, disposition, and quantity to help with day-to-day inventory.
- Amazon Fulfillment: Get complete, product-level detail on inbound shipments, shipped FBA orders, quantity, tracking, and shipping with FBA Fulfillment Reports and Inbound Fulfillment API.
- Amazon Orders: Online orders and item information for both FBA and seller-fulfilled orders, including order status, fulfillment and sales channel information, and item details with Order API and FBA Orders Reports.
- Amazon Finance: Balances, payouts, estimated and actual selling, storage, and fulfillment fee data with FBA Settlement Reports, FBA Fees, and Finance API
- Retail Analytics: Vendor Retail Analytics delivers ordered revenue, glance views, conversion, replenishable out-of-stock, lost buy box, returns, replacements, and many more.
For automated sales reporting data feeds, see Amazon Seller Central Sales Report Automation. If you are unclear about which of the many sales and order reports is suitable for you, check out our breakdown “Understanding Amazon Order and Sales Reports.”
Amazon Search Terms
The reports provide valuable insights into customer behavior, ranking position, and unit sales in search results which can help you understand product visibility and develop more effective marketing strategies and strategic decisions that drive product sales.
Discover performance-focused keyword ideas, and identify key search terms that meet business objectives. Uncover product details and top keywords your competitors are targeting, and many more so you can trend activity over time.
If you are looking for automated search keyword data feeds, see Direct, Automated Amazon Search Volume Data, and Amazon Brand Analytics Search Terms: Untapped Potential. Also, we detailed the importance of keywords in the posts Why Amazon Brand Analytics Fuels Growth and digital shelf metrics for brands in Amazon KPI Metrics For Advertising + Marketing.
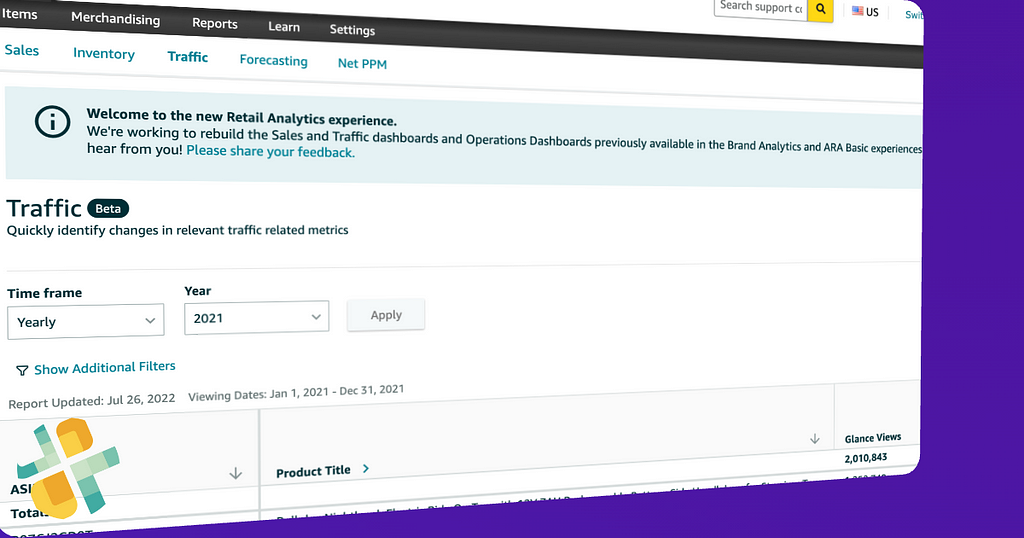
Amazon Sales and Traffic
Business level Sales and Traffic reports offer performance metrics for product sales, revenue, units ordered, and page traffic metrics such as page views and buy box. Amazon now offers these reports via their API for complete automation; see automation of Amazon Detail Page Sales and Traffic Business Reports.
Amazon Brand Stores
Amazon brand stores give third-party sellers access to a tool to package, present, and sell products directly through the e-commerce giant. Brands can choose whether to use a branded product listing or a custom listing. They can also add images, videos, reviews, and pricing information to their listings.
What Is Digital Shelf Monitoring?
Digital shelf monitoring allows retailers to track performance and product trends over time. This information can help retailers determine whether certain items are selling well online or offline and provide insight into promotional effectiveness.
For example, you can use Google Data Studio + Amazon Seller Central data to create dashboards, reports, and visualizations that provide a rich, tailored view of your private data shelf.
Why Monitor Your Digital Shelf
Here are a couple of benefits of keeping tabs on your digital shelf in your efforts to capture the next sale;
- Uncover where you are missing out on potential sales opportunities and double down on marketing tactics that drive performance.
- Optimize product tiles, product descriptions, product page design, or other elements of your product content in listings, ads, or social posts.
- Minimize any blind spot trying to understand the impact Google Ads (formerly Google AdWords), Facebook, and Microsoft Ads…have in driving potential customers’ shopping activity on Amazon.
- Understand sales attribution, audience strategies, and opportunities for optimizing additional products into a conversion funnel.
- Make multi-channel campaign recommendations and optimizations using on-demand insights to accelerate e-commerce marketing efforts.
- Explore competitor threats with trending, first-party search data directly from Amazon, including market share for keywords and products.
- Leveraging conversion insights can inform automated bid and budget optimizations to provide valuable insight to improve your campaign ROI.
- Use data to drive changes and optimize an account or campaign-level marketing plan.
What Is Digital Shelf Analytics?
Digital shelf analytics allows merchants the ability to analyze consumer interactions with products on the shelf. This includes everything from product reviews to social media mentions.
Even if you are only focused on Amazon as your sales channel, understanding the efficiency and effectiveness of your digital shelf concerning who and when people buy your products is essential to any detailed sales impact analysis your team may undertake.
Private, Digital Shelf Analytics Software Owned By You
Your digital shelf analytics suite can be as simple as the tools you may already be using for reporting and analytics!
Brands can now automate Amazon Digital Shelf data collection into a private, trusted data shelf. Rather than leveraging proprietary digital shelf analytics providers, you can take control and own your data.
Direct, automated access to your digital shelf data allows you to use your favorite business intelligence, data visualization, SQL, or data science tools like Google Data Studio, Tableau, Microsoft Power BI, Looker, or Amazon Quicksight to perform digital shelf analytics. Create customized traffic dashboards, track spending on advertising campaigns, or additional reports that allow you to build competitive shelf intelligence.
Data Impact: Unify And Own Your Data To Fuel Your Digital Shelf Optimization Efforts
With direct access to the digital shelf data, you can undertake an in-depth or comparative analysis across brands, define actionable insights, or use direct access to campaign reporting to optimize marketing efforts.
- Unify your data shelf into a leading data lake or cloud warehouses like Amazon Redshift, Amazon Redshift Spectrum, Google BigQuery, Snowflake, Azure Data Lake, Ahana, and Amazon Athena for a unified, analytics-ready single source of truth to fuel informed decisions on product, media, and customer demand
- With digital shelf data unified and accessible, quickly optimize for poor conversion rates, identify gaps in operational performance, uncover the percentage of customers converting, refining advertising efforts on and off Amazon, or discover key customer metrics that impact purchase decisions.
Get Started Now With Digital Shelf Analytics
Harnessing your data shelf reflects true impact data, or data that can fuel insights driven growth.
In a fast-paced e-commerce environment, an online retailer’s digital strategy can not succeed by relying on manual, error-prone, and inaccurate data. Supercharge omnichannel analytics solutions like Tableau, Power Bi, Google Data Studio, Looker, and many others with direct, automated digital shelf data. Digital shelf insights with these tools are convenient, fast, and always owned by you.
Your competition is using a private, first-party digital shelf analytics platform as a competitive advantage, and so should you.
Unify your shelf and start your data impact analysis journey today.
Sign up for a 30-day free trial of our fully-automated data shelf feeds today!
Unlocking The Power Of Digital Shelf Analytics was originally published in Openbridge on Medium, where people are continuing the conversation by highlighting and responding to this story.
from Openbridge - Medium https://ift.tt/e7nJ5MF
via IFTTT