Leverage Glance View Metrics To Deliver Insights For Product And Ad Optimizations
In this article, we will cover an important collection of critical metrics for merchants on Amazon vital to understanding your e-commerce strategies’ success.
What Is A “Glance View”?
Glance views are considered an essential metric for e-commerce performance. Why? It gives you a way to track how many people are looking at each product in your store, which lets you measure how many potential customers may be in the market for that item and how they may be converting.
While Glance view metrics can vary based on various platforms and the specific inputs or filters applied to those metrics, as a general rule these views reflect a level of consumer awareness and consideration for a product.
For example, advertising may track impressions and clicks to evaluate the efficacy of an ad that takes the customer to the shelf. However, once the consumer arrives at the product page, you want to understand the impact. This is where this metric comes into play so you can better understand the interest and what percentage of those interested in your product listings convert.
What Are Glance Views On Amazon?
While the metric has applications off Amazon, it is widely used on Amazon Seller Central, Vendor Central, and Amazon Ads to assess performance.
Glance views on Amazon provide insights into the directional demand for a product. As a result, this metric allows a Vendor to track glance views by product for their entire catalog. For example, Vendor Central Retail Analytics tracks customer traffic to a detail page where Amazon Retail product is the featured offer. The metric reflects there was an opportunity to convert consumers from interest to purchase.
This metric is calculated at the ASIN level and only when Amazon Retail is the featured merchant. As a result, these are precious ASIN-specific insights for Vendors (and Sellers). By exposing raw glance views in reports, Amazon provides Vendors with the traffic data where Amazon Retail had the opportunity to convert a sale.
What is a Fast Track Glance View?
When a product is listed as a “Fast Track” item, customers can see it while browsing other products. Amazon tracks the percentage of customers clicking on the product detail page, indicating customer intent.
Glance Views vs. Impressions
- Glance Views show the number of times a Product Detail Page is viewed.
- Impressions reflect the number of people shown a specific creative (text, image, video, etc.). Impressions are most commonly associated with Amazon Ads or ad platforms off Amazon like Google or Facebook.
Why Do Glance Views On Amazon Matter?
The metric is one of the most important metrics used by Amazon to make decisions about what products are placed in the buy box and what goes into replenishment.
This metric tells a merchant whether they optimize their inventory correctly for the customer’s needs or if their content is aligned to drive conversions. Amazon uses this metric to decide which items should go into the buy box and which products should go straight into the buy box fast track.
You can use this metric to improve your merchandising strategy. In addition to helping you manage inventory, it helps optimize a merchandising strategy. Knowing where customers spend their time, you can adjust your merchandising strategies accordingly.
Your content and inventory must be optimized for your customer’s needs. When you optimize both, you ensure that each item is priced correctly, described in a manner that creates demand and stocked appropriately. As a result, content and inventory optimization is key to increasing your sales.
If your content and inventory aren’t optimized, you’ll never know why some products sell well while others don’t.
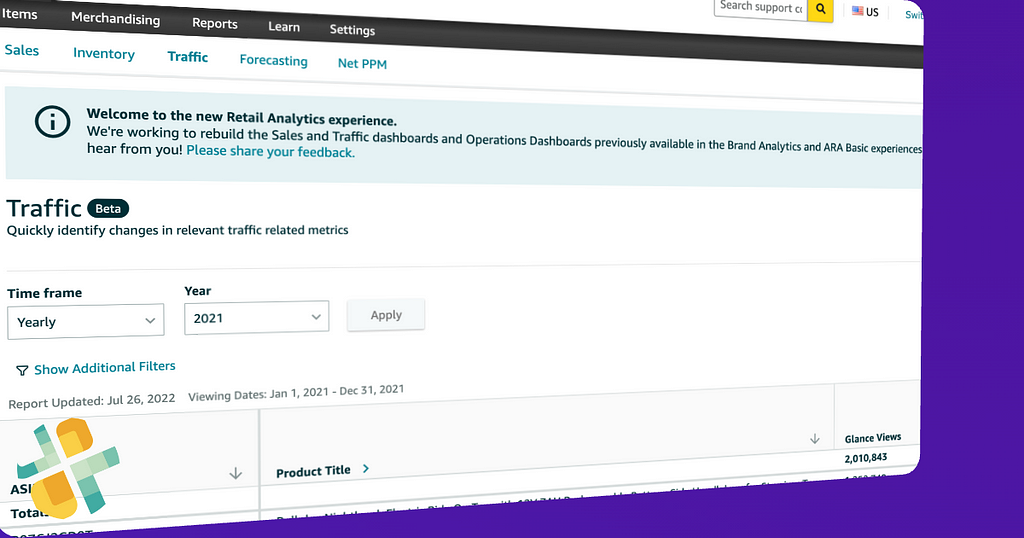
Where To Find Glances Views?
Sales Diagnostic
With the release of Amazon Retail Analytics for Vendors, direct access to the data is now possible without complex EDI integrations. Originally part of ARA Premium, the information is now available via the Selling Partner API. The collection of reports allows Vendors to identify opportunities by determining what contributes to sales performance quickly.
- Ordered Revenue: Ordered Product Sales in the selected time frame. Adjustments are made for returns.
- Ordered Units Number of units ordered by Amazon customers.
- Average Sales Price Average price per ordered unit.
- Customer views of a product detail page.
- Conversion Rate The purchase rate of customers viewing your products.
- Rep OOS Replenishable Out Of Stock. Product received when it was out of stock but replenishable as a % of total product.
- Lost Featured Offer (LFO) Price Lost Featured Offer due to price when the product is in stock.
Amazon Advertising Glance Views
Amazon Ads provides visibility across digital sales channel drivers. In addition to Vendor Retail Analytics, Amazon Advertising Sponsored Display reports also include glance metrics as a critical Amazon Advertising KPIs. This metric can then be paired with other advertising metrics such as ACOS, orders, and detail page views. Combined, these metrics provide a holistic view of your advertising efforts for Sellers and Vendors alike.
How To Increase Glance Views On Amazon?
The key to increasing performance is understanding what it is measuring, which is awareness and consideration. The metrics apply to your entire catalog, which means you can that interest and awareness reflect organic conversion rate metrics. This will also apply to those marketing campaigns designed to drive traffic to your brand and products.
So putting this into a broader context and strategy is needed. Looking holistically at the consumer journey will provide a robust data set to undertake meaningful optimizations to improve performance.
As a result, extending your Amazon Glance view definition with custom conversion rate metrics is important. For example, using standard calculations, you can calculate various conversion metrics in almost any data tool. Look at your broader sales diagnostics reports, ads campaign reports, search traffic, and attribution data for anything “off-Amazon” that drives traffic. Combined, this will allow you to refine an approach that increases views and converstions.
While these metrics may vary, below is a collection of simple, easy-to-use calculations you can include in your favorite tools like Google Data Studio, Tableau, Microsoft Power BI, Looker, Amazon QuickSight, SAP, Alteryx, dbt, Azure Data Factory, or Qlik Sense.
- Product conversion rate = Total Orders / Customer views
- % Replenishable Out of Stock = (when the item was Out of stock / Total customer views)*100
- % Vendor Buy Box Fast Track = (Views with a Fast Track offer / Total customer views)*100
- % Vendor Replenishable Buy Box Fast Track = (Fast Track customer views on Replenishable Items / Total customer views on Replenishable Items)*100
- % Views on Non-Replenishable Items = (Customer views on non-replenishable items / Total customer views of your items)*100
Amazon Brand Analytics Reports offer additional context, such as providing actionable insights on organic traffic search traffic. Combine that data with Amazon Vendor Central Retail Analytics reports for critical metrics on Amazon daily traffic to detail pages, sales, and conversions.
Summary
Amazon supplied data means you gain first-party insights into product performance without relying on third parties. Tapping into the automated data feeds offers teams a new opportunity to perform low-level diagnostic insights that drive product sales or better understand campaign impact on sales.
Amazon makes the data available via daily updates. You can manually download an excel or CSV file type or automate the flow of this data. Why automate? With direct access to the reporting data, you can undertake an in-depth analysis or comparative analysis across brands or use direct access to campaign reporting to optimize marketing efforts.
- Unify your Vendor Reports into a leading data lake or cloud warehouses like Amazon Redshift, Amazon Redshift Spectrum, Google BigQuery, Snowflake, Azure Data Lake, Ahana, and Amazon Athena for a unified, analytics-ready single source of truth to fuel informed decisions on product, media, and customer demand
- With data unified and accessible, quickly optimize for poor conversion rates, identify gaps in operational performance, uncover the percentage of customers converting, refining advertising efforts on and off Amazon, or discover key customer metrics that impact purchase decisions.
Sign up for a 30-day free trial of our fully-automated Amazon Glance View data feeds today!
References
How To Use Amazon’s Glance View As A Key Performance Metric was originally published in Openbridge on Medium, where people are continuing the conversation by highlighting and responding to this story.
from Openbridge - Medium https://ift.tt/6AuBXt2
via IFTTT