
A deep dive into the Vendor Central Inventory Reports
Amazon offers Vendor Central accounts a set of Inventory Reports via Amazon Retail Analytics (ARA).
Specifically, Amazon states these reports;
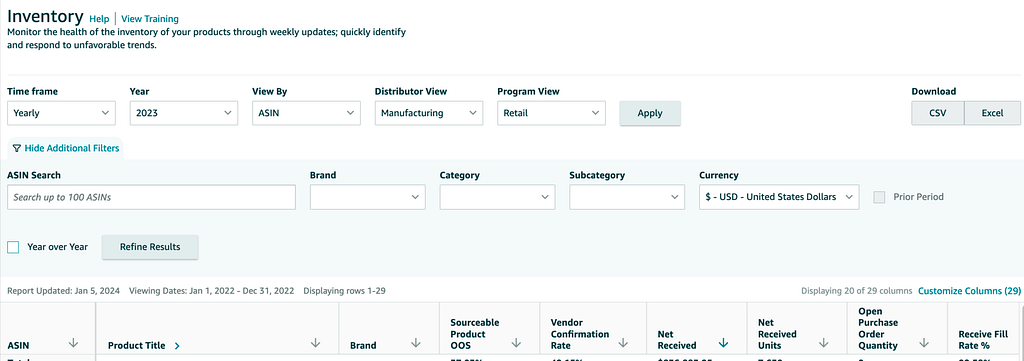
Monitor the health of the inventory of your products through weekly updates; quickly identify and respond to unfavorable trends.
As such, Vendor Central Inventory Reports are valuable for manufacturers, retailers, and supply chain managers in making informed decisions on the health of their Amazon business.
What are the benefits of the Amazon Vendor Central Inventory Reports?
There are a few benefits; specifically, the inventory reports aid in optimizing inventory levels, improving vendor relationships, enhancing customer satisfaction, and maintaining a healthy financial status. By analyzing this data, businesses can identify trends, anticipate future demands, and adjust their strategies.
- Inventory Management: They provide a comprehensive view of the inventory status, including stock levels, order quantities, and aged inventory. This helps in managing inventory more efficiently, reducing overstock or stockout situations.
- Vendor Performance Analysis: Metrics like vendor confirmation rate and lead time offer insights into vendor reliability and performance, enabling better vendor management and selection.
- Financial Planning: Information on the net value of received inventory and sellable aged inventory assists in financial planning and forecasting.
- Supply Chain Optimization: The reports can identify supply chain bottlenecks, such as products with high unfilled customer orders or long vendor lead times.
- Customer Satisfaction: Businesses can improve customer satisfaction by monitoring out-of-stock rates and unfilled customer orders.
- Health of Inventory: Tracking unhealthy units helps maintain inventory quality and reduces losses due to damaged or expired products.
What Data Is Included In The Vendor Central Inventory Report?
Here’s a breakdown of the columns included in the Vendor Central Inventory Report (Manufacturing):
- ASIN (Amazon Standard Identification Number): A unique identifier for each product listed on Amazon.
- Product Title: The name or title of the product.
- Brand: The brand associated with each product.
- Sourceable: Indicates if the product is sourceable or not.
- Product OOS (Out of Stock) Vendor Confirmation Rate: The rate at which vendors confirm out-of-stock situations.
- Net Received: The net value of received inventory.
- Net Received Units: The total number of units received.
- Open Purchase Order Quantity: The quantity of products on available purchase orders.
- Receive Fill Rate %: The percentage of orders filled upon receipt.
- Overall Vendor Lead Time (days): The average time vendors take to fulfill orders.
- Unfilled Customer Ordered Units: The number of customer orders that remain unfilled.
- Aged 90+ Days Sellable Inventory: The value of inventory that has been sellable but aged over 90 days.
- Unhealthy Units: The count of units considered unhealthy (e.g., damaged, expired, etc.).
The Vendor Central Inventory Sourcing report contains data similar to the manufacturing report, with a few notable differences. Here’s a breakdown of the columns in the sourcing report:
- ASIN (Amazon Standard Identification Number)
- Product Title
- Brand
- Vendor Confirmation Rate: The rate at which vendors confirm the sourcing of products.
- Net Received: The net value of received inventory.
- Net Received Units: The number of units received.
- Open Purchase Order Quantity
- Receive Fill Rate %
- Overall Vendor Lead Time (days)
- Aged 90+ Days Sellable Inventory: The value of inventory that has been sellable but aged over 90 days.
- Unhealthy Units
How To Access Vendor Central Inventory Reports?
Vendors have two primary paths to access reports: manual downloads or API automation.
Manual downloading occurs in your Vendor Central account interface. Automation taps into the Amazon Selling Partner API (Amazon SP-API) to automate report processing and storage in a cloud warehouse or data lake (see the Amazon docs here).
Manual Access via Vendor Central:
- Login: First, Vendors must log into their Amazon Vendor Central account.
- Navigate to Reports: Usually found in the main navigation bar, this section contains various sales, inventory, and performance reports.
- Locate the ‘Inventory’ within the Reports section
- Select Date Range: Amazon allows Vendors to pull reports based on specific dates. Choose the desired range.
- Download: Once the report has been generated, there will typically be an option to download it. The report is often available in different formats .csv or .xls.
Note: Manual downloads are more time-consuming and may not be ideal for frequent and up-to-date data analytics.
Automating Vendor Central Data:
The Amazon Selling Partner API (SP-API) allows for direct, automated access to Amazon Vendor data, making it easier for businesses to integrate it into their systems. Openbridge allows Amazon Vendors to save time manually downloading reports, increasing data velocity and reducing errors in messy merging and tracking downloaded reports.
The following are just a few examples of reports you can create with automated data using tools such as Google Data Studio, Tableau, Microsoft Power BI, Looker, or Amazon Quicksight:
- Vendor Confirmation Rate by Brand: A bar chart showing the vendor confirmation rate for different brands. This could provide insights into which brands have more reliable supply chains.
- Net Received Units versus Open Purchase Order Quantity: A scatter plot comparing the number of units received against the quantity ordered for each product. This could highlight discrepancies and efficiency in fulfilling orders.
- Overall Vendor Lead Time: A histogram or box plot displaying the distribution of vendor lead times. This would help in understanding the variability in lead times across products.
- Aged Inventory: A pie chart showing the proportion of inventory aged over 90 days for different products. This is useful for inventory health analysis.
Unlock Effortless Inventory Management With Our Code-Free Amazon Integration
Are you struggling with complex, messy inventory data management for Vendor Central? Say goodbye to the hassle. Openbridge offers a seamless, automated solution that unifies your data into a private, trusted data warehouse or data lake like Amazon Redshift, Databricks, Google BigQuery, and more — all without a single line of code.
Why Choose Openbridge?
- Automate with Ease: Skip the manual report downloads. Enjoy automated data feeds directly into your private cloud data warehouse or data lake.
- Data-Driven Insights: Leverage high-velocity data for machine learning, business intelligence, and more.
- Versatile Compatibility: Works effortlessly with Google Data Studio, Tableau, Microsoft Power BI, and other tools.
Openbridge automation extends beyond inventory to a broad collection of Amazon and non-Amazon data sources;
- Brand Analytics
- Retail Analytics
- Retail Procurement
- Direct Fulfillment
- Real-time Traffic, Sales, and Inventory
- Amazon Advertising
Automate And Unify Your Vendor Central Inventory Data — Free For 30 Days
Start your journey towards data-driven growth and profit with Openbridge. Our code-free, fully automated Selling Partner API integration simplifies your Amazon Vendor Central operations.
Ready to Transform Your Amazon Inventory Data?
→ Sign up for a 30-day free trial of our Vendor Central Inventory Report automation.
Digging Into Amazon Vendor Central Inventory Reports was originally published in Openbridge on Medium, where people are continuing the conversation by highlighting and responding to this story.
from Openbridge - Medium https://ift.tt/qHClGMI
via IFTTT