The Amazon Subscribe & Save program offers a powerful way to drive recurring revenue, boost customer loyalty, and grow your business. But to maximize your results, you need timely, accurate, and comprehensive data to inform your strategies. That’s where automated Subscribe & Save performance reporting comes in.
What is the Amazon Subscribe and Save Performance Report?
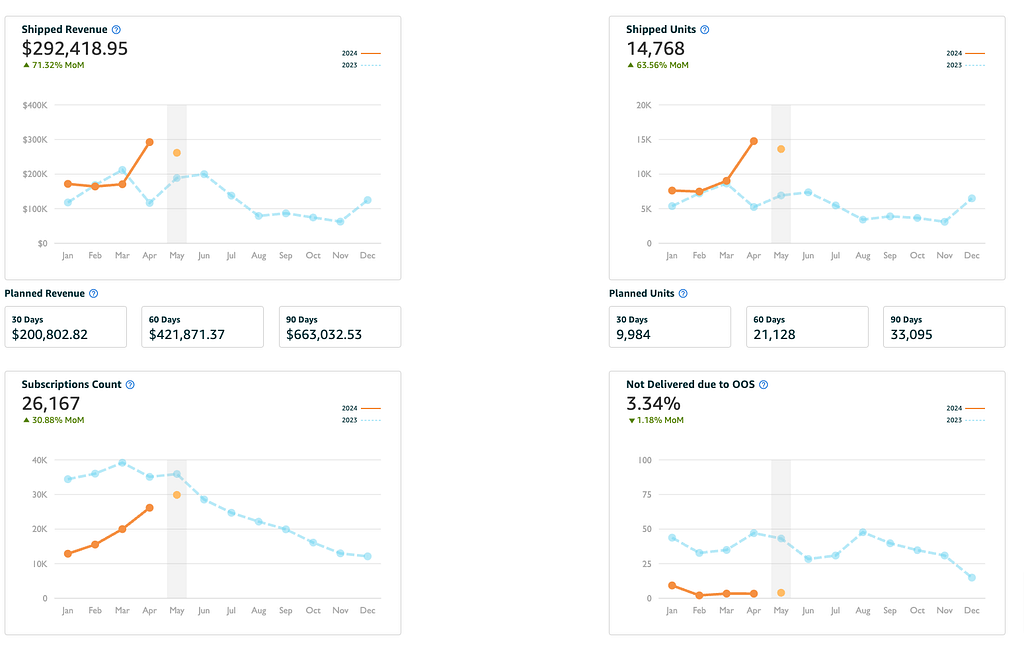
The Amazon Subscribe & Save Performance Report offers a comprehensive four-week snapshot detailing items shipped, out-of-stock percentages, post-discount sale prices, and average discounts for each SKU.
For a forward-looking perspective, the Amazon Subscribe & Save Forecasting Report provides an eight-week sales forecast, enabling you to anticipate demand and plan accordingly.
Combined, both are invaluable reports that empower you to maintain compliance with program terms, ensuring a consistent and reliable experience for your subscription customers. You can enhance your inventory management, pricing strategies, and overall sales performance by leveraging data insights.
The Value of Subscribe & Save Performance Reporting
So, what KPIs should you track in your Subscribe & Save Performance reporting, and how can that data help you improve?

Here are a few examples:
Subscription sales & revenue: Monitoring trends in your subscription units and revenue, both in aggregate and at the SKU level, is crucial to gauge the health of your program. You can identify top-performing products to double down on and spot issues like declining sales early on.
Inventory forecasting: The sns-units-shipped-week-X fields in the performance report show a trailing 4-week view of your subscription volume. Combined with the forecasting report that projects demand up to 8 weeks out, you can ensure you maintain optimal stock levels to avoid costly stockouts that disrupt the subscriber experience.
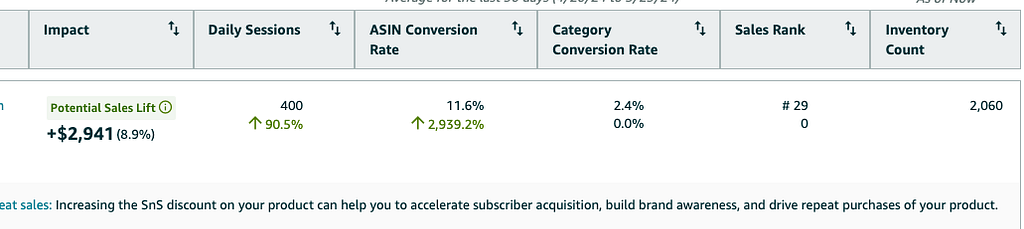
Discount & pricing optimization: The sns-discount-week-X and “sns-sale-price-week-X” columns allow you to track your effective discounting and pricing over time. Experiment with different discount levels to find the sweet spot that maximizes your subscription volume and profitability.
Out-of-stock rate: Keep a close eye on the “oos-rate-week-X” fields to monitor your in-stock rate. If you see an uptick in OOS, it’s time to adjust your inventory buffers. You can set alerts to automatically notify you if the OOS rate exceeds a certain threshold.
With metrics like these flowing automatically into a centralized data store, you can quickly slice and dice the numbers to uncover actionable opportunities to improve your Subscribe & Save performance.
Accessing the Data: Subscribe & Save Performance Report Schema
To set up your automated reporting, it’s helpful to understand the schema of the Subscribe & Save Performance Report. Here are the key fields:
- snapshot-date: Report date
- sku: Seller-defined SKU for the product
- fnsku: Amazon-defined SKU for the product
- asin: Amazon Standard Identification Number
- product-name: Product title
- week-X-start-date: Start date for the reporting week. Four weeks are included, with Week 1 being the most recent.
- sns-units-shipped-week-X: Subscription units shipped in the given week
- oos-rate-week-X: Out-of-stock rate for the week
- sns-sale-price-week-X: Average sale price of subscription units for the week
- sns-discount-week-X: Average discount on subscription orders for the week
Manual Reporting to Fully managed, Code-Free Automation
Manually downloading Subscribe & Save reports from Seller Central is time-consuming and prone to errors when merging data. By automating your reporting with Openbridge, you can:
- Save hours spent on tedious data exports and get near real-time access to your metrics
- Centralize your Subscribe & Save data alongside other datasets in a cloud data warehouse or data lake
- Gain a reliable, unified view of your subscription sales to power holistic analytics
- Easily feed data into BI tools like Tableau or Google Data Studio for powerful visualizations
With automated reporting, you’ll have the Subscribe & Save insights you need to make smarter decisions and drive better results, all while spending less time in data collection.
Dive Deeper into Amazon’s Reporting Data
The Subscribe and Save data is just the tip of the iceberg. Sellers eager to delve deeper can tap into many more Amazon performance and insights datasets:
- Brand Analytics
- FBA Fees
- Finance API
- Fulfillment
- Inventory
- Sales & Traffic
- Orders API
- Top Search Terms
- FBM/MFN PII
- Settlement
- Returns
Getting Started — Automate Today
Are you interested in tapping into your Subscribe and Save data? Get started so you can create data-driven insights fast.
Try our code-free, full-automated Amazon Subscribe and Save data integration today with a 30-day free trial!
Automating Amazon Subscribe and Save Performance Reporting was originally published in Openbridge on Medium, where people are continuing the conversation by highlighting and responding to this story.
from Openbridge - Medium https://ift.tt/KUTqA7B
via IFTTT