Amazon provides powerful analytics tools to help sellers optimize their product listings and better understand customer behavior.
Two essential tools for sellers are the Search Catalog Performance Data and the Search Query Performance Data. Both datasets offer a roadmap to Amazon’s search algorithm.
By pairing metrics like Brand Share, Purchase Rate, and Shipping Speed with competitor insights, you can Refine PPC campaigns, Optimize listings for high-intent queries, and Anticipate buyer needs (e.g., fast shipping for urgent queries).
Get automated, code free access to Amazon SQP data directly from Openbridge:
- Amazon Search Query Performance Reports | Code-free, fully-automated Amazon Search Query Performance Reports pipelines to supercharge tools like Looker, Tableau, & Power BI
- Amazon Search Query Performance & Search Catalog Performance | Openbridge Help Center
Why Your Amazon Sales Funnel Needs the Search Query Performance and Search Catalog Data
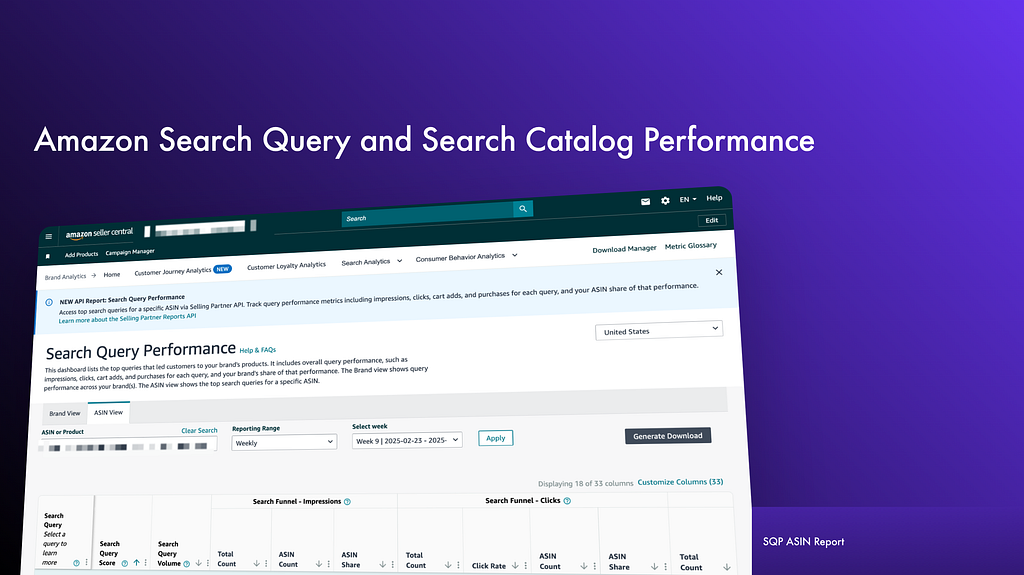
If your Amazon sales are stagnating or customers are abandoning their journey, the Search Query Performance (SQP) and Search Catalog Performance (SCP), launched Q1 2025 in the Selling Partner API, are your secret weapons.
These tools decode how shoppers search for and buy products, offering granular insights into:
- Search Query Behavior: What terms customers use.
- Funnel Drop-Offs: Where they lose interest (clicks, cart adds, purchases).
- Competitor Benchmarks: How your ASINs stack up against rivals.
This guide dives into every metric, strategy, and hidden detail to transform raw data into actionable wins.
What Types of Search Query Performance and Search Catalog Performance Data Is Available?
Search Query Volume
- Definition: Total searches for a term (e.g., “water bottle” = 100 searches/month).
- Use Case: Prioritize high-volume, low-competition terms for PPC campaigns.
Impressions
- Total Count: Products displayed for a query (e.g., 1,000 products for “yoga mat”).
- Brand/ASIN Count: Your products shown (e.g., 200 impressions for your brand).
- Brand/ASIN Share**: Your % of total impressions (e.g., 20% brand share).
- Fine Print: Includes below-the-fold and refined search impressions (e.g., “yoga mat + eco-friendly”).
Clicks
- Click-Through Rate (CTR)**: Clicks ÷ Search Volume (e.g., 10 clicks ÷ 100 searches = 10% CTR).
- Shipping Speed Impact**: How often same-day/1-day/2-day delivery options drive clicks.
- Price Context: Median price of clicked ASINs (excludes taxes/coupons).
Cart Adds
- Cart Add Rate: Cart adds ÷ Clicks (e.g., 5 cart adds ÷ 10 clicks = 50%).
- Abandonment Clues: High cart adds but low purchases? Check shipping costs or checkout friction.
Purchases
- Purchase Rate: Purchases ÷ Search Volume (e.g., 2 purchases ÷ 100 searches = 2%).
- Brand Share: Your % of total purchases (e.g., 30% share = 30 of 100 buys).
- Attribution Window: Only counts purchases within 24 hours of search (delayed buys aren’t tracked).
Search Query Performance (SQP) Metrics
This dataset dives deeper into shopper searches, providing insights directly tied to ASIN level customer queries.
Search Query Score
- Ranking of queries based on ASIN impressions and clicks.
- Helps prioritize important search terms.
Query Volume
- Number of times a query was searched, counting multiple searches within a single customer session.
- Reflects search behavior and potential product visibility.
Shipping Speed & Price Metrics
- Includes the same shipping-speed metrics (Same-Day, 1D, 2D) and their impacts on query performance.
- Median Price metrics reflect the ASIN price at the time of impression for the query.
Brand-Level Metrics
- Brand Count: Total impressions, clicks, cart adds, and purchases for the brand’s products.
- Brand Share: The proportion of the brand’s performance compared to all brands for a given query.
ASIN-Level Metrics
- ASIN Count and Share metrics indicate how individual products perform relative to all search results.
Important Metrics to Monitor
- Click Rate (CTR): Engagement level with your brand’s listings.
- Cart Add Rate: Measures strong purchase intent (Cart Adds divided by Query Volume).
- Conversion Rate (Purchase Rate): Efficiency of converting clicks into actual purchases.
Purchase Rate Calculation
- Indicates successful customer transitions from clicks to purchases.
- Counts only purchases originating directly from search results within 24 hours.
Search Catalog Performance Dashboard: The SQP’s Perfect Partner
While SQP focuses on search terms, the Search Catalog Dashboard zooms into ASIN-level metrics:
- Impressions: How often your ASIN appears organically.
- Attribution Rules: Only counts actions from search results (excludes widgets/external traffic).
- Sales vs. Search Traffic Sales: Compare total sales (all sources) vs. search-driven sales to gauge channel effectiveness.
Search Catalog Performance Metrics
This information focuses specifically on how your products perform within Amazon search results, offering insights about how often and how effectively customers discover, click, add products to carts, and ultimately purchase.
Metrics such as Same Day Shipping Speed, 1D, and 2D Shipping Speeds are incorrect for specific dates (03/31/23 and 04/01/23), affecting minor reporting accuracy for specific periods in 2023 (Weeks 9 & 13, March, April, Q1, and Q2).
Product Title
- Represents your product’s title in search results (limited initially to 50 characters).
ASIN ID and Category
- Combines the Amazon Standard Identification Number (ASIN) and product category.
- ASIN is unique within a marketplace.
- Categories help contextualize the product (e.g., “Health and Personal Care”).
Shipping Speeds
- Same-Day Shipping: Products purchased, processed, packaged, and delivered within 24 hours. Critical for evaluating how quickly shipping impacts product performance.
- 1-Day (1D) Shipping: Next-day delivery allows sellers extra time to organize and package orders carefully.
- 2-Day (2D) Shipping: Two-day delivery speed, crucial for understanding slower but still rapid shipping impacts compared to same-day and 1D.
Median Price
- Median price of ASINs at the time of search impressions.
- Purchase price may vary due to coupons, shipping, discounts, and more.
- Helps evaluate if price influences impressions, clicks, cart adds, and purchases.
Putting SQP and SCP Together: Understanding the Search Funnel
The search funnel illustrates product interactions from initial impression to final purchase.
Impressions
- Total views from the search results page, excluding widgets.
- Includes organic and sponsored products, refinements, and pages actively viewed by customers.
Clicks & Click Rate (CTR)
- Clicks represent detail page views from search results.
- Click Rate (CTR) measures engagement by the ratio of clicks to impressions (e.g., 3% CTR if 300 clicks from 10,000 impressions).
- No universal “good” CTR — depends on product and device type.
Cart Adds
- Counted only when originating from search results.
- Indicates customer intent toward purchasing a product.
Purchases
- Measures completed sales originating from search within 24 hours.
- Excludes sales from widgets or external sources.
- Counts purchases regardless of cancellations or returns.
Search Funnel — Purchase Metrics
- Includes only transactions initiated and completed within 24 hours from search queries.
- Helps sellers understand product conversion and customer intent from clicks to purchases.
Advanced Strategies to Maximize the SQP
Fix Funnel Leaks with Brand Share Analysis
- Low Click Share: Weak titles/imagery. Test high-resolution images and keyword-rich titles.
- Low Cart Add Share: Poor product descriptions. Use A+ Content to highlight USPs.
- Low Purchase Share: Price sensitivity. Run promotions or bundle deals.
Optimize Shipping Speed for Conversions
- Queries with high “Same-Day Shipping” clicks indicate urgency (e.g., “last-minute gifts”). Partner with Amazon FBA for faster fulfillment.
Reverse-Engineer Amazon’s Algorithm
- Search Query Score: Amazon ranks queries by impressions, clicks, cart adds, and purchases. Target high-score terms with Sponsored Brands ads.
Common Pitfalls & Pro Tips
- Data Mismatches: SQP data won’t match Seller Central sales reports due to attribution rules. Use both for holistic insights.
- Shipping Speed Metrics: Propagated from impression time (e.g., if a product had 1-day shipping during the click but changed later, the metric still reflects 1-day).
- Median Price vs. Purchase Price: Median excludes coupons/taxes, but purchase price includes them — explain price discrepancies to customers proactively.
Getting Started with Amazon Search Query Performance Reports Automation
Ditch the messy, manual reporting for Amazon Search Query Performance Reports. Automated data feeds guide data-driven decision-making to improve off-Amazon digital marketing campaigns.
Openbridge will unify and deliver SQP data to data lakes or warehouses like Redshift, Google BigQuery, Snowflake, Azure Data Lake, and Amazon Athena, giving you a single source of truth. This unified data can turbocharge reporting and analytics tools like Google Data Studio, Tableau, Microsoft Power BI, Looker, Amazon QuickSight, SAP, Alteryx, dbt, Azure Data Factory, and Qlik Sense.
>> Get a 30-day free trial to try Amazon Search Query Performance Reports automation. <<
References
Automating Search Query Performance & Search Catalog Performance Data was originally published in Openbridge on Medium, where people are continuing the conversation by highlighting and responding to this story.
from Openbridge - Medium https://ift.tt/3Zlfkip
via IFTTT