Demystifying the Amazon Buy Box: What Sellers Need to Know

The Amazon Featured Offer (formerly Buy Box) explained and how to tap into your buy box reporting data!

Amazon has grown to become the go-to platform for both buyers and sellers. Its vast user base offers sellers unmatched visibility, but with great potential comes great competition. Amidst this competition, one feature has emerged as a game-changer for sellers — the Featured Offer formerly known as the “Buy Box”.

Per Amazon;

Buy Box is the former term for what is now the Featured Offer in the Amazon store. This automated component recommends products to aid the online shopping experience.

For most of this post, we will refer to the Featured Offer as the “Buy Box” given that Amazon still references it in reports and documentation.

Before diving deep into strategies and their significance, let’s first understand the basics. We will also cover how to tap into first-party Amazon data that supplies critical performance data on the buy box.

What is the Featured Offer or Amazon Buy Box?

When someone asks, “What is a buy box?” on Amazon, it refers to that privileged space on an Amazon product listing where customers can click directly to add items to their shopping carts. It’s not just a simple “Add to Cart” button; it’s the gateway to a sale.

While multiple sellers might offer the same product, not everyone gets this prime real estate. Only one seller “wins” this spot at a given time, and that’s where the term “buy box wins” comes into play.

But what is the meaning of “buy box wins” on Amazon? In essence, it’s the number of times a particular seller’s product is the default option in the Buy Box. Considering the vast number of purchases made directly through this box, you can see why understanding and optimizing for it is crucial for sellers.

How Does the Buy Box Work?

You might be thinking, “What are buy box wins based on?”. The answer lies in Amazon’s sophisticated algorithm. The Buy Box isn’t awarded merely based on the lowest price; it considers several factors. Per Amazon, these can include:

  1. Price: While not the only factor, competitive pricing can increase your chances of securing the Buy Box.
  2. Seller Rating: Amazon trusts sellers with better ratings. A high seller rating, derived from customer reviews and feedback, can boost your Buy Box eligibility.
  3. Shipping: Fast and reliable shipping is a significant determinant. Amazon Prime sellers or those using Fulfillment by Amazon (FBA) often have an edge.
  4. Order Defect Rate: Fewer order issues (like cancellations and returns) can make you a favorite for the Buy Box.
  5. Availability: Keeping items consistently in stock ensures you remain a contender.

The Meaning of ‘Buy Box Wins’ on Amazon

The term “winning the buy box” on Amazon essentially refers to the frequency with which your product is the default option in the Buy Box. For instance, if a customer lands on a product page and your product is displayed in the Buy Box, you’ve just had a “Buy Box win”.

For sellers, buy-box wins translate directly to sales. Studies indicate that most Amazon sales come now from the Buy Box, emphasizing its importance. Moreover, with the rise of mobile shopping, where screen real estate is limited, the Buy Box assumes even greater significance.

Strategies for Winning the Buy Box

Now that we’ve covered “what is the buy box” on Amazon and its significance let’s focus on how to increase your chances of winning it:

  1. Optimize Your Price: While the lowest price doesn’t guarantee a win, staying competitive does matter. Consider using automated repricing tools that adjust your product prices in real time based on the competition.
  2. Improve Seller Performance: Regularly monitor metrics like order defect rate, cancellation rate, and late shipment rate. Strive for excellence in these areas to enhance your Buy Box eligibility.
  3. Offer Prime Shipping: If feasible, enroll in Amazon’s FBA program. Not only does it provide logistical support, but FBA sellers also often have an advantage in Buy Box placements.
  4. Maintain Stock Levels: Regularly review your inventory levels. Running out of stock can lose you the Buy Box and harm your seller rating.
  5. Gather Reviews: Encourage satisfied customers to leave positive feedback. A robust seller rating can significantly influence Buy Box wins.

Debunking Common Myths About the Amazon Buy Box

As the buy box wins remain a focal point for Amazon sellers, various myths and misconceptions have inevitably arisen. These myths often lead sellers astray, making them focus on the wrong strategies or disheartened. Let’s delve deeper into some of these prevalent myths, debunking them and shedding light on the reality.

“The Lowest Price Always Wins”

Myth: Many sellers believe that the surefire way to secure the Buy Box is by offering the product at the lowest price.

Reality: While price is a crucial factor in the Buy Box algorithm, it’s far from the only one. Amazon’s primary goal is to ensure a stellar customer experience. Thus, they consider multiple factors, of which price is just one.

For instance, if two sellers offer a product at similar prices, but one has consistently better reviews and a history of timely deliveries, the latter is more likely to win the Buy Box. Amazon recognizes that a marginally higher price can often be justified by better service, faster shipping, or superior product quality.

Strategy: Sellers should aim for a balanced approach instead of engaging in a relentless race to the bottom with prices. Staying competitive with pricing is essential to maintaining high-quality service and vital seller metrics.

“New Sellers Can’t Win the Buy Box”

Myth: A common belief is that the Buy Box is reserved for seasoned sellers on Amazon, with newcomers having little to no chance of gaining this coveted spot.

Reality: While it’s true that established sellers with a consistent track record have an edge, Amazon’s algorithm isn’t biased against new sellers. What matters most are the performance metrics. If a new seller can demonstrate excellence in order fulfillment, customer feedback, and product availability, they stand a good chance of winning the Buy Box. Amazon’s primary concern is the customer’s experience, not the duration a seller has been on the platform.

Strategy: New sellers should focus on building a solid foundation. This includes ensuring accurate product listings, prompt customer service, reliable shipping, and actively seeking customer feedback. Over time, even if they haven’t been on the platform for long, their performance metrics can position them favorably for Buy Box consideration.

Winning the buy box: Use Amazon Data!

The Amazon Buy Box, though shrouded in some mystery, isn’t as enigmatic as many believe. Sellers can focus on tangible, impactful strategies that genuinely influence their Buy Box eligibility.

To accomplish this, it’s essential to approach the Buy Box with a combination of data-driven insights and a commitment to offering outstanding customer experiences.

Does Amazon share the buy box data? Yes!

Sellers can immediately check out the Amazon Detail Page Sales and Traffic Business Reports in their Seller Central Business Reports section.

This report offers insights into each product’s Buy Box winning percentage (child ASIN). It breaks down the number of times a product was viewed when it held the Buy Box versus the total number of times it was considered. Having the buy box percentage data directly from Amazon is critical. This information can help sellers understand which products are performing well in the Buy Box and which might need attention.

Another example is in FBA Inventory Reports. You can see the featured offer price per ASIN for your Inventory.(SeeGET_FBA_INVENTORY_PLANNING_DATA).

What about Vendors? Amazon Vendors also have direct access to a collection of data feeds;

In addition, Vendors have access to supporting data for brand, traffic, and ads-related performance data that feed into featured offer detemrinations:

For example, in the Vendor Real-time Inventory data, the metrics reflects when Amazon shopper notices the product available in the Buy Box as Ships and Sold by Amazon (vendors) or Ships from Amazon (FBA seller), that quantity is reflected in this metric. In a near real-time context, reflecting what shoppers notice allows vendors and FBA sellers to tailor their activities accordingly.

Understanding this data will provide you immediate insight into ASIN level activity.

See this post from Amazon for more details on how this Vendor data works and how it varies from other Vendor Reports.

Getting Started with the Amazon API automation

Unifying and owning your Buy Box or Featured Offer data data allows you to build a view of sales over time, understand buyer behavior more intensely, or trend monthly traffic patterns. Data-driven insights mean your sales funnel will be full, your content strategy aligned, and your traffic potential will be optimized.

If you are looking to automate and unify your Amazon data, Openbridge offers no-code, fully automated data pipelines;

With data automation, you can understand and optimize your digital marketing strategy and efficiently grow your existing customer base while identifying ideal customers that drive revenue. Informed decisions are within reach with automation for all of the critical types of reports you have come to rely on.

Getting Started — Automate Today

Interested in tapping into your Buy Box or Featured Offer data? Get started so you can create data-driven insights for order reports, product page performance, gross product sales, and much more.

Try our code-free, full-automated Amazon Selling Partner API data integration today with a 30-day free trial!


Demystifying the Amazon Buy Box: What Sellers Need to Know was originally published in Openbridge on Medium, where people are continuing the conversation by highlighting and responding to this story.


from Openbridge - Medium https://ift.tt/Rcv81za
via IFTTT

Amazon Fulfilled Inventory Report: An In-Depth Guide

Near real-time snapshot of their inventory within Amazon’s fulfillment centers

The Amazon Fulfilled Inventory Report is a crucial tool that provides sellers with a real-time snapshot of their inventory within Amazon’s fulfillment centers. This report is invaluable for ensuring that products are in stock and readily available to meet customer demand.

The post will cover into the Amazon Fulfilled Inventory report, exploring its field definitions, report scheduling, auttomation, and how to make the most of this valuable resource.

Understanding the Amazon Fulfilled Inventory Report

The Amazon Fulfilled Inventory report serves as a near real-time inventory status update. It reflects the quantity of your products stored in Amazon’s fulfillment centers at the moment the report is generated. However, it’s important to note that due to the dynamic nature of e-commerce, this report can quickly become outdated as customers make purchases.

Why the Amazon Fulfilled Inventory Report Matters

As an Amazon seller, keeping an eye on your inventory is essential. Here’s why the Amazon Fulfilled Inventory report matters:

  1. Inventory Oversight: The report provides insights into your saleable inventory, allowing you to monitor stock levels effectively.
  2. Reconciliation: To ensure accuracy, you can use this report to reconcile your inventory with your own records.
  3. Automation: For efficient inventory management, consider using Amazon’s inventory APIs available through the Amazon Marketplace Web Service.

Field Definitions in the Report

To fully comprehend the Amazon Fulfilled Inventory report, it’s essential to understand its key field definitions:

| Download Header          | Description                                              | Example     |
|--------------------------|----------------------------------------------------------|-------------|
| seller-sku | Unique seller-assigned identifier for your products | 154844 |
| fulfillment-channel-sku | Amazon's unique identifier for products in fulfillment | X00000E5TX |
| ASIN | Amazon's unique identifier for items | 0312306180 |
| condition-type | The condition of your inventory | New |
| warehouse-condition-code | Code assigned in Amazon's fulfillment center | SELLABLE |
| quantity-available | Quantity of the product available for purchase | 15 |

Accessing the Report: Manual or Automated

Two primary methods for accessing this report; Automated or manual downloads. Downloading occurs in your account interface. Automation taps into the Amazon Selling Partner API (Amazon SP-API) to automate report processing and storage in a cloud warehouse or data lake.

Manual Report Access via Seller Central:

  1. Login: First, sellers need to log into their Amazon Seller Central account.
  2. Navigate to Reports: Usually found in the main navigation bar, this section contains various sales, inventory, and performance reports.
  3. Locate the ‘ Amazon Fulfilled Inventory Report’: Within the Reports section, sellers can find and select the specific “ Amazon Fulfilled Inventory Report”.
  4. Download: Once the report has been generated, there will typically be an option to download it. The report is often available in different formats like .csv or .txt.
  5. Import to BI Tool: If you’re using tools like Power BI, Tableau, or Looker, you can then manually upload this downloaded file to visualize and analyze the data.

Note: Manual downloads are more time-consuming and may not be ideal for frequent and up-to-date data analytics.

Go Faster With Selling Partner API Report Automation

The Amazon Selling Partner API (SP-API) allows for direct, automated access to Amazon Fulfilled Inventory data, making it easier for businesses to integrate this data into their systems.

Openbridge allows Amazon sellers to streamline the data management process by automating Amazon Fulfilled Inventory Report API integrations and storing data in a unified data warehouse. This service saves sellers time manually downloading reports and reduces errors in merging and tracking downloaded reports.

Automation eliminates manual download wrangling, ensuring up-to-date and accurate data straight from Amazon APIs. With data stored in a unified data warehouse like Amazon Redshift, Amazon Redshift Spectrum, Google BigQuery, Snowflake, Azure Data Lake, and Amazon Athena, you can combine different Amazon reports is easier to gain a more holistic view of the business.

This fast and unified data access enabled teams to utilize their preferred analytical tools, such as Google Data Studio, Tableau, Microsoft Power BI, Looker, or Amazon Quicksight, for various purposes, including machine learning, business intelligence, data modeling, and online analytical processing.

Maximizing the Amazon Fulfilled Inventory Report’s Potential

To make the most of this report, consider these best practices:

  1. Regular Monitoring: Use API automation to unify reports and regularly review them to stay informed about your inventory’s status.
  2. Inventory Reconciliation: Compare the report data with your own records to ensure accuracy and address any discrepancies promptly.
  3. Automation Benefits: Cross reference to automated API inventory data to assist with inventory management, saving time and reducing errors.
  4. Stock Optimization: Make informed decisions about restocking and product availability based on the report’s insights.

The Amazon Fulfilled Inventory report is a powerful tool that empowers Amazon sellers to manage their inventory efficiently. By understanding its field definitions, scheduling reports, and implementing best practices, sellers can ensure that their products are readily available to meet customer demand. Stay on top of your inventory, reconcile data regularly, and embrace automation to thrive.

Get Started Automating Amazon Fulfilled Inventory Report Data for — For Free.

Ditch the messy, manual report downloads for code-free automation access to the new Amazon’s Amazon Fulfilled Inventory data. Openbridge integration is a code-free, fully-automated API integration. By providing Sellers with access to high-velocity data, they can accelerate the speed at which the team can gain valuable insights that deliver data-driven growth and profit.

Sign up for a 30-day free trial of our Amazon API code-free automation.

Frequently Asked Questions (FAQs)

What should I do if there are discrepancies between the report and my inventory records?

Investigate discrepancies promptly to avoid potential issues with customer orders. Reconcile the data and update your inventory records accordingly.

Can I use the Amazon Fulfilled Inventory report for forecasting future inventory needs?

While the report provides valuable insights, it’s primarily a snapshot of current inventory. To forecast future needs, consider historical data and sales trends.

Can I access historical Amazon Fulfilled Inventory reports?

Amazon typically retains historical reports for a limited time. It’s advisable to automate data exports via the API if you need access to historical data.

Remember that effectively managing your inventory is essential for a successful e-commerce business, and the Amazon Fulfilled Inventory report is a valuable tool in achieving this goal.


Amazon Fulfilled Inventory Report: An In-Depth Guide was originally published in Openbridge on Medium, where people are continuing the conversation by highlighting and responding to this story.


from Openbridge - Medium https://ift.tt/6Cmpwbl
via IFTTT

Airbyte Cloud: The Ultimate Guide to Navigating its Open Source Landscape

Running Airbyte in leading cloud computing environments

Everything you need to know about Airbyte Cloud, from features, benefits, gotchas to running open source data pipelines.

What is Airbyte Cloud?

Harnessing the potential of the Airbyte Cloud means tapping into a wide range of capabilities, such as data ingestion from various data sources, efficient data movement, and ensuring synchronized data streams that flow seamlessly into data lakes or other destinations.

With an increasing number of Airbyte source and destination connectors, integrating data from CRM systems, analytics tools, dashboards, and other platforms, opportunities to unlock data expand and operations can become streamlined.

Airbyte, Open Source, Cloud

While all of Airbyte does not fall under the definition of open source data integration platform, various source and destination connectors do. The resulting blend of open source and proprietary components in its platform, make it essential for users to differentiate between the two. Especially for those keen on harnessing the open source elements of Airbyte in cloud environments like AWS, Google Cloud, and Azure, distinguishing these components becomes crucial.

As a result, when referencing “Airbyte Cloud,” this post refers to deploying only the genuine open-source components of Airbyte within cloud computing environments such as AWS, Google Cloud, and Azure.

Airbyte Cloud Connectors

A pivotal feature of an open source Airbyte Cloud runtime for a data pipeline is the “connector .”

Airbyte has two classes of connectors: data source and destination. These connector acts as a bridge, facilitating data movement between various platforms. When combined with running the service in the cloud, these connectors ensure data integrations across multiple sources, effectively addressing the problem of data silos.

Airbyte Cloud Sources

The term “data source” in the context of Airbyte Cloud refers to the original location or platform from which data is extracted. This could be a CRM system, web analytics, databases, or any other platform where raw data is generated and stored.

These data sources are vital entry points in the data integration pipelines of the Airbyte Cloud. Before the data can be refined, synchronized, and sent to its destination, it must be efficiently and securely pulled from these sources. Ensuring compatibility and seamless integration with diverse data sources is a foundational aspect of robust data integration solutions.

Airbyte Cloud destinations

The term “destination” in the context of Airbyte Cloud refers to where integrated data will land. This could be a specific cloud database, data warehouse, data lake, or another storage platform. The cloud ensures scalability and accessibility to these destinations. Additionally, data integration pipelines in the Airbyte Cloud can process and refine data, making it ready for analytics or other business operations.

Navigating the Nuances: Deciphering Airbyte’s Complex Open-Source Landscape

Earlier we touched on the license considerations for running Airbyte. The advantages of flexible, long-tail open source connectors are clear, it’s also essential for a data team to be aware Airbyte is only partially under open source licensing.

Airbyte, while often hailed for its open source appeal, isn’t entirely an open source solution. Drawing on the Open Source Initiative terminology, many parts of Airbyte could be categorized under a “fauxpen” source license. See Fauxpen source is bad for business and The SSPL is Not an Open Source License.

This means that while Airbyte might appear fully open source, but the licenses it functions under are not. It’s a nuanced distinction, but critical. This is especially true for businesses or data teams prioritizing open source solutions for transparency, customization, or compliance.

Benefits of using Airbyte Cloud in open source mode

Despite license landmines, there are opportunities to focus on using only the open source parts of Airbyte. This is the Airbyte connectors for sources and destinations.

When deploying Airbyte in cloud platforms, leveraging its genuine open-source connectors — both for data sources and destinations — can capitalize on the native compute and storage power of these platforms.

  • Transparency and Trust: By focusing solely on the open-source components of Airbyte, users can have complete transparency into the software’s code. This fosters trust, as no hidden functionalities or proprietary clauses could affect data processing or integration.
  • Flexibility and Customization: Open-source components typically allow for greater flexibility. Users can modify, tweak, or build upon the existing code to suit their specific requirements, ensuring their data integration process is tailor-made for their needs.
  • Cost-Effective: Leveraging open-source elements often leads to cost savings. Users can avoid potential licensing fees associated with proprietary software. Furthermore, running these components in cloud environments can lead to further cost optimizations based on scalable cloud pricing models.
  • Community Support: Open-source solutions often benefit from a large, active community. This means any challenges or issues can be addressed collectively, leading to faster resolutions and a wealth of community-driven enhancements and plugins.
  • Seamless Cloud Integration: By deploying the open-source elements of Airbyte in leading cloud platforms, users can harness the inherent scalability, security, and robustness of these environments. It ensures efficient data integration and capitalizes on cloud providers’ cutting-edge features.

Running Airbyte in a cloud environment can provide a robust open source data integration solution for various data teams.

How to use Airbyte Cloud

To run Airbyte in the cloud, there are a few options.

  1. Manually assemble Airbyte open source resources.
  2. Use the Meltano framework and Airbyte wrappers.
  3. Leverage the native, open source Airbridge Airbyte Docker service.

Compared to Meltano or Airbridge, option 1 can be overly complex and time-consuming. Assembling all of the necessary components to run the open source parts of Airbyte can be a difficult and time-consuming process, given the documentation for using only Airbyte source and destination connectors is lacking.

As a result, if you are already a Meltano user, this would be a practical path. However, if you are new to Airbyte and not a Meltano user, Airbridge would be the quickest, open source path for all other users.

To get started with Airbridge, the fastest way to get up and running is by hopping over to the Github project page:

GitHub - openbridge/airbridge

Once Airbridge is installed, you can select a source and destination, configure them, and run a command to initiate a sync like this:

poetry run main -i airbyte/source-stripe -w airbyte/destination-s3 -s /airbridge/env/stripe-source-config.json -d /airbridge/env/s3-destination-config.json -c /airbridge/env/stripe-catalog.json -o /airbridge/tmp/mydataoutput/

For details on Meltano, see their docs.

Airbyte Cloud monitoring and alerting

Monitoring, alerting, and security are also integral aspects of running Airbyte in your cloud platform of choice. With monitoring and alerting features, stakeholders are instantly notified of discrepancies or interruptions in the data stream.

Example: Monitoring and Alerting with AWS CloudWatch

When deploying Airbyte’s open-source components in a cloud environment like AWS, integrating with services such as CloudWatch can significantly enhance these monitoring and alerting capabilities.

AWS CloudWatch offers real-time monitoring of resources and applications that you run on AWS. When Airbyte is hosted on an EC2 instance or within a container in AWS, CloudWatch can continuously monitor the performance and health of the service. Through custom CloudWatch dashboards, executives and IT teams can visually inspect metrics like CPU utilization, data throughput, or any custom metrics provided by Airbyte. These metrics can be invaluable in understanding the system’s performance and ensuring optimal operations.

Incorporating Alerting Mechanisms

One of CloudWatch’s standout features is its alerting mechanism. Setting specific thresholds on selected metrics allows users to be instantly alerted if something goes amiss. For instance, if Airbyte’s data processing crosses a certain threshold or a sudden drop in data transmission, CloudWatch can send a notification. This immediate feedback is crucial to act swiftly, ensuring minimal disruption.

Moreover, these alerts can be channeled through various means depending on the severity and audience. Simple notifications might be sent through emails or SMS. At the same time, critical alerts might integrate with services like AWS SNS (Simple Notification Service) or AWS Lambda to trigger automatic corrective actions.

Using AWS CloudWatch with Airbyte in the cloud offers a robust, comprehensive monitoring and alerting solution. It ensures that businesses can stay ahead of potential issues, maintaining the integrity and efficiency of their data integration processes.

Airbyte Cloud security and compliance

The essence of cloud data integration lies in efficiency and ensuring that data is transferred, processed, and stored securely. Continuing with our AWS examples, various services, and best practices can be harnessed to bolster Airbyte Cloud’s security and compliance.

Strengthening Security with AWS Services:

  • Identity and Access Management (IAM): Using AWS IAM, you can control who can access your Airbyte deployment on AWS. You can ensure that only authorized personnel can access specific data or functionalities within Airbyte by setting up granular permissions and roles.
  • Virtual Private Cloud (VPC): With AWS VPC, you can define a virtual network within which your Airbyte instances operate. This allows you to control inbound and outbound traffic, ensuring a more secure environment for your data integration processes.
  • AWS Key Management Service (KMS): If Airbyte is storing sensitive data or credentials, AWS KMS can encrypt this information. KMS provides centralized control over cryptographic keys, ensuring data at rest is secured.
  • AWS Shield & WAF: To protect against web exploits, AWS offers services like Shield, which provides DDoS protection, and WAF, a web application firewall that helps protect your Airbyte deployments from common web exploits.

AWS operates with a shared responsibility model. While AWS manages the security of the cloud — like physical security, instance isolation, and network traffic protection — the customer is responsible for security in the cloud — like data encryption, network configurations, and access management. However, AWS makes compliance easier:

  • AWS Artifact: This portal provides access to AWS compliance reports. Depending on the region and nature of your business, AWS Artifact can offer insights into how AWS services align with global compliance standards, assisting Airbyte users in meeting their compliance requirements.
  • Regular Audits: AWS undergoes regular third-party audits to meet the latest compliance standards. If your business falls under regulations like GDPR, HIPAA, or ISO, AWS provides frameworks and guidelines to help you stay compliant.
  • Data Residency: With AWS’s vast global infrastructure, businesses using Airbyte can ensure data is stored in specific regions, aligning with data residency regulations.

Leveraging these AWS tools and services in tandem with best practices will be instrumental in fortifying the security and compliance of Airbyte Cloud deployments. As with all cloud ventures, continuous monitoring, regular audits, and staying abreast of the latest security recommendations remain paramount.

While we focuses on AWS services, Google Cloud and Azure support similar capabilities detailed for monitoring, alerts, and security.

Getting Started With Airbyte Cloud

When running an Airbyte Cloud runtime service, combined with the resources of major cloud platforms like AWS, Google Cloud, or Azure, it offers compelling options for the diverse needs of modern businesses, ranging from data ingestion to analytics, syncing to data lakes, and so much more.

Here are the Airbyte alternatives we suggest exploring:

Running true open source Airbyte data pipelines, powered by cloud computing, brings together data from multiple sources and ensures the data pipelines are efficient, flexible, and scalable. This can be an attractive option for data engineering, data science, technology, or BI data teams needing bespoke connectors to sync raw data long tail data sources.

Frequently Asked Questions

What is Airbyte Cloud?

Harnessing the potential of the Airbyte Cloud means tapping into a wide range of capabilities, such as data ingestion from various data sources, efficient data movement, and ensuring synchronized data streams that flow seamlessly into data lakes or other destinations.

What are Airbyte connectors and destination connectors?

With the increasing number of data connectors like Airbyte connectors and destination connectors, integrating data from CRM systems, analytics tools, dashboards, and other platforms becomes streamlined.

Are there any challenges associated with using Airbyte?

While the advantages of flexible, long-tail open source connectors are clear, it’s also essential for a data team to be aware of potential challenges like integration compatibility and cloud security concerns and understand best practices to optimize the platform’s performance.

Is Airbyte entirely open source?

Airbyte is only partially under open source licensing. While all of Airbyte does not fall under the definition of an open source data integration platform; many source and destination connectors do.

Many parts of Airbyte could be categorized under a “fauxpen” source license. While they might appear open and free to use, restrictions or proprietary clauses might be embedded. When referencing “Airbyte Cloud,” this post refers to deploying only the genuine open-source components of Airbyte within cloud computing environments like AWS, Google, or Azure.

Is Airbyte free?

Airbyte has both open-source components and proprietary elements. While open-source components might be free to use, they could have “fauxpen” source licensing, which means there might be restrictions. Leveraging only the open-source parts can often lead to cost savings, avoiding potential licensing fees associated with proprietary software.

What are the Airbyte alternatives open source?

Open source Airbridge Airbyte Docker service, or Meltano, is an alternative to deploying Airbyte in the cloud. Also, check out the Airbyte Github repo to take a deep dive into the project.


Airbyte Cloud: The Ultimate Guide to Navigating its Open Source Landscape was originally published in Openbridge on Medium, where people are continuing the conversation by highlighting and responding to this story.


from Openbridge - Medium https://ift.tt/2ci3HNC
via IFTTT

Manage FBA Inventory Report: A Comprehensive Overview

Manage FBA Inventory Report

Key components of the FBA Inventory Report to optimize performance and growth.

Efficient inventory management is the backbone of successful e-commerce operations, and Amazon provides sellers with valuable tools to achieve this, including the Manage FBA Inventory report.

This report offers essential information about your listings, product conditions, quantities, and dispositions, making it an indispensable resource for day-to-day inventory management tasks. In this comprehensive guide, we will explore the Manage FBA Inventory report in depth, including field definitions, report scheduling, and how to harness its power for effective inventory control.

Understanding the Manage FBA Inventory Report

The Manage FBA Inventory report provides sellers with vital data on their products within Amazon’s Fulfillment by Amazon (FBA) network. It covers listing details, product conditions, quantities, and more. It’s important to note that archived listings are not included in this report.

Why the Manage FBA Inventory Report Matters

This report is instrumental for several reasons:

  1. Inventory Oversight: It offers detailed insights into your inventory, helping you monitor and manage it effectively.
  2. Product Information: You can access crucial information such as SKUs, ASINs, product names, and conditions.
  3. Pricing Insights: Your current selling prices are available, allowing you to make informed pricing decisions.
  4. Fulfillment Methods: It indicates whether a product is listed for fulfillment by you or by Amazon (Fulfillment by Amazon — FBA).

Field Definitions in the Report

To fully grasp the Manage FBA Inventory report, let’s explore its key field definitions:

| Field Name                 | Description                                                      | Example          |
|----------------------------|------------------------------------------------------------------|------------------|
| sku | Unique product identifier (letters or numbers) assigned by you. | AB-8675309 |
| fnsku | Unique identifier assigned by Amazon for FBA products. | X00000E5TX |
| asin | Amazon's unique identifier for items. | B003ZYF3LO |
| product-name | The title of your product. | Toysmith Nonstick Bakeware Set |
| condition | The condition of your product (e.g., New or Used - Good). | New |
| your-price | Your current selling price. | 10.25 |
| mfn-listing-exists | "Yes" indicates if the product is listed for fulfillment by you. | Yes |
| mfn-fulfillable-quantity | Quantity in your fulfillment network ready for picking and shipping. | 10 |
| afn-listing-exists | "Yes" indicates if the item is listed for Fulfillment by Amazon (FBA). | Yes |
| afn-warehouse-quantity | Number of units for an SKU in fulfillment centers (processed). | 35 |
| afn-fulfillable-quantity | Number of units for an SKU in fulfillment centers (pickable). | 20 |
| afn-unsellable-quantity | Number of units for an SKU in fulfillment centers (unsellable). | 5 |
| afn-reserved-quantity | Number of units for an SKU in fulfillment centers (reserved). | 10 |
| afn-total-quantity | Total units for an SKU in a shipment or fulfillment centers. | 55 |
| per-unit-volume | Volume in cubic feet of one unit (to the nearest 1/100 of an inch). | 0.23 |
| afn-inbound-working-quantity | Units in a shipment to fulfillment centers that you've notified Amazon about. | 10 |
| afn-inbound-shipped-quantity | Units in a shipment to fulfillment centers with tracking numbers provided. | 5 |
| afn-inbound-receiving-quantity | Units in a shipment not yet received at a fulfillment center, part of a shipment with some units already received. | 5 |
| afn-researching-quantity | Units being researched at Amazon's fulfillment centers. | 1 |
| afn-future-supply-buyable | Units available for customers while inventory is on its way through In-Stock Head Start. | 10 |
| afn-reserved-future-supply | Units purchased by customers while inventory is on its way through In-Stock Head Start. | 5 |

Report Scheduling for Effective Management

To optimize your inventory management, you can schedule the generation of the Manage FBA Inventory report. Here’s how to do it:

Creating a Scheduled Report

  • On the Manage FBA Inventory report page, navigate to the “Schedule” tab.
  • From the drop-down menus, select the desired report frequency (e.g., daily, weekly), a future start date, and the preferred report format.
  • Click “Create scheduled report.”

Your schedule will be listed in the “My schedule” section of the page. Note that you can only create one schedule per report.

Depending on your chosen frequency, the report will be generated around midnight in your store’s time zone. Each scheduled report will be stored in the “Scheduled reports” section, with a maximum limit of 30 reports, listed in chronological order.

If you require an immediate report, you can download it directly from the “Download” tab. Please note that manually requested reports won’t be listed in the “Scheduled reports” section.

Go Faster With Selling Partner API Manage FBA Inventory Automation

The Amazon Selling Partner API (SP-API) allows for direct, automated access to Manage FBA Inventory data, making it easier for businesses to integrate this data into their systems.

Openbridge allows Amazon sellers to streamline the data management process by automating Manage FBA Inventory report integrations and storing data in a unified data warehouse. This service saves sellers time manually downloading reports and reduces errors in merging and tracking downloaded reports.

Automation eliminates manual download wrangling, ensuring up-to-date and accurate data straight from the AmazonFBA Inventory API. With data stored in a unified data warehouse like Amazon Redshift, Amazon Redshift Spectrum, Google BigQuery, Snowflake, Azure Data Lake, and Amazon Athena, you can combine different Amazon reports is easier to gain a more holistic view of the business.

This fast and unified data access enables teams to utilize their preferred analytical tools, such as Google Data Studio, Tableau, Microsoft Power BI, Looker, or Amazon Quicksight, for various purposes, including machine learning, business intelligence, data modeling, and online analytical processing.

Maximizing the Manage FBA Inventory Report’s Potential

To make the most of this report, consider these best practices:

  1. Regular Monitoring: Set up scheduled reports and routinely review them to keep a close eye on your inventory.
  2. Pricing Strategy: Use pricing insights from the report to adjust your selling prices competitively.
  3. Inventory Allocation: Leverage data on fulfillable and reserved quantities to allocate inventory effectively.
  4. In-Stock Head Start: Make use of data on future supply buyable and reserved future supply to manage inventory availability.

The Manage FBA Inventory report is a vital tool for Amazon sellers, offering detailed insights into their inventory, product conditions, and more. By understanding its field definitions, scheduling reports, and implementing best practices, sellers can maintain control over their inventory and optimize their e-commerce operations.

Get Started Automating Manage FBA Inventory Data for — For Free.

Ditch the messy, manual report downloads for code-free automation access to the new Amazon’s Manage FBA Inventory data. Openbridge integration is a code-free, fully-automated API integration. By providing Sellers with access to high-velocity data, they can accelerate the speed at which the team can gain valuable insights that deliver data-driven growth and profit.

Sign up for a 30-day free trial of our Amazon API code-free automation.

Frequently Asked Questions (FAQs)

How often should I schedule Manage FBA Inventory reports?

The scheduling frequency should align with your inventory management needs. Consider factors like product turnover and sales velocity when choosing a frequency.

Can I use the Manage FBA Inventory report for pricing decisions?

-Yes, you can access pricing information in the report to make informed pricing decisions and stay competitive.

How can I best utilize the data on future supply buyable and reserved future supply?

-This data can help you manage inventory availability and plan for future sales. Adjust your listings and promotions accordingly.

What actions should I take if I notice discrepancies in the report data?

Investigate discrepancies promptly, reconcile your data, and take necessary actions to ensure accurate inventory management.

Can I access historical Manage FBA Inventory reports?

Amazon typically retains historical reports for a limited time. Consider downloading and archiving reports for reference if needed in the future.


Manage FBA Inventory Report: A Comprehensive Overview was originally published in Openbridge on Medium, where people are continuing the conversation by highlighting and responding to this story.


from Openbridge - Medium https://ift.tt/OYCUtbs
via IFTTT

Amazon All Orders Report: A Comprehensive Guide

Amazon All Orders Reports

Introduction to the Amazon Seller Central All Orders Report

Amazon has long been at the forefront of e-commerce innovation, providing sellers with tools to enhance their sales strategy. Among the most valuable of these tools is the Amazon All Orders Report data. In this guide, we’ll delve into its intricacies, offering insights and practical applications for both novices and seasoned sellers.

Overview and Purpose

The Amazon All Orders Report is a crucial tool for sellers, offering a wealth of information related to their sales activities. This report combines data on order status, sales channels, and item details, ensuring sellers have a holistic understanding of their business operations.

What can you do with this data?

  1. Growth Pattern Analysis:
    Study the report to identify consistent growth patterns. Are there specific times of the year where certain products outperform others? By understanding these patterns, you can adjust marketing efforts and promotions to capitalize on predictable sales surges.
  2. Inventory Optimization:
    Analyze the report to understand which products are selling fast and which ones are lagging. Based on these insights, adjust your inventory levels. Holding the right stock ensures you can meet demand during high sales periods, while also reducing costs associated with overstocking slow-moving items.
  3. Leverage Advanced Analytics:
    Integrate the All Orders Report with advanced analytical tools to derive deeper insights. Visual representations like trend lines, bar graphs, and pie charts can highlight sales channels’ performance, product preferences, and even regional sales trends. This can guide targeted marketing and sales strategies.
  4. Data Ownership and Backups:
    Regularly export and back up your All Orders Report data. Owning your data ensures you can access historical information, even beyond Amazon’s retention period. This long-term data is invaluable for year-over-year growth comparisons and long-term strategic planning.
  5. Engage in Predictive Analysis:
    Use the report’s data in conjunction with forecasting tools to predict future sales and inventory needs. By understanding what’s likely to come, you can pre-emptively adjust inventory levels, plan promotions, or even explore potential new product additions.

Accessing the Report: Manual or Automated

Two primary methods for accessing this report; Automated or manual downloads. Downloading occurs in your account interface. Automation taps into the Amazon Selling Partner API (Amazon SP-API) to automate report processing and storage in a cloud warehouse or data lake.

Manual Access via Seller Central:

  1. Login: First, sellers need to log into their Amazon Seller Central account.
  2. Navigate to Reports: Usually found in the main navigation bar, this section contains various sales, inventory, and performance reports.
  3. Locate the ‘All Orders Report’: Within the Reports section, sellers can find and select the specific “All Orders Report”.
  4. Select Date Range: Amazon allows sellers to pull reports based on specific date ranges. Choose the desired range.
  5. Download: Once the report has been generated, there will typically be an option to download it. The report is often available in different formats like .csv or .txt.
  6. Import to BI Tool: If you’re using tools like Power BI, Tableau, or Looker, you can then manually upload this downloaded file to visualize and analyze the data.

Note: Manual downloads are more time-consuming and may not be ideal for frequent and up-to-date data analytics.

Go Faster With Selling Partner API Report Automation

The Amazon Selling Partner API (SP-API) allows for direct, automated access to Amazon seller data, making it easier for businesses to integrate this data into their systems.

Openbridge allows Amazon sellers to streamline the data management process by automating All Orders API integrations and storing data in a unified data warehouse. This service saves sellers time manually downloading reports and reduces errors in merging and tracking downloaded reports.

Automation eliminates manual download wrangling, ensuring up-to-date and accurate data straight from Amazon APIs. With data stored in a unified data warehouse like Amazon Redshift, Amazon Redshift Spectrum, Google BigQuery, Snowflake, Azure Data Lake, and Amazon Athena, you can combine different Amazon reports is easier to gain a more holistic view of the business.

This fast and unified data access enabled teams to utilize their preferred analytical tools, such as Google Data Studio, Tableau, Microsoft Power BI, Looker, or Amazon Quicksight, for various purposes, including machine learning, business intelligence, data modeling, and online analytical processing.

Types Of Reports

The report’s data can be tailored based on two primary criteria:

  • By order date: This captures the data of orders placed within a designated timeframe.
  • By last update: This includes data on orders that have undergone recent changes, such as updates or edits, within a specified period.

Limitations: What’s Not Offered

Before diving into the data, it’s worth noting that an online view of the All Orders Report isn’t available. This can be a drawback for those used to real-time analytics but ensures data privacy and accuracy.

Deciphering Field Definitions

The table provides a detailed set of field definitions for Amazon’s “All Orders” data.

  • Identification Fields: This includes unique order IDs from both Amazon and the seller, signifying each transaction.
  • Date Fields: There are fields indicating when the order was placed and its most recent update.
  • Status and Channels: Information regarding the current status of orders, fulfillment methods, and channels through which orders were placed is provided.
  • Product and Pricing: Product-related fields capture the name, unique identifiers (SKU and ASIN), and pricing details. This includes the base price, tax, shipping costs, promotions, and any associated gift wrapping charges.
  • Shipping Details: Information on both the default and actual shipping addresses are provided in a detailed manner, capturing name, address lines, city, state, country, and postal codes.
  • Taxation and Licensing: There’s data on the tax collection model and the Import One Stop Shop (IOSS) number which is crucial for sellers shipping to the EU.
  • Promotions: The table also offers fields defining promotional discounts on items and shipping.
  • Licensing: Some fields point towards professional licenses, suggesting that certain items might require buyer credentials (like medical equipment).

This table is designed to capture a comprehensive view of any order placed on Amazon, from basic transactional details to shipping and promotions, ensuring sellers have a complete picture of their sales.

| Field Name                            | Description                                                           | Example                                      |
|---------------------------------------|-----------------------------------------------------------------------|----------------------------------------------|
| amazon-order-id | Amazon's unique, displayable identifier for an order | 058-3718414-0463502 or S01-3718414-0463502 |
| merchant order-id | A unique identifier optionally supplied for the order by the seller | my-order |
| purchase-date | The date the order was placed | 2003-07-14T18:53:56+ 00 :00 |
| last-updated-date | The date of the most recent order update | 2003-07-14T18:53:56+ 00 :00 |
| order-status | Current status of the customer order | Complete |
| fulfillment-channel | Indicates how the order was fulfilled, via Amazon (AFN) or Merchant (MFN) | AFN or MFN |
| sales-channel | Channel through which the order was purchased | Amazon.com |
| order-channel | The sub channel through which a sale was made for CBA/WBA orders | Phone |
| ship-service-level | An enumerated value that determines the type of fulfillment service that the buyer expects the seller to use | Standard |
| product-name | The short title for the product | Chocolate Truffles |
| sku | A seller-defined unique identifier for a product | HarryPotter |
| asin | Amazon inventory ID | B000WON1Z0 |
| item-status | Current status of this item within the order | Shipped |
| quantity | The number of this item that were purchased | 1 |
| currency | The currency used for the purchase | USD |
| item-price | The amount the buyer paid for the item | 15 |
| item-tax | The amount the buyer paid for item tax | 0 |
| shipping-price | The amount the buyer paid for shipping | 4.99 |
| shipping-tax | The amount the buyer paid for shipping tax | 0 |
| gift-wrap-price | The amount the buyer paid for gift wrap | 4.99 |
| gift-wrap-tax | The amount the buyer paid for gift wrap tax | 0 |
| item-promotion-discount | Total of all promotion discounts applied to the order item | -6.5 |
| ship-promotion-discount | Promotion discount applied to shipping | -4.25 |
| ship-city | The city of a standard address | Los Angeles |
| ship-state | The state or region of a standard address | California |
| ship-postal-code | The postal (zip) code of a standard address | 90039 |
| ship-country | ISO 3166 standard two-letter country code | US |
| promotion-ids | List of all item promotions applied to this order item | - |
| Licensee name | Name of the individual on the professional license | Jane Doe |
| License number | Professional license number provided by the customer | 12345 |
| License state | State where professional license number is valid | California |
| License expiration date | Professional license expiration date provided by the customer | 2017-08-20 |
| default-ship-from-address-name | The warehouse or business name used in the Seller Central account shipping settings or template | John Doe |
| default-ship-from-address field-1 | First line of "Default Ship From" address | 4270 Cedar Ave |
| default-ship-from-address-field-2 | Second line of "Default Ship From" address | Optional |
| default-ship-from-address-field-3 | Third line of "Default Ship From" address | Optional |
| default-ship-from-address-city | City of "Default Ship From" address | SUMNER PARK |
| default-ship-from-address-state | State of "Default Ship From" address | FL |
| default-ship-from-address-country | Country of "Default Ship From" address | US |
| default-ship-from-address-postal-code | ZIP code or postal code of "Default Ship From" address | 32091 |
| actual-ship-from-address-name | The warehouse or business name that is chosen while confirming the order | John Doe |
| actual-ship-from-address-1 | First line of "Actual Ship From" address | 4270 Cedar Ave |
| actual-ship-from-address-field-2 | Second line of "Actual Ship From" address | Optional |
| actual-ship-from-address-field-3 | Third line of "Actual Ship From" address | Optional |
| actual-ship-from-address-city | City of "Actual Ship From" address | SUMNER PARK |
| actual-ship-from-address-state | State of "Actual Ship From" address | FL |
| actual-ship-from-address-country | Country of "Actual Ship From" address | US |
| actual-ship-from-address-postal-code | ZIP code or postal code of "Actual Ship From" address | 32091 |
| tax-collection-model | Tax Collection Model or Tax Collection Responsible Party | MarketplaceFacilitator |
| IOSS Number | Import One Stop Shop (IOSS) number for the store | IMXXXYYYYYYZ |

Critical Fields Explained

The report boasts a comprehensive set of fields, each offering a unique piece of the puzzle. Fields like the amazon-order-id offer a unique identifier for an order, whereas the product-name provides insights into the specific products that are selling, for instance, “Chocolate Truffles”.

Practical Examples

For a clearer understanding, consider a seller aiming to determine the popularity of “Chocolate Truffles.” By filtering data using the product-name field, they can quickly ascertain the product’s sales trajectory.

FBA vs. Seller-Fulfilled Orders

Not all Amazon orders are made equal. The platform differentiates between orders fulfilled directly by Amazon (FBA) and those managed by the sellers themselves. This report captures data from both these streams, allowing sellers to track and measure demand variations and performance across both channels.

Utilizing the Report

With fields like order-status and item-status, sellers can effectively monitor and manage order progress, ensuring timely deliveries and satisfied customers. For businesses operating on multiple channels, understanding where orders are coming from is essential. The fulfillment-channel and sales-channel fields provide this clarity, helping businesses refine their multi-channel strategies.

Here are a collection SQL queries based on the provided field definitions for the All Orders data:

Find total sales per product:

SELECT product-name, SUM(item-price) as total_sales
FROM orders
GROUP BY product-name
ORDER BY total_sales DESC;

Determine the total number of orders shipped via each fulfillment channel:

SELECT fulfillment-channel, COUNT(amazon-order-id) as total_orders
FROM orders
GROUP BY fulfillment-channel;

Identify the top 10 selling products based on quantity:

SELECT product-name, SUM(quantity) as total_sold
FROM orders
GROUP BY product-name
ORDER BY total_sold DESC
LIMIT 10;

Calculate the average item price per sales channel:

SELECT sales-channel, AVG(item-price) as average_price
FROM orders
GROUP BY sales-channel;

Find orders that have not been shipped (assuming statuses other than ‘Shipped’ imply not shipped):**


SELECT amazon-order-id, order-status
FROM orders
WHERE item-status <> ‘Shipped’;

Determine total shipping cost per city:

SELECT ship-city, SUM(shipping-price) as total_shipping_cost
FROM orders
GROUP BY ship-city
ORDER BY total_shipping_cost DESC;

Find the top 5 states based on total sales

SELECT ship-state, SUM(item-price) as total_sales
FROM orders
GROUP BY ship-state
ORDER BY total_sales DESC
LIMIT 5;

These queries can provide valuable insights into sales performance, product popularity, shipping costs, and more. They’re a great starting point for sellers looking to optimize their operations based on historical data.

What about Daily queries?

Daily time series queries are particularly valuable for identifying short-term trends or patterns. Here are some daily time series SQL queries based on the “All Orders” data:

Total Sales per Day:

SELECT
DATE(purchase-date) as sales_date,
SUM(item-price) as total_sales
FROM orders
GROUP BY sales_date
ORDER BY sales_date;

Daily Quantity Sold of a Specific Product (e.g., “Chocolate Truffles”):

SELECT
DATE(purchase-date) as sales_date,
SUM(quantity) as total_quantity_sold
FROM orders
WHERE product-name = ‘Chocolate Truffles’
GROUP BY sales_date
ORDER BY sales_date;

Average Daily Shipping Costs:

SELECT
DATE(purchase-date) as sales_date,
AVG(shipping-price) as average_shipping_cost
FROM orders
GROUP BY sales_date
ORDER BY sales_date;

Number of Orders per Day by Fulfillment Channel:

SELECT
DATE(purchase-date) as sales_date,
fulfillment-channel,
COUNT(amazon-order-id) as total_orders
FROM orders
GROUP BY sales_date, fulfillment-channel
ORDER BY sales_date, fulfillment-channel;

Total Daily Sales for Each Sales Channel:

SELECT
DATE(purchase-date) as sales_date,
sales-channel,
SUM(item-price) as total_sales
FROM orders
GROUP BY sales_date, sales-channel
ORDER BY sales_date, sales-channel;

Daily Tax Collection from Item Tax and Shipping Tax:

SELECT
DATE(purchase-date) as sales_date,
SUM(item-tax) + SUM(shipping-tax) as total_tax_collected
FROM orders
GROUP BY sales_date
ORDER BY sales_date;

By analyzing the results of these daily time series queries, sellers can identify day-to-day fluctuations, determine the cause of any spikes or drops in sales or other metrics, and strategize to optimize operations and marketing activities.

Ensuring Customer Privacy

Customer trust is paramount. That’s why the All Orders Report deliberately excludes any customer-specific details, ensuring privacy and compliance with data protection regulations.

Additional Resources

Dive Deeper into Amazon’s Reporting Tools

The All Orders Report is just the tip of the iceberg. Sellers eager to delve deeper can explore a plethora of tools and resources on Amazon Seller Central, amplifying their e-commerce success.

Get Started Automating Amazon All Orders Data for — For Free.

Ditch the messy, manual report downloads for code-free automation access to the new Amazon’s All Orders data. Openbridge integration is a code-free, fully-automated API integration. By providing Sellers with access to high-velocity data, they can accelerate the speed at which the team can gain valuable insights that deliver data-driven growth and profit.

Sign up for a 30-day free trial of our Amazon API code-free automation.

Frequently Asked Questions (FAQs)

What is the primary purpose of the All Orders Report?

It offers sellers a detailed insight into their sales activities, encompassing both FBA and self-fulfilled orders.

Is there an online view available for this report?

No, currently Amazon does not offer an online view for the All Orders Report.

Does the report contain any customer-specific information?

To ensure utmost data privacy, the report does not include any customer-identifying information.

How can the report aid in inventory management?

By analyzing sales trends and order statuses, sellers can optimize their inventory, reducing stockouts and overstock scenarios.

Are there any future enhancements expected for this report?

Given Amazon’s commitment to seller success, we can expect regular updates and enhancements to the report in the future.


Amazon All Orders Report: A Comprehensive Guide was originally published in Openbridge on Medium, where people are continuing the conversation by highlighting and responding to this story.


from Openbridge - Medium https://ift.tt/hvrPt5M
via IFTTT

Discover Airbridge: Configuration-Driven Airbyte Cloud Data Integration Pipelines

Quickly run configuration driven Airbyte connectors via Airbridge, an open source, Docker based service.

Earlier this year the Meltano community released the tap-airbyte-wrapper. This is what open source is all about! The Meltano Airbyte wrapper takes advantage of Docker, translating output from a source into a Singer-compatible format. This is a perfect fit for someone invested in the Meltano ecosystem.

While we were inspired by the effort, there was one hitch for us. We wanted something that works for data-curious spelunkers, data engineers, and developers so they can explore configuration-driven data pipelines without relying on Meltano.

Keeping things lean and simple, with a focus on the true open source aspects of Airbyte, was important to us. As a result, we built Airbridge as a pure Python+Docker integration tool that orchestrates data ingestion pipelines from Airbyte data sources like Stripe, Facebook, or Google to Airbyte data destination connectors like a S3 data lake, Redshift, Snowflake, or BigQuery.

Project Framework Approach

While Airbridge shares a common core (Python, Docker…) with Meltano, unlike the Meltano wrapper, Airbridge does not require using the Meltano SDK. Also, unlike Meltano tranforming Airbyte output to the Singer spec, Airbridge retains the raw data source output in an unmodified state. Nothing against Singer formatted outputs, we just wanted to keep the Airbyte output in raw form.

The following are a collection of the guiding principles we set forth at the start of the work effort;

🐳 Use Docker-Driven Workflows: Airbridge must be Docker-centric methodology that capitalizes on ready-to-go source and destination Docker images accessible via Airbyte Docker Hub. This facilitates a streamlined setup procedure, directing focus where needed most: crafting seamless data flows.

🐍 Leverage Python: Anchor the work in the well-traveled and standard-based Python framework. Airbridge offers a clean, swift, and modular data flow, fostering easy setup and modification.

🔗 Seamless Airbyte Sources and Destinations Integration: Airbridge must orchestrate the essential resources to seamlessly sync source connectors to data destinations.

🔄 Automated State Management for Hassle-Free Operations: Provide the ability for automated state tracking for each run. Use simple yet potent solution to ensure uniformity and dependability in tasks, curbing errors, and conserving resource time.

🔓 Open-Source and Community-Driven: Airbridge must be released under the MIT license.

📦 No Bloat, Just Efficiency: No unnecessary wrappers; Airbridge should concentrate on delivering a lean, efficient tool that caters to the core needs of developers, fostering seamless data integration pipelines.

Getting Started: Where can I deploy Airbridge?

Deploy it in the cloud, locally, or somewhere in between. Setting up Airbridge in your cloud computing environment — be it AWS, Azure, or Google Cloud, is a breeze.

Before you begin, ensure that you have the following prerequisites installed on your system:

  1. Python: Verify or install it using the command: python --version
  2. Git: Verify or install it using the command: git --version
  3. Docker: Verify or install it using the command: docker --version

If any of the above software is not installed, please install them before proceeding.

Step 1: Create a local project directory and navigate into it:

mkdir airbridge_project && cd airbridge_project 

Step 2: Clone the project from Github and navigate into the project directory:

git clone https://github.com/openbridge/airbridge.git && cd airbridge

Step 3: Set up a virtual environment (optional but recommended):

python -m venv venv
source venv/bin/activate # On Unix or MacOS
# .\venv\Scripts\activate # On Windows

Step 4: Install the project dependencies. There is a pyproject.toml file, so you can use poetry to manage the dependencies. First, install poetry using the following command:

pip install poetry

Now, install the project dependencies using poetry:

poetry install

Step 5: Start the Docker daemon if it is not already running. You can do this via the Docker desktop application or by using the following command, depending on your OS:

systemctl start docker # You might need sudo privileges

Step 6: Once you have your Airbyte source and destination configs ready, you can run Airbridge. Here is an example command using Stripe as a source and Amazon S3 as a destination:

poetry run main -i airbyte/source-stripe -w airbyte/destination-s3 -s /airbridge/env/stripe-source-config.json -d /airbridge/env/s3-destination-config.json -c /airbridge/env/stripe-catalog.json -o /airbridge/tmp/mydataoutput/

Explanation of the command parameters:

  • -i: Input source (Stripe in this case)
  • -w: Destination (Amazon S3 in this case)
  • -s: Path to the source configuration file
  • -d: Path to the destination configuration file
  • -c: Path to the catalog configuration file
  • -o: Output directory

Comprehensive Airbyte install guides are at your disposal, guiding you to get your Airbyte connector and data destinations up and running. Visit the project here:

GitHub - openbridge/airbridge

License

Airbridge is released under the MIT license. Access the code and kickstart your efforts.

Community

For enthusiasts eager to delve deeper, the Airbridge and Airbyte GitHub spaces are where developers can discover a treasure trove of resources, contribute to the projects, or build knowledge from the community. It’s a platform where your expertise, novice or veteran, finds appreciation and acknowledgment.

As with most efforts like these, we cordially invite you to partake in a collaborative expedition as the effort moves forward. Community perspectives, feedback, and involvement are crucial in sculpting a tool that aligns with an open source projects aspirations.

Frequently Asked Questions (FAQs)

What does Airbyte do?

Airbyte is a data integration platform that facilitates the extraction, transformation, and loading (ETL) of data from various sources to destinations of your choice. It helps automate the data pipeline creation process, allowing businesses and developers to focus on deriving insights from the data rather than grappling with data sync challenges.

How does Airbyte work?

Airbyte operates through a series of connectors that enable pipelines between different data sources and destinations. These connectors are pre-configured to work with specific platforms, simplifying the data extraction and loading process. Airbyte also offers a graphical user interface (UI) where users can configure and manage their data pipelines easily. Under the hood, it utilizes Docker containers to manage and isolate different data connectors, ensuring a robust and scalable data solution.

What is Airbyte used for?

Airbyte is primarily used for data integration and ETL processes. It allows organizations and developers to create data pipelines easily, facilitating data movement from various sources, like databases, APIs, and flat files, to different destinations, including data warehouses, data lakes, or other business intelligence tools. This helps consolidate data in a centralized location, making it easier to analyze and derive valuable business insights.

Is Airbyte open-source?

Yes, parts of Airbyte are open-source. Some features of Airbyte operate under the MIT license, allowing users to use, modify, and distribute the software freely. Airbridge focuses on those parts of Airbyte that are open source under the MIT license. Open source fosters a community where developers can contribute to the project, enhancing its functionality and robustness. Airbridge source code is publicly available on GitHub, encouraging transparency and continuous improvement.

Airbridge will not support any parts of Airbyte that fall under, as the Open Source Initiative says, a “fauxpen” source license.

Does it require the Airbyte UI?

Using the Airbyte UI is not needed. The Airbyte UI offers a user-friendly environment where you can configure data connectors, set up data pipelines, and monitor the status of your data integrations. However, Airbridge allows configuring and managing data pipelines without using the UI for users comfortable with command-line operations.

What is the Airbyte Pricing for running open source?

Airbyte Cloud costs $2.50 per credit to run. If you replicate 100M rows of data per month, Airbyte will cost over $14,000 for the year. However, if you run Airbyte in a self-managed context, your costs are infrastructure and management time. You just need to make sure you are compliant with Airbyte licenses.


Discover Airbridge: Configuration-Driven Airbyte Cloud Data Integration Pipelines was originally published in Openbridge on Medium, where people are continuing the conversation by highlighting and responding to this story.


from Openbridge - Medium https://ift.tt/kPW5n6u
via IFTTT

Introduction to Amazon return report data analysis

Amazon FBA returns data analysis examples

You can perform various types of analysis based on Amazon returns report data. We detail various examples and opportunities for performing data analysis of returns reports.

For our test dataset, our sample data set is relatively small, with just a few days of return data.

  • The dataset contains 46,586 entries.
  • There are 13 columns in the dataset: ‘return-date’, ‘order-id’, ‘sku’, ‘asin’, ‘fnsku’, ‘product-name’, ‘quantity’, ‘fulfillment-center-id’, ‘detailed-disposition’, ‘reason’, ‘status’, ‘license-plate-number’, and ‘customer-comments’.
  • Most columns are of object (string) type, except ‘quantity’ which is an integer.
  • The ‘customer-comments’ column has some missing values (NaN), with 13,013 non-null entries out of 46,586 total entries.
  • All returned items have a quantity of 1, as indicated by the minimum, maximum, and average values of the ‘quantity’ column.
  • The ‘sku’, ‘asin’, ‘fnsku’, and ‘product-name’ columns have several unique entries, indicating a wide variety of products in the dataset.
  • The ‘return-date’ column has 28 unique entries, suggesting that the dataset spans a period of 28 days.
  • The ‘fulfillment-center-id’ column has 170 unique entries, indicating that the dataset includes returns processed by 170 fulfillment centers.
  • The ‘detailed-disposition’ column, which describes the condition of the returned items, has 5 unique entries.
  • The ‘reason’ column, which contains the reason for return as indicated by the customer, has 26 unique entries.
  • The ‘status’ column, which describes the status of the customer return, has 2 unique entries.
  • The ‘license-plate-number’ column, which uniquely identifies specific items, has 46,538 unique entries, almost one for each entry in the dataset.

Below are some example SQL queries that could be used to explore the dataset.

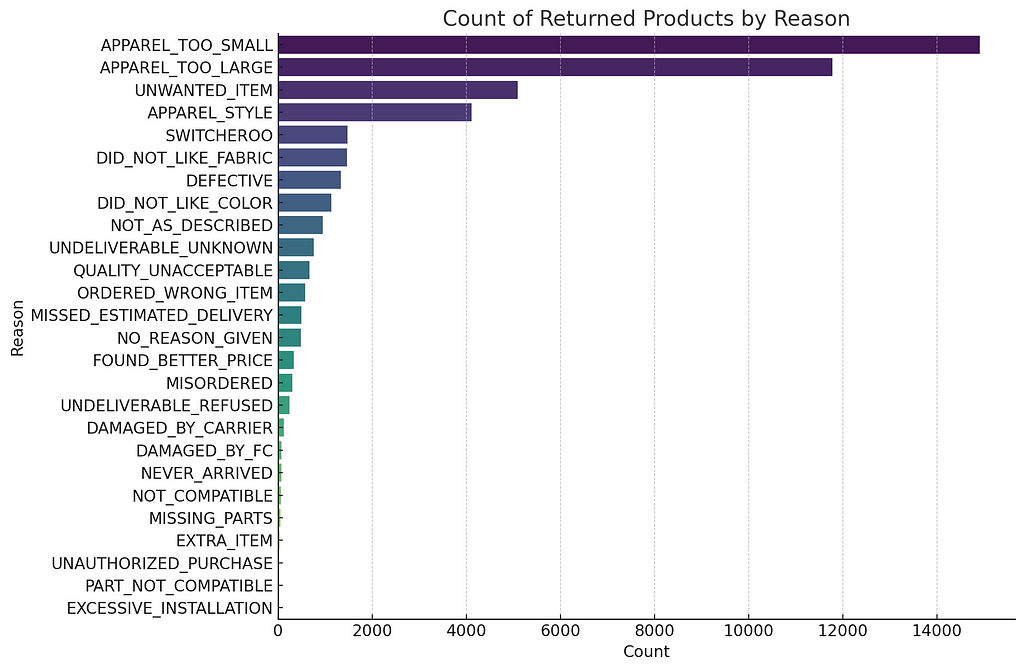
Count of returned products by reason:

This can help you understand the primary reasons customers are returning products.

  • SELECT reason, COUNT(*) AS count FROM Returns GROUP BY reason ORDER BY count DESC;

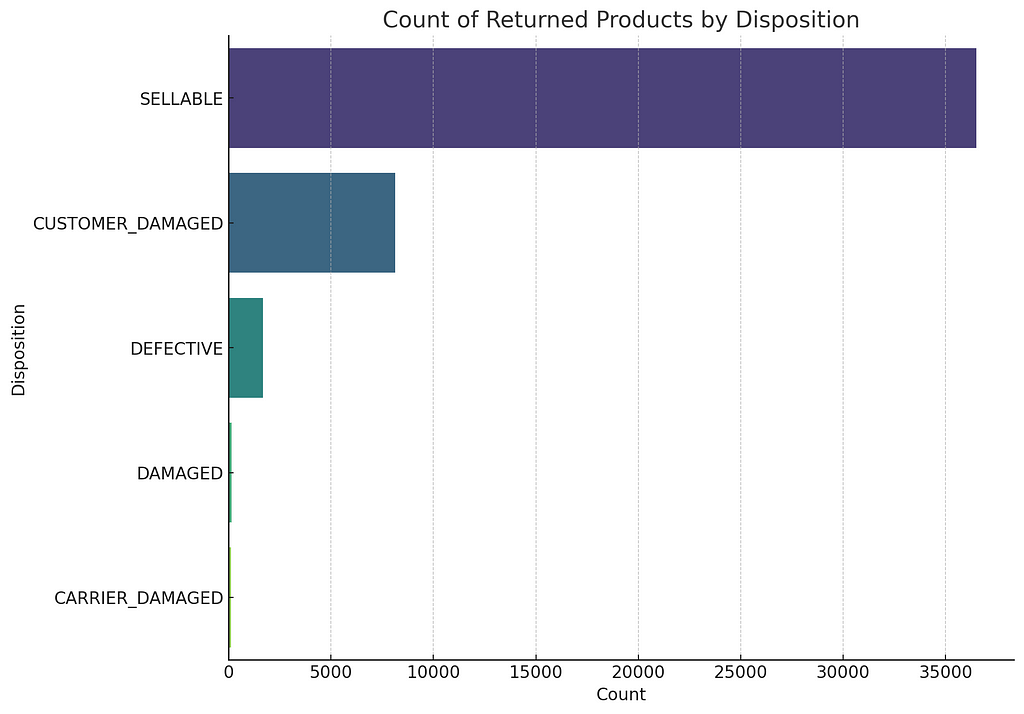
Count of returned products by disposition (condition):

This can help you understand the condition of products when they are returned.

  • SELECT detailed_disposition AS disposition, COUNT(*) AS count FROM Returns GROUP BY detailed_disposition ORDER BY count DESC;

The total quantity of each product returned:

This can help you understand which products are returned the most frequently.

  • SELECT product_name, SUM(quantity) AS total_quantity FROM Returns GROUP BY product_name ORDER BY total_quantity DESC;

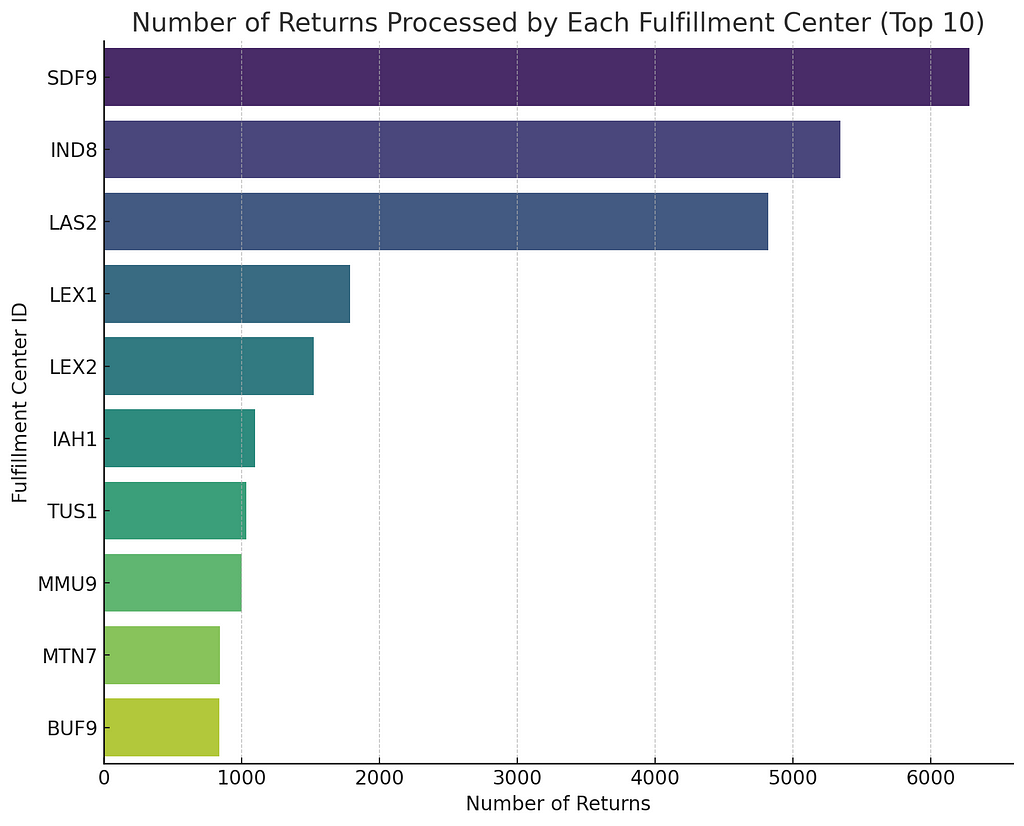
Number of returns processed by each fulfillment center:

This can help you understand if there are issues with specific fulfillment centers.

  • SELECT fulfillment_center_id AS fc, COUNT(*) AS count FROM Returns GROUP BY fulfillment_center_id ORDER BY count DESC;

Percentage of returned items that are sellable:

This can help you understand the financial impact of returns.

  • SELECT (COUNT(*) FILTER (WHERE detailed_disposition = 'SELLABLE') * 100.0 / COUNT(*)) AS sellable_percentage FROM Returns;

Average number of returned items per order:

This can help you understand if there are orders with multiple returned items.

  • SELECT AVG(quantity) AS average_returns FROM Returns;

Visualization Examples

Let’s start with the first one: Count returned products by reason. We’ll compute the counts and create a bar plot for visualization.

The bar plot above shows the count of returned products grouped by the reason for return. “APPAREL_STYLE” is the most common reason for returns, followed by “APPAREL_TOO_LARGE.”

Next, let’s examine the count of returned products by their disposition (condition)

The bar plot above shows the count of returned products by their condition (disposition). Most returned items appear in the “SELLABLE” condition, followed by “CUSTOMER_DAMAGED.”

Next, calculate the number of returns processed by each fulfillment center. Due to the potentially large number of unique centers, we will visualize the top 10 centers with the highest return counts.

The bar plot above shows the number of returns processed by each fulfillment center, focusing on the top 10 centers with the highest return counts.

Here is a word cloud based on customer comments;

Additional Analysis Opportunities

Here are additional examples of how you might visualize the data;

  1. Count of returned products by reason: A bar chart would work well here, with the reasons on the x-axis and the counts on the y-axis.
  2. Count of returned products by disposition (condition): Similarly, a bar chart would work well for this data.
  3. The total quantity of each product returned: If there are many different products, a horizontal bar chart or a pie chart is more effective in visualizing the products with the highest return quantities.
  4. Number of returns processed by each fulfillment center: A bar chart or pie chart could be used to visualize this data.
  5. Percentage of returned items that are sellable: This could be visualized using a pie chart showing the proportion of sellable vs. unsellable returns.
  6. Average number of returned items per order: A histogram could be useful here to see the distribution of the number of returned items per order.

Seamless, Code-free Rapid Retail API Automation Unleashed

Openbridge provides automated data feeds, without the need for code, to quickly deliver data directly to Amazon Redshift, Amazon Redshift Spectrum, Google BigQuery, Snowflake, Azure Data Lake, and Amazon Athena.

This fast and unified data access enabled teams to utilize their preferred analytical tools, such as Google Data Studio, Tableau, Microsoft Power BI, Looker, or Amazon Quicksight, for various purposes, including machine learning, business intelligence, data modeling, and online analytical processing.

Get Started Automating Amazon Returns Data for — For Free.

Ditch the messy, manual report downloads for code-free automation access to the new Amazon’s Return data. Openbridge integration is a code-free, fully-automated API integration. By providing Sellers with access to high-velocity data, they can accelerate the speed at which the team can gain valuable insights that deliver data-driven growth and profit.

Sign up for a 30-day free trial of our Amazon API code-free automation.


Introduction to Amazon return report data analysis was originally published in Openbridge on Medium, where people are continuing the conversation by highlighting and responding to this story.


from Openbridge - Medium https://ift.tt/9Cejbqo
via IFTTT