
How to analyze Ecommerce data with Tableau Software, including example reports
Business intelligence tools are powerful analytical tools that help businesses make better decisions and improve performance. They provide insights into data such as sales trends, customer behavior, product usage patterns, and much more. Later in this post, we show examples of how Tableau Retail + Ecommerce dashboards bring those points to life.
While a diverse collection of Business Intelligence tools such as Google Data Studio, Power BI, SAP, or Looker allow teams to build dashboards, we are focusing on Tableau Software in this post. However, the outputs and approaches detailed in this post can easily apply to those tools!
Here are the core packages of the software;
- Tableau Desktop
- Tableau Server
- Tableau Prep
- Tableau Public
- Tableau Cloud (formerly Tableau Online)
Benefits Of Tableau
Tableau is one of the most popular tools used for data visualization. It allows you to make quick visualizations and dashboards. You can use it to analyze data quickly and easily.
The following are some of the core value propositions of the software:
- Easy To Use: Tableau is easy to learn and use. You don’t need programming languages to understand how to work with Tableau. Also, there are no technical skills required to use Tableau, though a basic understanding of data and how to construct reports is important. If you know Excel, you can use Tableau.
- Data Preparation: Tableau works best when you can transform data on the fly. They provide the tools to prepare the data before starting to work with Tableau.
- User-Friendly Interface: When you start using Tableau, you feel comfortable immediately because of its simple interface.
- Customizable Dashboard: If you want to customize your dashboard according to your needs, you can do it quickly.
- Interactive Charts: With Tableau, you can interact with charts. For example, you can zoom in/out, change colors, add annotations, etc.
- Powerful Filters: You can filter your data based on multiple criteria. This feature helps you to find out what exactly you want to see.
Value Of A Tableau Ecommerce Dashboard
An Ecommerce dashboard should display Key Performance Indicators (KPIs) that the business decides are critical for driving sales performance. These KPIs allow you to see how your business is performing and where it needs improvement. As a result, a well-designed Tableau ecommerce dashboard helps your team better understand trends and patterns in your product/service offerings.
A typical dashboard would include:
- Product Performance
- Customer Experience & Journey
- Sales Analytics
- Marketing Campaign Analysis
You can often find prebuilt or customized dashboards that make the process easier. Agencies, consultants, and freelance teams have them ready to go. However, there are dashboard solutions they build that are based on customer requirements.
Tableau Ecommerce Dashboard Examples
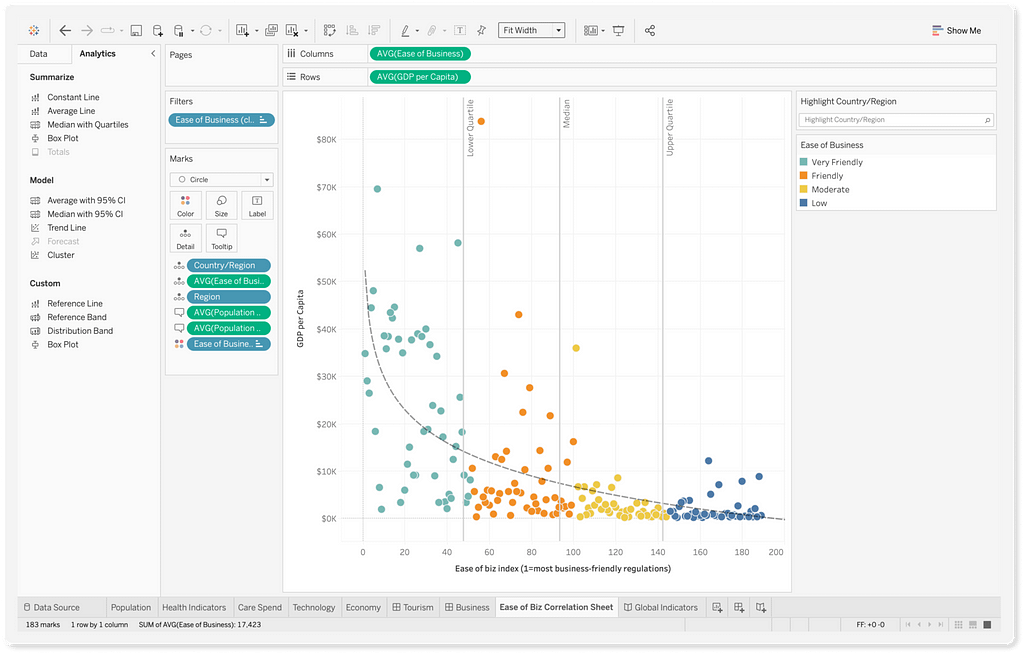
A Tableau dashboard provides a visual representation of key metrics across multiple elements of your digital marketing and retail business. In this example you can see product performance, ACOS, Ad Spend, Revenue, and other KPIs:

This is another dashboard that shows attributed revenue, ROAS, CPC, total sales, spending, units, and much more:

The couple of examples areof a Retail dashboard available as part of the Tableau accelerators;
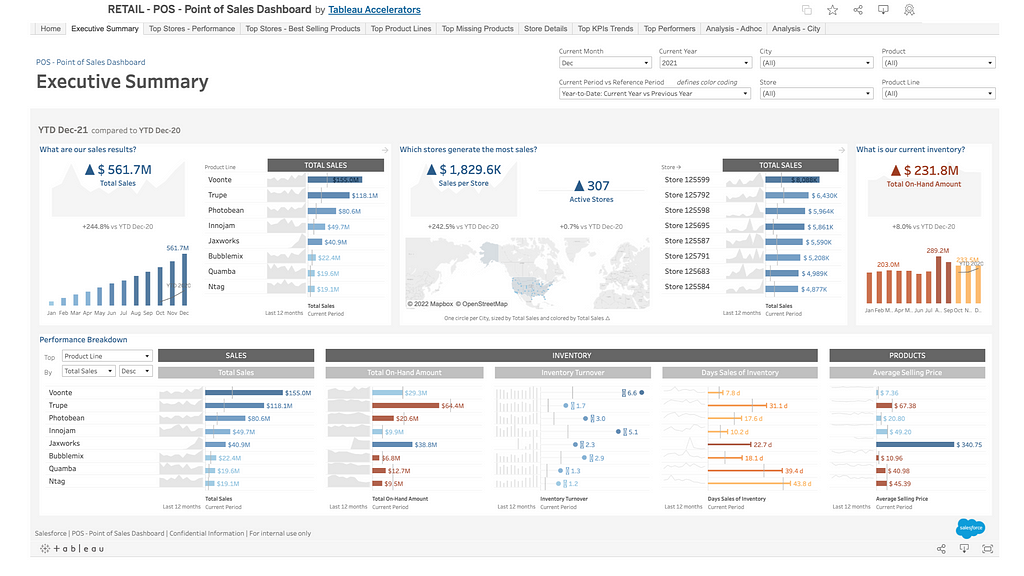
Tableau dashboards like these are great tools to monitor sales and inventory levels, identify trends, and spot potential problems. They’re also great communication tools for employees, customers, and suppliers.
Extending Your Ecommerce Tableau Dashboard
As you build confidence in your reports, you can look to extend data pipelines to your data lake or cloud data warehouse. For example, you can start to layer other data sources in your Tableau data analysis;
- Unify your data in Amazon Redshift, AWS Athena, Google BigQuery, Snowflake, or Azure Data Lake, so your marketing team, agency, or on-site business analyst can quickly get what they need in Tableau.
- Employ integration solution ready for Amazon Selling Partner, Amazon Advertising, Shopify, and Amazon Vendor Central to accelerate ecommerce dashboards in Tableau.
- With a data lake or data warehouse, consolidate marketing data from Google Ads, Facebook, Amazon Advertising, and others. This includes advertising and marketing campaigns, as well as associated marketing spend
- Create lifetime value models, customer journey analysis, or RFM reports; you can map the business objectives to the type of analysis needed.
- Extend the examples we shared above to create a robust supply chain dashboard Tableau visualizes for you or include Tableau retail dashboards that show data from a physical store.
Fueling Your Tableau Ecommerce Dashboard With Automated Data Pipelines
From basic integrations to complex integrations, the key to analytics agility, efficiency, and performance is to store data in a scalable, flexible data lake or cloud data warehouse for Tableau to consume.
Having data well-abstracted allows teams to undertake data science, machine learning, or other types of data analytics. Unifying your data across a combination of integrations, including native connectors built into Tableau, will ensure fast, flexible, and future-proof integrations as you become a data-driven retailer.
Not only do you realize the business benefits of improved insights and growth, but it also allows for actionable insight supporting business future planning and strategy efforts. Any valuable insight gained from data analytics can blunt the negative business impact of competitors and market changes.
Here are a few examples of automated data pipelines that can fuel your insights efforts:
- Tableau Shopify Integration
- Tableau Amazon Seller Central
- Tableau Amazon Advertising
- Tableau Amazon Vendor Central
Not using Tableau? Pick Another Data Science, Modeling, Or Visualization Tool!
Customizable interfaces, informative visualizations, interactive dashboards, mobile-ready reports, and a robust Tableau user community make Tableau a great BI tool for e-commerce analytics. However, while the article focuses on Tableau, you can use tools like Power BI, Google Data Studio, Looker, and others to build equally compelling e-commerce dashboards, reports, and visualizations.
For example, our early report examples could be easily translated to a Power BI Ecommerce dashboard. The point here is an Ecommerce dashboard Power BI, or Google Data Studio, specific can be created in a similar context.
Here are a few other candidates to consider;
- Google Data Studio
- Microsoft Power BI
- Looker, Amazon QuickSight
- SAP
- Alteryx
- dbt
- Azure Data Factory
- Qlik Sense
Get Started Fueling Tableau Ecommerce Dashboards With Data — For Free
Openbridge offers code-free data automation, one of the most potent tools Tableau users can tap into for Ecommerce dashboards and analysis. Automation accelerates performance and the speed at which your team can gain valuable insights to deliver data-driven growth and profit.
Sign up for a 30-day free trial of data automation for Tableau Ecommerce
Tableau Ecommerce: 5 Tips For Building Dashboards was originally published in Openbridge on Medium, where people are continuing the conversation by highlighting and responding to this story.
from Openbridge - Medium https://ift.tt/C6zsJ91
via IFTTT