Getting started with Ecommerce performance analytics using your tools for insight and optimization
Data analytics in Ecommerce can seem daunting, but it can be simplified with the right tools that support a consistent and flexible focus on performance.
There are several options these days for e-commerce analytics. For example, you can now use your tools for e-commerce insights like business intelligence, data visualization, SQL, or data science tools. Examples are Google Data Studio, Tableau, Microsoft Power BI, Looker, and Amazon Quicksight. Using tools like these for Ecommerce insights is possible because you can now unify your data to a leading data lake or cloud warehouses like Redshift, Redshift Spectrum, Google BigQuery, Snowflake, Azure Data Lake, Ahana, and Amazon Athena for a unified, analytics-ready single source of truth to fuel informed decisions on product, media, and customer demand.
As a result, there are tremendous opportunities for undertaking data-driven insights efforts.
What is Ecommerce Analytics?
Ecommerce analytics covers a broad spectrum of different types of data that reflect your customer and digital strategy. These include data on the entire customer journey, from email marketing and paid Google Ads to the actual purchase event on your preferred ecommerce platforms like Amazon or Shopify.
Ecommerce analytics aims to provide actionable insights that allow you to improve your customer experience, increase conversion rates, and ultimately grow your bottom line.
In an earlier post called Unlocking The Power Of Digital Shelf Analytics, we discussed a holistic view of this process. That post highlighted how to use data to discover new opportunities to optimize retail operations, media, and user experiences to drive sales performance.
The bottom line? Ecommerce analytics helps retailers figure out what works and doesn’t work about their user experience, operations, and marketing campaigns. As a result, Ecommerce sales analytics provides the insights needed to understand product performance so you decide on future product development and marketing strategies.
Why Undertake Data Analysis For eCommerce?
Analyzing your Ecommerce efforts helps you create better products, services, content, and user experience. The analysis leads to insights into how customers behave, including gaps and issues with the customer journeys or the user flow in purchasing products/services so they can make data-driven optimizations.
Here are a few core benefits to harnessing your data for analysis;
- Measuring the effectiveness of your marketing campaign. Analytics can help ecommerce companies measure their online sales, improve customer service, gain more omnichannel traffic, and inform holistic business decisions.
- Analyze the trends or patterns in the data so you can predict accurately. Ecommerce analytics help you to know better how your business is doing now and how it will perform in the future. This knowledge allows you to set up your business for success by ensuring that the right things are available when needed.
- You are optimizing your pricing, up-selling, and sell-through strategies. With Ecommerce analytics, you can gain insights into which products drive sales and which don’t. You can then adjust prices accordingly.
- You are personalizing individual experiences by using customer data. It’s essential to understand how customers behave when they visit your site so you can optimize your product pages and improve the buying experience for everyone.
- Use data-based insights to inform your strategy. One additional advantage of Ecommerce analytic tools is that they provide insights into what’s going on in your business and the industry at large, which gives you an idea of what might happen next and whether there are any potential risks you need to take into account.
This list is not exhaustive but reflects a few primary areas teams look to explore.
What Do You Measure In Ecommerce Analytics?
Several areas of Ecommerce analysis allow you to understand your business and its markets better.
Audience
Have you identified your target market? Who do you want to reach? What demographic groups do you want to attract? Once you’ve identified your target market, you must analyze your audience. How old are they? Where do they come from? Which social media platforms do they use? Do they read blogs? Are they interested in specific types of news stories?
These questions will help you identify who your ideal customer is.
Next, you’ll want to find out what kind of person they are. What do they value? What motivates them? What problems do they face? What issues do they care about?
By answering these questions, you’ll be able to align your product positioning that matches their needs.
Finally, you’ll want to consider the competition. Analyze your competitor’s strengths and weaknesses. What are they doing? Why are they successful? What strategies do they employ? How do you position yourself against competitors? How does your potential customer view you?
Acquisition
You can also track customer acquisition using data related to the acquisition of customers, which helps you understand where you’re losing potential customers. It’s important because you’ll learn about how your people became aware of your products and where that occurred.
- Do most of your traffic comes from social media posts? Instagram, Twitter, Facebook?
- How many website visits do you generate through email marketing?
- What does the average post convert ratio look like for your blog?
- Does paying for Google Ads, Facebook Ads, or other paid media bring in most of the people who visit your site?
This data will help you determine which marketing channel is best for your business and where to spend your time and money.
Behavior
It would be best if you also considered looking into consumer behavior data.
- Which product lines do customers buy?
- How many people visit your site but close their browsers without clicking through any pages?
- Which page do visitors usually click on first?
- Which types of marketing content get people to take action?
- What kinds of product ideas get lots of attention from people but don’t sell well?
- On average, how long do visitors stay on your site?
Are your products easy to navigate? Do your customers know where to go after viewing an item? If users leave your site without finding what they’re looking for, you might have a problem with page design, content, positioning, or images. If your customers cannot figure out what they’re looking for after visiting your site, you’ll need to make changes to improve your conversion rate.
Conversions
We’ve talked about conversions but haven’t defined exactly what they mean. These are vital questions you’re asking about conversion analytics.
- How long does it typically take for someone to become a paying customer?
- Which type of customer converts most often?
- Customers usually purchase items after just one visit to your online shop. However, they may return later if they don’t see something they want.
- Repeat purchases from customers?
- How many customers abandon shopping carts before they’re converted into paying customers?
This data is vital because it allows you to determine which discounts and deals will appeal to your current customer base. Knowing the specifics helps to inform your marketing strategy so you can decide which message to send out and how to communicate it to people best.
Paid Marketing Activities
Another critical aspect to consider when evaluating your analytics is your paid advertising efforts. This will allow you to calculate your ROI for different types of paid ads.
- How much has your business generated from its social media ads? Does Instagram drive more revenue than Twitter?
- Did you earn more income from the ad campaign than you spent on creative and ad spend?
- How much has your business grown as a result of your PPC campaigns?
- What about your email campaigns?
- Other paid media efforts? Influencers?
If you don’t evaluate your current paid advertising efforts, you’ll only be able to invest in ads that aren’t working for your business.
For example, Amazon Advertising is the go-to for Amazon Sellers. You have direct access to campaigns, keywords, targets, ads, and many other data points for your paid media investment on Amazon.
Amazon Ads makes data available as manual downloads or via Amazon Advertising API Automation. Also, see Amazon Advertising Reports: Performance Data for a deeper dive into the available data.
How Do You Undertake Ecommerce Data Analytics?
Business metrics like average order value, revenue, and unique visitor count are important indicators of how well you’re doing. But many different types of metrics measure success across multiple channels. For example, acquisition channels are places where people find products and services online. These include social media sites, review platforms, blogs, ecommerce stores, and more.
Several KPIs exist, including transaction, revenue, customer satisfaction, and conversion.
Transaction metrics will often include:
- Average basket size.
- The number of products sold daily.
- Total sales volume over a given period.
Revenue metrics have a
- net profit margin
- gross profit margin and
- gross profit percentage
Customer satisfaction metrics include things like
- customer retention rate
- return rate, and
- customer lifetime value
Conversion metrics have
- cart abandonment rate
- purchase frequency, and
- checkout conversion rate
Marketing Channel Analysis
Marketing analytics help companies know what works and which marketing tactics are effective. This knowledge can improve product development, advertising strategies, and brand management.
A marketing channel is a way to reach customers. For example, a customer could use social media, email, text messages, billboards, TV ads, radio spots, etc., to contact you. Each channel has a different purpose and offers another type of audience.
Marketing channel analysis aims to identify where your best prospects are coming from. You do this by analyzing the data from each channel. If you find that a specific channel isn’t working for you, you’ll know exactly why. Then, you can make adjustments to improve performance.
For instance, if you find people clicking on your Facebook ad but not converting, you might adjust budgets, creative, or target audience. Or maybe you notice people sign up for your newsletter but are not engaging. In this case, you’d probably change the frequency of your emails or add additional value to your newsletter.
Each channel has metrics, including conversion, bounce, and abandonment rates. Conversion rates show a marketing campaign’s success at getting leads into the funnel. Bounce rates indicate whether someone left the site without buying anything. Abandonment rates tell how likely someone will abandon a purchase once they reach checkout.
Ecommerce Funnel Analysis
A funnel analysis gives insights into how visitors arrive in your purchase funnel, where they go, and what happens next. This exercise aims to identify opportunities to optimize your marketing and customer journey efforts. This effort will help ensure you get the maximum number of potential customers to convert.
First things first, you should identify your business’ overall objective. Once you’ve done that, go through each part of the journey and figure out how people can get from one point to another. Make sure they know what path leads where. You may discover that one area isn’t getting much traffic, so you could create an easy link to draw people towards it.
Once you’ve identified your goals, it’s time to build a funnel. Start by defining the steps involved in reaching each goal. Each step represents one stage in your funnel. In addition to the name of the action, including the URL that leads to it. Then, write down the conversions associated with each step. Finally, label each step according to whether it’s leading toward success or failure.
After completing the funnel diagram, dig into the data and analyze it. How do visitors behave once they reach your store? Are they staying on the site long enough to complete a transaction? Do they bounce away immediately? Is there a clear path from the homepage to the checkout process? Once you understand your visitors’ behavior, you can decide how to change things.
For instance, if you found that most visitors never complete their transactions, you might consider adding additional information on the home page to help them. Or, if you noticed that most of your visitors bounced away without even looking at your offers, you might try changing the layout of your offers, refining the copy, or creative to make them more compelling.
If you aren’t making it easy for your visitors to navigate through your funnel, you’ll lose a lot of potential customers.
Ecommerce Analytics Best Practices
With an understanding of how beneficial ecommerce analytics is for your business, you will now need to implement the core KPIs and tools correctly so they can help you achieve success.
Benchmarks
A benchmark is a specific target that helps you understand how well you are doing against competitors. You can use measures to establish goals, track performance, identify areas for improvement, and compare yourself to others.
Benchmarks can help you determine whether you’re meeting your objectives and provide valuable data for measuring progress. For example, you might want to know how many leads you’ve generated per month or how much revenue you’ve earned over a quarter. Benchmarking gives you a way to quantify your success and make sure you’re making good decisions.
Collect all of your marketing data from all of your different sources and channels
You may start with some messiness, but you must organize everything into one place to easily access it.
If you have been working with data manually, you are likely feeling overwhelmed. That’s okay! Make a list of where all of your data resides. Here are some examples:
- Email providers
- Customer relationship management platforms
- ERPs
- Google Ads
- Facebook Ads
- Amazon
- Shopify
The good news is that this information can be easily pulled together and exported in one place. With a pre-made connection, you can get your data from any source without much work. This saves you time and effort to focus on what matters most — growing your business.
Ecommerce Analytics Tools
Thankfully, Ecommerce analytics tools provide the software to discover new opportunities while surfacing a wealth of information about your operations, visitors, and sales.
Using these tools for analyzing data, you can see how customers interact with your products and services and determine whether certain features or actions drive sales.
The best ecommerce analytics software helps your teams gain velocity in decision-making efficiently and flexibly.
An analytics tool provides insights into your current campaign performance. It lets you compare your metrics against industry benchmarks, monitor the impact of changes to your campaigns, and generate reports tailored to your needs. By analyzing your data, you can make better decisions about your marketing activities and optimize your return on investment.
Analytics tools help you analyze your data and make intelligent decisions based on those findings.
Self-Service Ecommerce and data analytics Tools
Ecommerce data analytics help businesses understand what customers want and what drives sales. There are many different ways of measuring ecommerce performance, including transaction volume, basket size, product views, and revenue per visitor. These tools collect data from the entire site and offer insight into customer behavior and conversions.
You can increase your chances of selling more products online by making better decisions.
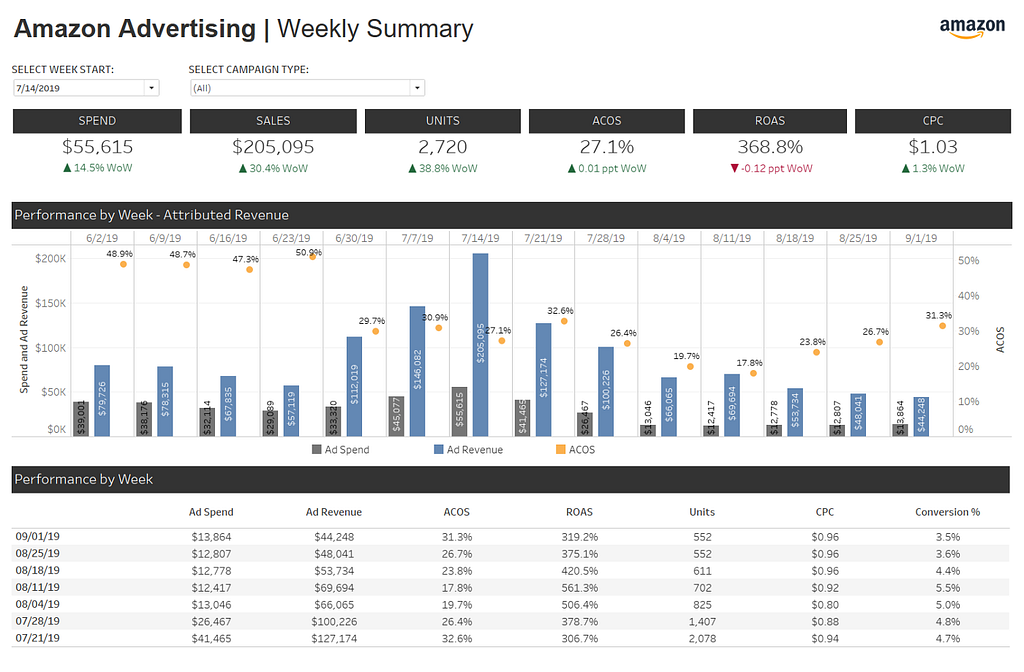
Here is an example of paid media analysis using Tableau:
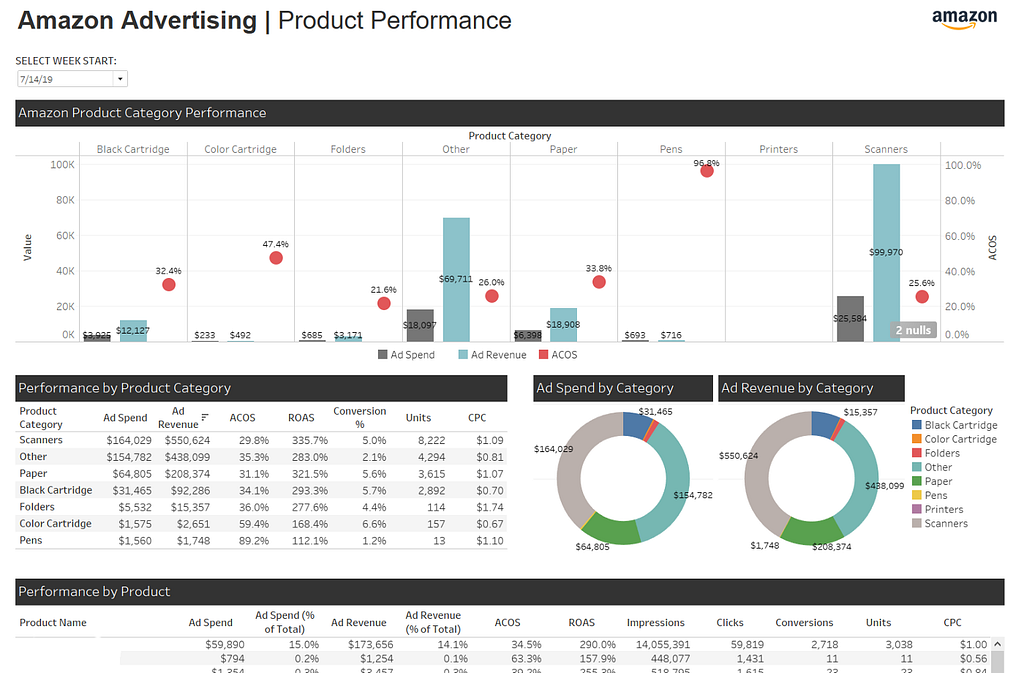
In addition to media performance, you can construct a deep dive on product performance as well:
While these examples show the power and flexibility of Tableau, they demonstrate more broadly what is possible with tools like Tableau. The following is a collection of some of the best ecommerce analytics tools for self-service insights efforts;
- Google Data Studio
- Tableau
- Power Bi
- Looker
- Sisense
The tools reflect industry leaders and the best analytics software for ecommerce for those who want to own their insights efforts. Combine these tools with your data unified in a cloud data warehouse or data lake; you create a powerhouse ecommerce analytics platform tailored to your needs.
Examples of prepackaged ecommerce analytics software
Unlike self-service tools, packaged Ecommerce analytics tools provide pre-built visualizations and reports. While less flexible, they can offer a wealth of information about your visitors and sales quickly.
These tools will often prebuild ecommerce analytics dashboards that can package KPIs and offer insight into customer behavior and conversions. They will provide different ways of measuring ecommerce performance, including transaction volume, basket size, product views, and revenue per visitor.
Here are a couple of examples of this category of tools:
Summary
Analytics in ecommerce should provide insight into your current performance and actionable recommendations that inform actionable strategies. In addition to providing valuable insights about your key metrics in campaign performance, it will show you where there are gaps, which areas need improvement, and how you optimize for ecommerce metrics that increase your ROI.
As an ecommerce business using analytics, you can make better-informed decisions that will help your business grow and succeed. From adjusting advertising investment to refining content for popular products, analytics delivers data-driven insights so you can see where your business is thriving and where it needs improvement.
You have several options when choosing an ecommerce analytics tool. However, the key is getting started. You cannot know if something is working unless you measure it.
Getting Started With Ecommerce Analytics
Unifying and owning your data allows you to build a view of sales over time, and understand buyer behavior more deeply. Data-driven insights mean your sales funnel will be full, your content strategy aligned, and traffic potential optimized.
If you are looking for data pipelines for your eCommerce data, Openbridge offers no-code, fully automated data pipelines.
Unify your eCommerce data and start your analysis journey today.
Sign up for a 30-day free trial of our fully-automated ecommerce data feeds today!
Kickstart Ecommerce Analytics: A Beginners Guide was originally published in Openbridge on Medium, where people are continuing the conversation by highlighting and responding to this story.
from Openbridge - Medium https://ift.tt/6rSOcJ7
via IFTTT