Discover Airbridge: Configuration-Driven Airbyte Cloud Data Integration Pipelines

Quickly run configuration driven Airbyte connectors via Airbridge, an open source, Docker based service.

Earlier this year the Meltano community released the tap-airbyte-wrapper. This is what open source is all about! The Meltano Airbyte wrapper takes advantage of Docker, translating output from a source into a Singer-compatible format. This is a perfect fit for someone invested in the Meltano ecosystem.

While we were inspired by the effort, there was one hitch for us. We wanted something that works for data-curious spelunkers, data engineers, and developers so they can explore configuration-driven data pipelines without relying on Meltano.

Keeping things lean and simple, with a focus on the true open source aspects of Airbyte, was important to us. As a result, we built Airbridge as a pure Python+Docker integration tool that orchestrates data ingestion pipelines from Airbyte data sources like Stripe, Facebook, or Google to Airbyte data destination connectors like a S3 data lake, Redshift, Snowflake, or BigQuery.

Project Framework Approach

While Airbridge shares a common core (Python, Docker…) with Meltano, unlike the Meltano wrapper, Airbridge does not require using the Meltano SDK. Also, unlike Meltano tranforming Airbyte output to the Singer spec, Airbridge retains the raw data source output in an unmodified state. Nothing against Singer formatted outputs, we just wanted to keep the Airbyte output in raw form.

The following are a collection of the guiding principles we set forth at the start of the work effort;

🐳 Use Docker-Driven Workflows: Airbridge must be Docker-centric methodology that capitalizes on ready-to-go source and destination Docker images accessible via Airbyte Docker Hub. This facilitates a streamlined setup procedure, directing focus where needed most: crafting seamless data flows.

🐍 Leverage Python: Anchor the work in the well-traveled and standard-based Python framework. Airbridge offers a clean, swift, and modular data flow, fostering easy setup and modification.

🔗 Seamless Airbyte Sources and Destinations Integration: Airbridge must orchestrate the essential resources to seamlessly sync source connectors to data destinations.

🔄 Automated State Management for Hassle-Free Operations: Provide the ability for automated state tracking for each run. Use simple yet potent solution to ensure uniformity and dependability in tasks, curbing errors, and conserving resource time.

🔓 Open-Source and Community-Driven: Airbridge must be released under the MIT license.

📦 No Bloat, Just Efficiency: No unnecessary wrappers; Airbridge should concentrate on delivering a lean, efficient tool that caters to the core needs of developers, fostering seamless data integration pipelines.

Getting Started: Where can I deploy Airbridge?

Deploy it in the cloud, locally, or somewhere in between. Setting up Airbridge in your cloud computing environment — be it AWS, Azure, or Google Cloud, is a breeze.

Before you begin, ensure that you have the following prerequisites installed on your system:

  1. Python: Verify or install it using the command: python --version
  2. Git: Verify or install it using the command: git --version
  3. Docker: Verify or install it using the command: docker --version

If any of the above software is not installed, please install them before proceeding.

Step 1: Create a local project directory and navigate into it:

mkdir airbridge_project && cd airbridge_project 

Step 2: Clone the project from Github and navigate into the project directory:

git clone https://github.com/openbridge/airbridge.git && cd airbridge

Step 3: Set up a virtual environment (optional but recommended):

python -m venv venv
source venv/bin/activate # On Unix or MacOS
# .\venv\Scripts\activate # On Windows

Step 4: Install the project dependencies. There is a pyproject.toml file, so you can use poetry to manage the dependencies. First, install poetry using the following command:

pip install poetry

Now, install the project dependencies using poetry:

poetry install

Step 5: Start the Docker daemon if it is not already running. You can do this via the Docker desktop application or by using the following command, depending on your OS:

systemctl start docker # You might need sudo privileges

Step 6: Once you have your Airbyte source and destination configs ready, you can run Airbridge. Here is an example command using Stripe as a source and Amazon S3 as a destination:

poetry run main -i airbyte/source-stripe -w airbyte/destination-s3 -s /airbridge/env/stripe-source-config.json -d /airbridge/env/s3-destination-config.json -c /airbridge/env/stripe-catalog.json -o /airbridge/tmp/mydataoutput/

Explanation of the command parameters:

  • -i: Input source (Stripe in this case)
  • -w: Destination (Amazon S3 in this case)
  • -s: Path to the source configuration file
  • -d: Path to the destination configuration file
  • -c: Path to the catalog configuration file
  • -o: Output directory

Comprehensive Airbyte install guides are at your disposal, guiding you to get your Airbyte connector and data destinations up and running. Visit the project here:

GitHub - openbridge/airbridge

License

Airbridge is released under the MIT license. Access the code and kickstart your efforts.

Community

For enthusiasts eager to delve deeper, the Airbridge and Airbyte GitHub spaces are where developers can discover a treasure trove of resources, contribute to the projects, or build knowledge from the community. It’s a platform where your expertise, novice or veteran, finds appreciation and acknowledgment.

As with most efforts like these, we cordially invite you to partake in a collaborative expedition as the effort moves forward. Community perspectives, feedback, and involvement are crucial in sculpting a tool that aligns with an open source projects aspirations.

Frequently Asked Questions (FAQs)

What does Airbyte do?

Airbyte is a data integration platform that facilitates the extraction, transformation, and loading (ETL) of data from various sources to destinations of your choice. It helps automate the data pipeline creation process, allowing businesses and developers to focus on deriving insights from the data rather than grappling with data sync challenges.

How does Airbyte work?

Airbyte operates through a series of connectors that enable pipelines between different data sources and destinations. These connectors are pre-configured to work with specific platforms, simplifying the data extraction and loading process. Airbyte also offers a graphical user interface (UI) where users can configure and manage their data pipelines easily. Under the hood, it utilizes Docker containers to manage and isolate different data connectors, ensuring a robust and scalable data solution.

What is Airbyte used for?

Airbyte is primarily used for data integration and ETL processes. It allows organizations and developers to create data pipelines easily, facilitating data movement from various sources, like databases, APIs, and flat files, to different destinations, including data warehouses, data lakes, or other business intelligence tools. This helps consolidate data in a centralized location, making it easier to analyze and derive valuable business insights.

Is Airbyte open-source?

Yes, parts of Airbyte are open-source. Some features of Airbyte operate under the MIT license, allowing users to use, modify, and distribute the software freely. Airbridge focuses on those parts of Airbyte that are open source under the MIT license. Open source fosters a community where developers can contribute to the project, enhancing its functionality and robustness. Airbridge source code is publicly available on GitHub, encouraging transparency and continuous improvement.

Airbridge will not support any parts of Airbyte that fall under, as the Open Source Initiative says, a “fauxpen” source license.

Does it require the Airbyte UI?

Using the Airbyte UI is not needed. The Airbyte UI offers a user-friendly environment where you can configure data connectors, set up data pipelines, and monitor the status of your data integrations. However, Airbridge allows configuring and managing data pipelines without using the UI for users comfortable with command-line operations.

What is the Airbyte Pricing for running open source?

Airbyte Cloud costs $2.50 per credit to run. If you replicate 100M rows of data per month, Airbyte will cost over $14,000 for the year. However, if you run Airbyte in a self-managed context, your costs are infrastructure and management time. You just need to make sure you are compliant with Airbyte licenses.


Discover Airbridge: Configuration-Driven Airbyte Cloud Data Integration Pipelines was originally published in Openbridge on Medium, where people are continuing the conversation by highlighting and responding to this story.


from Openbridge - Medium https://ift.tt/kPW5n6u
via IFTTT

Introduction to Amazon return report data analysis

Amazon FBA returns data analysis examples

You can perform various types of analysis based on Amazon returns report data. We detail various examples and opportunities for performing data analysis of returns reports.

For our test dataset, our sample data set is relatively small, with just a few days of return data.

  • The dataset contains 46,586 entries.
  • There are 13 columns in the dataset: ‘return-date’, ‘order-id’, ‘sku’, ‘asin’, ‘fnsku’, ‘product-name’, ‘quantity’, ‘fulfillment-center-id’, ‘detailed-disposition’, ‘reason’, ‘status’, ‘license-plate-number’, and ‘customer-comments’.
  • Most columns are of object (string) type, except ‘quantity’ which is an integer.
  • The ‘customer-comments’ column has some missing values (NaN), with 13,013 non-null entries out of 46,586 total entries.
  • All returned items have a quantity of 1, as indicated by the minimum, maximum, and average values of the ‘quantity’ column.
  • The ‘sku’, ‘asin’, ‘fnsku’, and ‘product-name’ columns have several unique entries, indicating a wide variety of products in the dataset.
  • The ‘return-date’ column has 28 unique entries, suggesting that the dataset spans a period of 28 days.
  • The ‘fulfillment-center-id’ column has 170 unique entries, indicating that the dataset includes returns processed by 170 fulfillment centers.
  • The ‘detailed-disposition’ column, which describes the condition of the returned items, has 5 unique entries.
  • The ‘reason’ column, which contains the reason for return as indicated by the customer, has 26 unique entries.
  • The ‘status’ column, which describes the status of the customer return, has 2 unique entries.
  • The ‘license-plate-number’ column, which uniquely identifies specific items, has 46,538 unique entries, almost one for each entry in the dataset.

Below are some example SQL queries that could be used to explore the dataset.

Count of returned products by reason:

This can help you understand the primary reasons customers are returning products.

  • SELECT reason, COUNT(*) AS count FROM Returns GROUP BY reason ORDER BY count DESC;

Count of returned products by disposition (condition):

This can help you understand the condition of products when they are returned.

  • SELECT detailed_disposition AS disposition, COUNT(*) AS count FROM Returns GROUP BY detailed_disposition ORDER BY count DESC;

The total quantity of each product returned:

This can help you understand which products are returned the most frequently.

  • SELECT product_name, SUM(quantity) AS total_quantity FROM Returns GROUP BY product_name ORDER BY total_quantity DESC;

Number of returns processed by each fulfillment center:

This can help you understand if there are issues with specific fulfillment centers.

  • SELECT fulfillment_center_id AS fc, COUNT(*) AS count FROM Returns GROUP BY fulfillment_center_id ORDER BY count DESC;

Percentage of returned items that are sellable:

This can help you understand the financial impact of returns.

  • SELECT (COUNT(*) FILTER (WHERE detailed_disposition = 'SELLABLE') * 100.0 / COUNT(*)) AS sellable_percentage FROM Returns;

Average number of returned items per order:

This can help you understand if there are orders with multiple returned items.

  • SELECT AVG(quantity) AS average_returns FROM Returns;

Visualization Examples

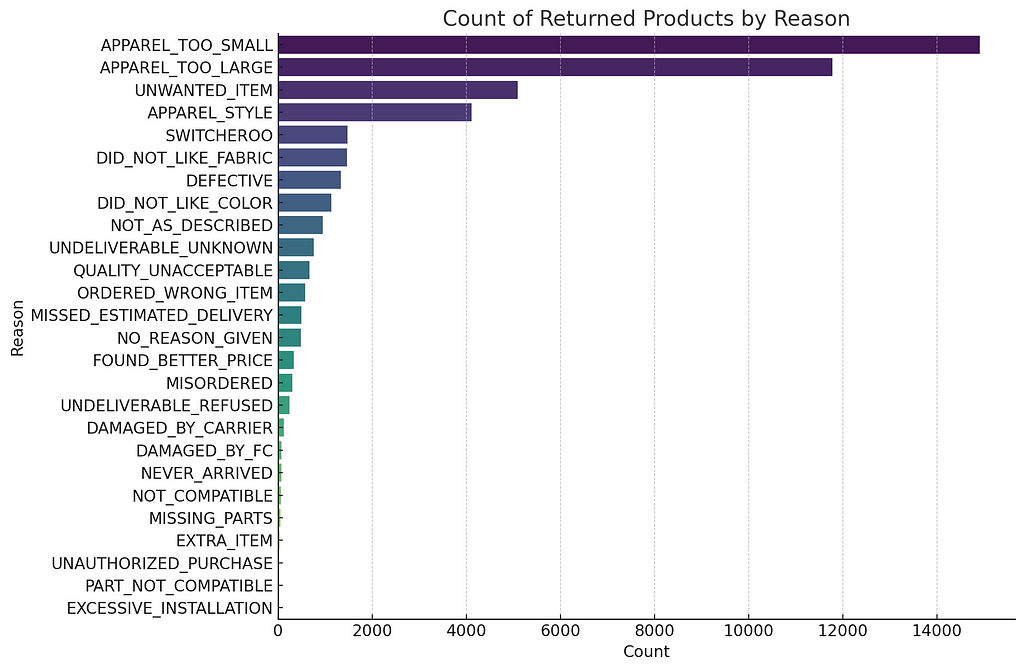
Let’s start with the first one: Count returned products by reason. We’ll compute the counts and create a bar plot for visualization.

The bar plot above shows the count of returned products grouped by the reason for return. “APPAREL_STYLE” is the most common reason for returns, followed by “APPAREL_TOO_LARGE.”

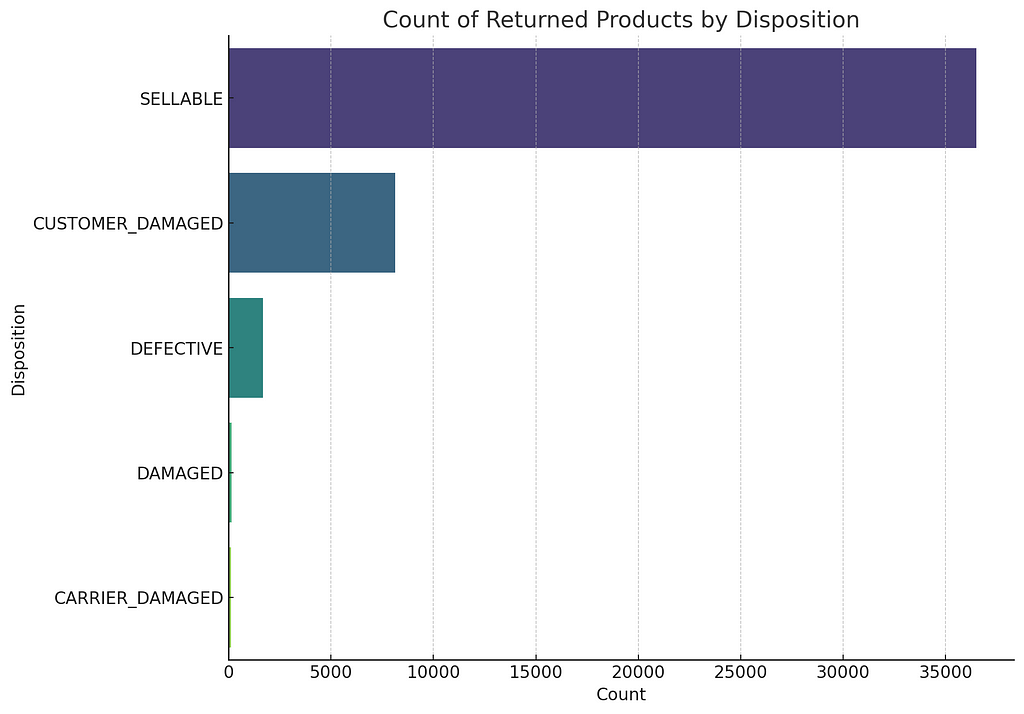
Next, let’s examine the count of returned products by their disposition (condition)

The bar plot above shows the count of returned products by their condition (disposition). Most returned items appear in the “SELLABLE” condition, followed by “CUSTOMER_DAMAGED.”

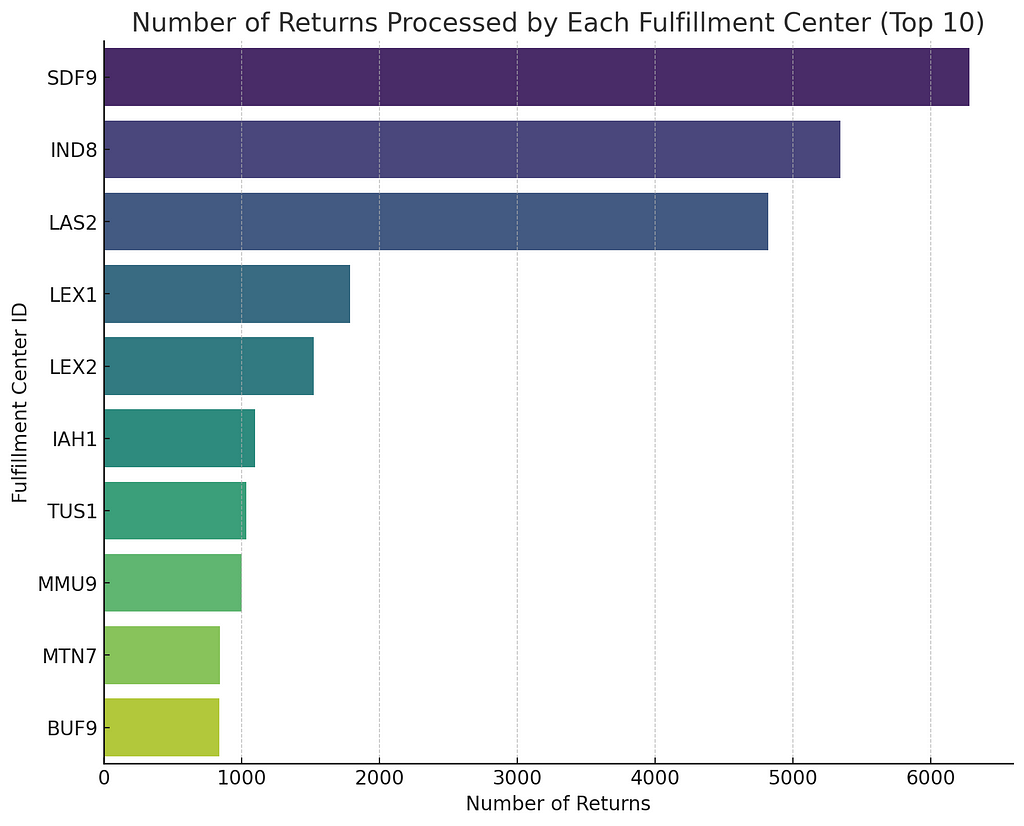
Next, calculate the number of returns processed by each fulfillment center. Due to the potentially large number of unique centers, we will visualize the top 10 centers with the highest return counts.

The bar plot above shows the number of returns processed by each fulfillment center, focusing on the top 10 centers with the highest return counts.

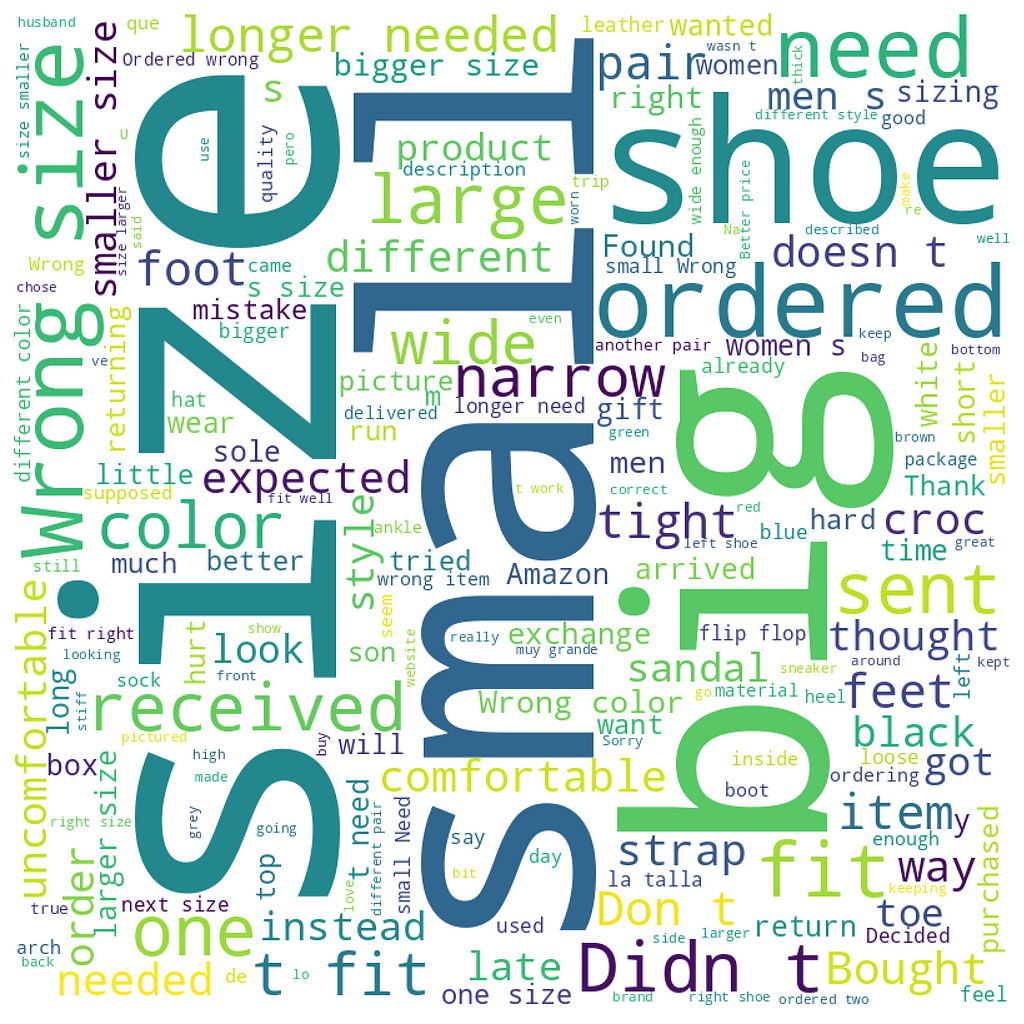
Here is a word cloud based on customer comments;

Additional Analysis Opportunities

Here are additional examples of how you might visualize the data;

  1. Count of returned products by reason: A bar chart would work well here, with the reasons on the x-axis and the counts on the y-axis.
  2. Count of returned products by disposition (condition): Similarly, a bar chart would work well for this data.
  3. The total quantity of each product returned: If there are many different products, a horizontal bar chart or a pie chart is more effective in visualizing the products with the highest return quantities.
  4. Number of returns processed by each fulfillment center: A bar chart or pie chart could be used to visualize this data.
  5. Percentage of returned items that are sellable: This could be visualized using a pie chart showing the proportion of sellable vs. unsellable returns.
  6. Average number of returned items per order: A histogram could be useful here to see the distribution of the number of returned items per order.

Seamless, Code-free Rapid Retail API Automation Unleashed

Openbridge provides automated data feeds, without the need for code, to quickly deliver data directly to Amazon Redshift, Amazon Redshift Spectrum, Google BigQuery, Snowflake, Azure Data Lake, and Amazon Athena.

This fast and unified data access enabled teams to utilize their preferred analytical tools, such as Google Data Studio, Tableau, Microsoft Power BI, Looker, or Amazon Quicksight, for various purposes, including machine learning, business intelligence, data modeling, and online analytical processing.

Get Started Automating Amazon Returns Data for — For Free.

Ditch the messy, manual report downloads for code-free automation access to the new Amazon’s Return data. Openbridge integration is a code-free, fully-automated API integration. By providing Sellers with access to high-velocity data, they can accelerate the speed at which the team can gain valuable insights that deliver data-driven growth and profit.

Sign up for a 30-day free trial of our Amazon API code-free automation.


Introduction to Amazon return report data analysis was originally published in Openbridge on Medium, where people are continuing the conversation by highlighting and responding to this story.


from Openbridge - Medium https://ift.tt/9Cejbqo
via IFTTT

Amazon Rapid Retail Analytics: New API for Real-time Metrics

Unleash the power of your data with Amazon Rapid Retail Analytics for real-time insights for Amazon Vendor Central and Seller Central.

Amazon Vendor Central and Seller Central have a new real-time API, Rapid Retail Analytics. Openbridge has been partnering with Amazon on a closed beta of the new API, and we are excited to announce it has finally been released.

Amazon’s Retail Rapid Analytics API for Vendors and Sellers offers insight into key performance benchmarks, including hourly sales, traffic, and inventory data. At the moment, Sellers only have access to Sales data. Vendors can access Sales, Traffic, and Inventory, a game changer.

Here are the three core datasets in this release;

📊 Sales

  • Ordered Units: It represents the number of units Amazon customers order for a specific ASIN within a given time frame. This number can be negative if there are more cancellations than orders.
  • Ordered Revenue: The total revenue generated from the aggregated ordered product sales for the specified ASIN within a given time frame. Adjustments are made to account for cancellations.

📦 Inventory:

  • Highly Available Inventory Units: This metric represents the number of units available for sale on the Amazon website across different regions and apps. It is based on the units in Amazon fulfillment centers that are in a sellable condition, excluding units in customer shopping carts or allocated for other orders.

🚀 Traffic:

  • Glance Views: It indicates the number of times customers have viewed the product detail page for a specific ASIN. The views are counted when a particular merchant is the featured offer for the product. For vendors, this metric is applicable when retail is the featured offer. Glance views are reported based on the Amazon Retail Analytics manufacturing view.

Examples of Rapid Retail Analytics API Data

Here are some examples of the data included in the hourly data feeds:

  • Sales: Hourly sales data would show two units of ASIN “B123456789” ordered between 7:00 pm and 8:00 pm UTC on February 20th, 2023, which generated revenue of 37.98.
  • Traffic: Hourly traffic data would show ASIN “B123456789” received 5,000 “glance views” between 7:00 and 8:00 pm UTC on February 20th, 2023.
  • Inventory: Hourly inventory data would show that ASIN “B123456789” had 9,000 units highly available between 7:00 pm and 8:00 pm UTC on February 20th, 2023.

The “highly available” metric refers to the number of units available for sale on Amazon with the fastest shipping speed, typically Prime, based on units in a sellable condition in Amazon’s fulfillment centers. This number considers units unavailable for sale, such as those in customer shopping carts or reserved for other orders. The quantity shown reflects this metric when a customer sees a product available to buy directly from Amazon. It’s important to note that this metric differs from “Sellable Units,” which doesn’t factor in known demand when determining inventory counts.

Real-world Use Cases For Retail API Data

We have included a collection of thought-starter SQL queries for the Retail API data. These queries aim to provide a starting point for understanding how the data can be used to drive insights that inform efficient business growth.

Unleashing Business Insights With Amazon Rapid Retail Analytics

Say Goodbye to Manual Processes with Amazon’s Retail Rapid Analytics API

Traditionally, Vendors have had to rely on manual Amazon Vendor Central Retail Analytics report downloads or legacy EDI services to access their sales data from retailers. These methods were often time-consuming and prone to errors, as they required manual generation and downloading of reports. This manual process resulted in delayed insights and an inability to make timely business decisions.

Amazon’s Retail Rapid Analytics API is a significant shift for Vendors, providing new levels of speed and automation previously unavailable. By leveraging high-velocity data, Vendors can gain deeper insights into their business performance, make more informed decisions, and drive growth and profitability.

RocketBike Soars with Real-Time Rapid Retail Analytics Insights

RocketBike, one of the early beta testers, was thrilled to compare the new API against the traditional data access methods. They noted that Vendor real-time data provides unprecedented levels of automation and accelerates the velocity of understanding vendor business performance.

As Michael Swenson, the CMO at Rocketbike, puts it;

“We use Vendor real-time data to drive growth and profitability for our clients by gaining insights into sales, traffic, and inventory faster than ever before.”

Fast Access to ASIN Level Sales, Inventory, and Traffic Data

There are three new data sets available to Vendors:

  • Real-time Sales: This metric supports the Ordered Units and Ordered Revenue, giving you access to sales data in real time for the US, CA, MX, BR, UK, DE, FR, IT, ES, NL, PL, SE, BE, EG, TR, SA, AE, IN, SG, AU, JP.
  • Real-time Inventory: This metric supports the Quantites and Sku, providing inventory data in real time for the US, CA, MX, BR, UK, DE, FR, IT, ES, NL, PL, SE, BE, EG, TR, SA, AE, IN, SG, AU, JP.
  • Real-time Traffic: This metric supports the Views, Buy Box Percentage, and Sessions, allowing you to track your traffic in real time for the US, CA, MX, BR, UK, DE, FR, IT, ES, NL, PL, SE, BE, EG, TR, SA, AE, IN, SG, AU, JP.

Check out our Amazon Rapid Retail Analytics API documentation for a deep dive.

Seamless, Code-free Rapid Retail API Automation Unleashed

Openbridge collaborated with Amazon in a closed beta to provide automated data feeds, without the need for code, to quickly deliver Vendor data directly to Amazon Redshift, Amazon Redshift Spectrum, Google BigQuery, Snowflake, Azure Data Lake, and Amazon Athena.

This fast and unified data access enabled teams to utilize their preferred analytical tools, such as Google Data Studio, Tableau, Microsoft Power BI, Looker, or Amazon Quicksight, for various purposes, including machine learning, business intelligence, data modeling, and online analytical processing.

Get Started Automating Amazon Rapid Retail Analytics API Data for Amazon Vendor Central — For Free.

Ditch the messy, manual report downloads for code-free automation access to the new Amazon’s Retail Rapid Analytics. Openbridge integration is a code-free, fully-automated API integration. By providing Vendors with access to high-velocity data, they can accelerate the speed at which the team can gain valuable insights that deliver data-driven growth and profit.

Sign up for a 30-day free trial of our Amazon Rapid Retail Analytics API code-free automation.

References


Amazon Rapid Retail Analytics: New API for Real-time Metrics was originally published in Openbridge on Medium, where people are continuing the conversation by highlighting and responding to this story.


from Openbridge - Medium https://ift.tt/5gJ2NmR
via IFTTT

Unleashing Business Insights With Amazon Rapid Retail Analytics

Rapid Retail Analytics SQL Queries

Real-world SQL queries to jumpstart your retail data analysis efforts

In the ever-evolving landscape of e-commerce, harnessing the power of data is crucial for businesses striving to drive efficient growth. As an Amazon Vendor, or Seller, you can access new near real-time Amazon Rapid Retail data feeds that unlock actionable insights and enable informed data-driven decision-making.

What Can I Do With Amazon Rapid Retail Analytics Data?

Rapid Retail Analytics provides a view of ASIN-level sales, traffic, and inventory performance on the Amazon platform. This is the first time Amazon has offered this data type to Vendors, enabling new paths for data-driven decisions that improve performance and stay ahead of the competition.

Here are five areas of opportunity this new retail data will unlock. There are more areas of opportunity, but these are the obvious and immediate areas;

  1. Identifying Top Selling Products: One of the fundamental aspects of driving growth is knowing which products perform exceptionally well. We can use SQL queries to uncover the top-selling ASINs (Amazon Standard Identification Number) based on sales volume and revenue. This information allows businesses to allocate resources effectively, prioritize marketing efforts, and identify potential areas for expansion.
  2. Analyzing Sales Trends Over Time: Tracking sales performance over time is crucial for identifying patterns, seasonality, and overall growth trajectory. By employing SQL queries, we can generate insightful visualizations that illustrate the daily sales trends, empowering businesses to make data-driven decisions regarding inventory management, marketing campaigns, and resource allocation.
  3. Monitoring Inventory Levels: Maintaining optimal inventory levels is essential for meeting customer demand and maximizing sales potential. SQL queries can monitor inventory levels in real-time, ensuring products are readily available while minimizing the risk of stockouts. By leveraging this data, businesses can strike the right balance between inventory holding costs and customer satisfaction.
  4. Assessing Traffic and Customer Engagement: Understanding customer engagement and traffic patterns is vital to efficient business growth. By analyzing the provided traffic data, SQL queries can unveil which ASINs receive the highest number of glance views. With this information, businesses can fine-tune marketing strategies, improve product visibility, and enhance customer engagement, ultimately driving sales and expanding their customer base.
  5. Combining Data Sources for Comprehensive Insights: By combining sales, inventory, and traffic data through SQL queries, businesses can gain a holistic understanding of their product performance. These integrated insights provide a complete picture of sales velocity, inventory turnover, and the impact of customer engagement on overall business growth. With this knowledge, businesses can optimize operations, identify areas for improvement, and capitalize on growth opportunities.

Whether you are a data scientist, analyst, or business owner, understanding how to utilize this data effectively can unlock opportunities for efficient business growth. We will explore how to query this data by leveraging new near real-time sales, inventory, and traffic information.

For a deeper dive into this data, see our doc Amazon Retail Analytics API.

Jump below for examples of how to query this data.

Getting Started Answering Key Performance Questions

We have included a collection of thought-starter SQL queries. These queries aim to provide a starting point for understanding how the data can be used to drive insights that inform efficient business growth.

Remember to customize the queries based on your specific business goals, timeframes, and any additional dimensions or filters you may require. Lastly, they may require slight modifications for your SQL environment.

Analyzing Sales Data:

Retrieve the total ordered units and revenue for each ASIN:

SELECT asin, SUM(ordered_units) AS total_units, SUM(ordered_revenue) AS total_revenue FROM sp_vendor_rt_sales GROUP BY asin;

Calculate the daily sales summary:

SELECT ob_date, SUM(ordered_units) AS total_units, SUM(ordered_revenue) AS total_revenue FROM sp_vendor_rt_sales GROUP BY ob_date;

Identify the top-selling ASINs based on units or revenue:

SELECT asin, SUM(ordered_units) AS total_units FROM sp_vendor_rt_sales GROUP BY asin ORDER BY total_units DESC LIMIT 10;

Analyzing Inventory Data

Calculate a daily inventory summary:

SELECT ob_date, SUM(highly_available_inventory) AS total_inventory FROM sp_vendor_rt_inventory GROUP BY ob_date;

Identify ASINs with low inventory levels:

SELECT asin, SUM(highly_available_inventory) AS total_inventory FROM sp_vendor_rt_inventory GROUP BY asin HAVING total_inventory < desired_threshold;

Analyzing Traffic Data

Retrieve the total glance views for each ASIN:

SELECT asin, SUM(glance_views) AS total_glance_views FROM sp_vendor_rt_traffic GROUP BY asin;

Retrieve the total glance views, by the hour, for each ASIN, over the past 30-days:

SELECT asin, DATE_TRUNC('hour', event_time) AS hour, SUM(glance_views) AS total_glance_views
FROM sp_vendor_rt_traffic
WHERE event_time >= NOW() - INTERVAL '30 days'
GROUP BY asin, hour;

Calculate the daily traffic summary:

SELECT ob_date, SUM(glance_views) AS total_glance_views FROM sp_vendor_rt_traffic GROUP BY ob_date;

Identify ASINs with high traffic

SELECT asin, SUM(glance_views) AS total_glance_views FROM sp_vendor_rt_traffic GROUP BY asin HAVING total_glance_views > desired_threshold;

Combining Data Sources:

Join the sales, inventory, and traffic data for a comprehensive analysis:

SELECT s.asin, s.total_units, i.total_inventory, t.total_glance_views FROM (SELECT asin, SUM(ordered_units) AS total_units FROM sp_vendor_rt_sales GROUP BY asin) s JOIN (SELECT asin, SUM(highly_available_inventory) AS total_inventory FROM sp_vendor_rt_inventory GROUP BY asin) i ON s.asin = i.asin JOIN (SELECT asin, SUM(glance_views) AS total_glance_views FROM sp_vendor_rt_traffic GROUP BY asin) t ON s.asin = t.asin;

Tableau, Power BI, Looker

You can use Rapid Retail Analytics data in tools like Tableau, Looker, Power BI, or Amazon QuickSight.

Below is a collection of views that can be created as overlays on the data. Views can be a very convenient way to encapsulate logic and make that available to any user on your team.

To create a set of views that can be used in tools like Tableau, Power BI, or Looker for time series performance reports based on the provided data feeds, you can define the following views:

Sales Performance View

This view provides aggregated sales performance metrics for each day.

CREATE VIEW vw_sales_performance AS
SELECT ob_date AS date,
SUM(ordered_units) AS total_units,
SUM(ordered_revenue) AS total_revenue
FROM sp_vendor_rt_sales
GROUP BY ob_date;

Inventory Performance View

This view provides aggregated inventory metrics for each day.

CREATE VIEW vw_inventory_performance AS
SELECT ob_date AS date,
SUM(highly_available_inventory) AS total_inventory
FROM sp_vendor_rt_inventory
GROUP BY ob_date;

Traffic Performance View

This view provides aggregated traffic metrics for each day.

CREATE VIEW vw_traffic_performance AS
SELECT ob_date AS date,
SUM(glance_views) AS total_glance_views
FROM sp_vendor_rt_traffic
GROUP BY ob_date;

Combined Performance View

This view combines sales, inventory, and traffic metrics for each day.

CREATE VIEW vw_combined_performance AS
SELECT s.ob_date AS date,
s.ordered_units AS total_units,
s.ordered_revenue AS total_revenue,
i.highly_available_inventory AS total_inventory,
t.glance_views AS total_glance_views
FROM sp_vendor_rt_sales s
JOIN sp_vendor_rt_inventory i ON s.asin = i.asin AND s.ob_date = i.ob_date
JOIN sp_vendor_rt_traffic t ON s.asin = t.asin AND s.ob_date = t.ob_date;

Exploring Relationships Between Sales, Traffic, and Inventory

The types of analysis you can perform with the data can get very sophisticated. Below are a collection of exploratory and conceptual areas of analysis.

Identify the correlation between daily sales revenue and glance views for a specific ASIN.

SELECT s.ob_date, s.ordered_revenue, t.glance_views FROM sp_vendor_rt_sales s JOIN sp_vendor_rt_traffic t ON s.asin = t.asin AND s.ob_date = t.ob_date WHERE s.asin = 'desired_asin' ORDER BY s.ob_date;

Determine the top-selling ASINs based on the correlation between ordered and highly available inventory units.

SELECT s.asin, SUM(s.ordered_units) AS total_units, SUM(i.highly_available_inventory) AS total_inventory FROM sp_vendor_rt_sales s JOIN sp_vendor_rt_inventory i ON s.asin = i.asin GROUP BY s.asin ORDER BY total_units DESC;

Calculate the average revenue per ordered unit for each ASIN monthly.

SELECT DATEPART(MONTH, s.start_time) AS month, s.asin, SUM(s.ordered_revenue) / SUM(s.ordered_units) AS avg_revenue_per_unit FROM sp_vendor_rt_sales s GROUP BY DATEPART(MONTH, s.start_time), s.asin;

Find the ASINs with the highest revenue growth rate between two consecutive months.

WITH monthly_revenue AS ( SELECT asin, DATEPART(MONTH, start_time) AS month, SUM(ordered_revenue) AS revenue FROM sp_vendor_rt_sales GROUP BY asin, DATEPART(MONTH, start_time) ) SELECT current.asin, (current.revenue - previous.revenue) / previous.revenue AS growth_rate FROM monthly_revenue current JOIN monthly_revenue previous ON current.asin = previous.asin AND current.month = previous.month + 1 ORDER BY growth_rate DESC;

Identify the day of the week with the highest average revenue for a specific ASIN.

SELECT DATEPART(WEEKDAY, s.start_time) AS weekday, AVG(s.ordered_revenue) AS average_revenue 
FROM sp_vendor_rt_sales s WHERE s.asin = ‘desired_asin’
GROUP BY DATEPART(WEEKDAY, s.start_time)
ORDER BY average_revenue DESC;

These strategies leverage multiple tables to analyze and derive insights from the data. Remember to replace desired_asin with the specific ASIN you want to analyze.

Find the ASINs with the highest revenue growth rate between two consecutive days:

WITH daily_revenue AS (
SELECT asin, ob_date, SUM(ordered_revenue) AS revenue
FROM sp_vendor_rt_sales
GROUP BY asin, ob_date
)
SELECT current.asin, (current.revenue - previous.revenue) / previous.revenue AS growth_rate
FROM daily_revenue current
JOIN daily_revenue previous ON current.asin = previous.asin AND current.ob_date = DATEADD(DAY, 1, previous.ob_date)
ORDER BY growth_rate DESC;

Identify changes in the “highly available” metric that impact sales negatively. The SQL query calculates the negative impact on sales when the “highly available” metric decreases:

SELECT
i.start_time,
i.asin,
i.highly_available_inventory - lag(i.highly_available_inventory) OVER (PARTITION BY i.asin ORDER BY i.start_time) AS inventory_change,
s.ordered_units - lag(s.ordered_units) OVER (PARTITION BY s.asin ORDER BY s.start_time) AS sales_change
FROM
sp_vendor_rt_inventory i
JOIN
sp_vendor_rt_sales s ON i.asin = s.asin AND i.start_time = s.start_time
WHERE
inventory_change < 0 AND sales_change < 0;

Openbridge Report Automation

Openbridge Rapid Retail automation is a code-free, fully-automated integration to the Rapid Retail API. Teams ensure they get up-to-date and accurate data from official, certified Amazon APIs. With data stored in a unified data warehouse like Amazon Redshift, Amazon Redshift Spectrum, Google BigQuery, Snowflake, Azure Data Lake, and Amazon Athena, you can combine different Amazon datasets to gain a more holistic view of the business.

Your team can then leverage best-in-class analytics and business tools like Google Data Studio, Tableau, Microsoft Power BI, Looker, or Amazon Quicksight.

Get Started Automating Rapid Retail Analytics — For Free

Whether it’s identifying top-selling products, analyzing sales trends, monitoring inventory levels, assessing customer engagement, or combining multiple data sources, the power lies in understanding, interpreting, and acting upon the insights derived from the data.

Embrace the data, harness its potential, and embark on your journey to be a more data-driven organization.

Sign up for a 30-day free trial of our Amazon Rapid Retail Report automation.


Unleashing Business Insights With Amazon Rapid Retail Analytics was originally published in Openbridge on Medium, where people are continuing the conversation by highlighting and responding to this story.


from Openbridge - Medium https://ift.tt/LorKqYM
via IFTTT

Amazon Brand Metrics: Introducing New-To-Brand Analytics

Amazon Advertising Brand Metrics

Amazon Advertising now provides accessible new-to-brand metrics for Sponsored Brands and Sponsored Display campaigns, allowing for the measurement and optimization of ongoing campaigns. These metrics aim to facilitate the development of marketing strategies that can effectively increase customer acquisition and foster brand loyalty.

What is “New To Band”?

An order is considered new-to-brand if the customer has not purchased from that particular brand during that timeframe.

So how are these metrics calculated? Amazon will model the customer’s purchase history for the past 12 months to determine whether an order is new to a brand. The list below details available new-to-brand metrics for sponsored ads campaigns and keywords.

  1. New-to-brand orders: The count of initial orders for products within the brand during a 1-year observation period.
  2. % of orders new-to-brand: The percentage of total orders that are new-to-brand orders. This metric is calculated by dividing the number of new-to-brand orders by the total number of orders and multiplying by 100.
  3. New-to-brand sales: The total sales (in local currency) generated by new-to-brand orders.
  4. % of sales new-to-brand: The percentage of sales (in local currency) attributed to new-to-brand orders. This metric is calculated by dividing the total sales of new-to-brand orders by the total sales and multiplying by 100.
  5. New-to-brand units: The number of units purchased through new-to-brand orders.
  6. % of units new-to-brand: The percentage of total units acquired through new-to-brand orders. This metric is calculated by dividing the number of new-to-brand units by the total number of units and multiplying by 100.
  7. New-to-brand order rate (for Sponsored Brands only): The ratio of new-to-brand orders to the number of clicks. This metric is calculated by dividing the number of new-to-brand orders by the number of clicks and multiplying by 100.

How Can New To Brand Metrics Be Utilized?

Leveraging new-to-brand metrics can optimize Sponsored Brands and Sponsored Display campaigns, facilitating new customer acquisition and fostering long-term brand relationships.

Below are some recommendations for optimizing customer acquisition by identifying or creating Sponsored Brands or Sponsored Display campaigns with a specific focus on this goal:

  1. After the campaign has gathered a minimum of 14 days’ worth of data, closely analyze the campaign’s new-to-brand keyword metrics. Filter keywords based on acceptable ROAS (Return on Advertising Spend) or ACOS (Advertising Cost of Sales) values.
  2. From the resulting set of keywords, identify those with the highest number of new-to-brand orders. These keywords represent potential targets for driving new-to-brand orders.
  3. Evaluate the metrics related to new-to-brand units and sales, as they may reveal keywords that generate new-to-brand orders with higher price points and basket sizes.
  4. Continuously monitor the campaign’s new-to-brand performance over time using the performance dashboard, making necessary adjustments as required.

These metrics can also apply to broader, strategic efforts to refine positioning, competitive pressures, and product;

  1. Identifying Untapped Market Segments: New-to-brand metrics can provide valuable insights into customer behavior and preferences. Businesses can uncover untapped market segments by analyzing the characteristics and demographics of customers who make new-to-brand purchases. This information can guide marketing and advertising strategies to target these specific segments, tailoring messages and campaigns to attract new customers more likely to engage with the brand.
  2. Assessing Competitive Positioning: New-to-brand metrics can also offer insights into a company’s competitive positioning. By comparing the percentage of new-to-brand orders and sales against competitors in the same industry, businesses can gauge their market penetration and identify areas for improvement. If the percentage of new-to-brand orders is lower than competitors, it may indicate a need to enhance brand awareness, expand marketing efforts, or improve product differentiation to attract new customers.
  3. Influencing Product Development: New-to-brand metrics can inform product development decisions by highlighting customer preferences and purchase patterns. By analyzing the new-to-brand units and sales metrics for different products, businesses can identify which products are more successful in attracting new customers. This information can guide product expansion or innovation strategies, focusing on developing new offerings that align with customer preferences and have a higher potential for attracting new customers to the brand.

Where Can These Metrics Be Found?

New-to-brand data has been available for Sponsored Brands campaigns since November 1, 2018. However, if a start date before November 1, 2018, is chosen, the new-to-brand metrics will be calculated based on November 1, 2018, as the starting point.

As for Sponsored Display, new-to-brand metrics have been available for Sponsored Display since May 1, 2021. These metrics are available for seller and vendor product targeting campaigns and seller and vendor audience targeting campaigns.

Amazon Brand Metrics Report Data Automation

Take control of your Amazon business with Openbridge, the solution that automates Amazon Brand Metrics API integrations and centralizes data storage in a unified data warehouse. Say goodbye to manual report downloads and errors in merging and tracking reports.

By leveraging automation, Openbridge eliminates the need for cumbersome manual downloads, ensuring you have up-to-date and accurate data directly from Amazon APIs. With data securely stored in a unified data warehouse such as Amazon Redshift, Amazon Redshift Spectrum, Google BigQuery, Snowflake, Azure Data Lake, and Amazon Athena, combining various Amazon reports becomes a breeze, allowing you to gain a comprehensive and holistic view of your business.

Experience the benefits of an automated and streamlined process that grants you access to all your crucial data in one trusted and private location. Empower your team to utilize best-in-class analytics and business tools like Google Data Studio, Tableau, Microsoft Power BI, Looker, or Amazon Quicksight.

Take action now and optimize your Amazon Seller or Vendor operations with Openbridge. Simplify your data management and unlock the full potential of your business insights.

Sign up for a 30-day free trial of our Amazon Advertising Brand Metrics Report automation.


Amazon Brand Metrics: Introducing New-To-Brand Analytics was originally published in Openbridge on Medium, where people are continuing the conversation by highlighting and responding to this story.


from Openbridge - Medium https://ift.tt/rDnYAyC
via IFTTT

Brand Analytics Amazon: Insights To Optimize Sales Performance

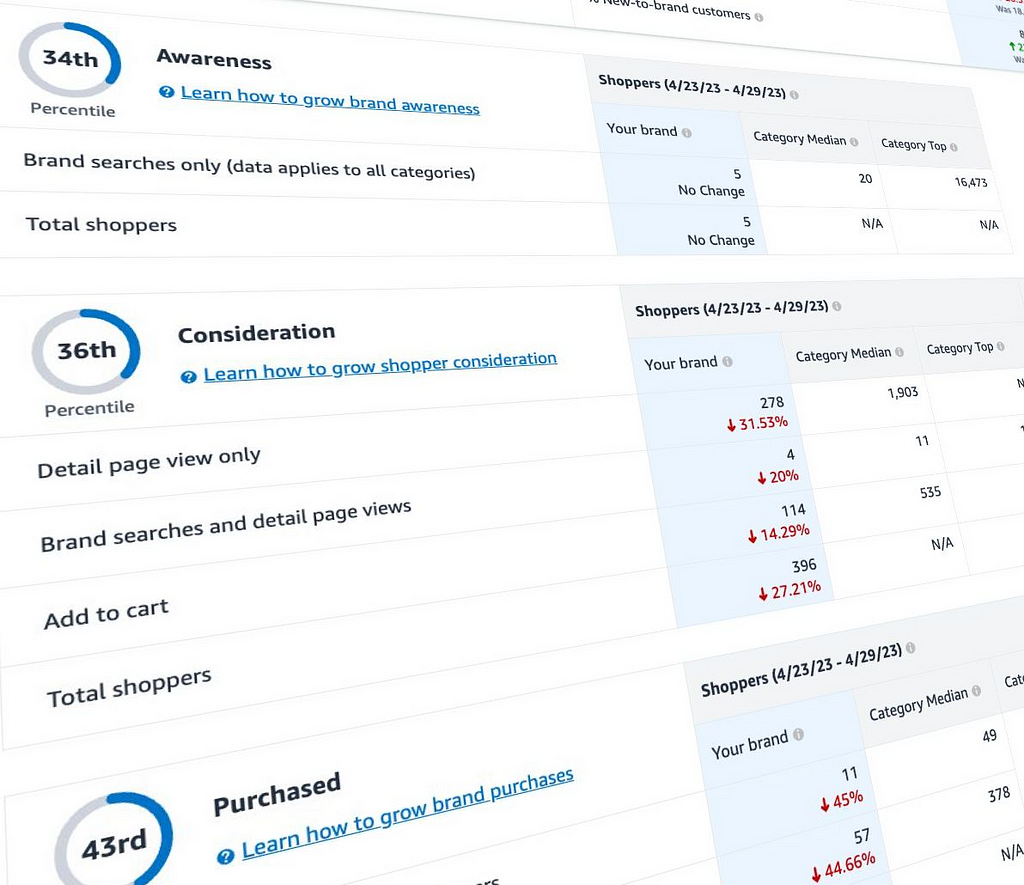
Brand Metrics provides a new measurement solution that quantifies opportunities for your brand at each stage of the customer journey in Amazon's store. Brands can understand the value of shopping engagements that impact sales in a journey.

Brand Metrics helps you:

  • Understand your brand performance. Brand metrics measure the number of actual on-Amazon shopper engagements.
  • Measure the impact of your upper and mid-funnel tactics and see how they contribute to shoppers moving through the purchase journey.
  • Evaluate engagement metrics to understand the value of your branded intent and how brand purchasers generate additional sales in the 12 months following purchase.
  • Monitor your performance relative to your category and peers at each stage of the purchase journey and over time.
  • Optimize your marketing and advertising efforts in Amazon's stores to engage more shoppers and build your brand.

The metrics offer critical insights for brands to understand the value of shopping engagements during the Amazon purchase process. The metrics allow you to measure historical sales following a consideration event or purchase.

What Brand Metrics Are Available?

Brand Metrics offer awareness and consideration indicators that compare performance against peers. Amazon also quantifies the number of customers in your awareness and consideration marketing funnel.

The metrics include all shopping engagements with your brand on Amazon, not just ad-attributed engagements. The following is a collection of metrics Amazon makes available:

  • engagedShopperRateLowerBound — Lower bound on the percentage of unique shoppers in a category that your brand has driven an engagement with or purchase from in the selected time frame divided by the total unique shoppers with 1+ detail page views in the selected category
  • engagedShopperRateUpperBound — Upper bound on the percentage of unique shoppers in a category that your brand has driven an engagement with or purchase from in the selected time frame divided by the total unique shoppers with 1+ detail page views in the selected category
  • engagedShopperRateCategoryMedianLowerBound — Lower bound on the percentage of unique shoppers in a category that your brand has driven an engagement with or purchased from in the selected time frame divided by the total unique shoppers with 1+ detail page view in the selected category for the median peers
  • engagedShopperRateCategoryMedianUpperBound — Upper bound on the percentage of unique shoppers in a category that your brand has driven an engagement with or purchase from in the selected time frame divided by the total unique shoppers with 1+ detail page view in the selected category for the median peers
  • engagedShopperRateCategoryTopPerformersLowerBound — Lower bound on the percentage of unique shoppers in a category that your brand has driven an engagement with or purchase from in the selected time frame by the total unique shoppers with 1+ detail page view in the selected category for the top 95th-99th percent of peers
  • engagedShopperRateCategoryTopPerformersUpperBound — Upper bound on the percentage of unique shoppers in a category that your brand has driven an engagement with or purchase from in the selected time frame divided by the total unique shoppers with 1+ detail page view in the selected category for the top 95th-99th percent of peers
  • customerConversionRate — percentage of shoppers moving from “considering” [Brand Name] in the [categoryNodePath] to “purchased” in the [lookBackPeriod]
  • customerConversionRateCategoryMedian — the percentage of shoppers moving from "considering" the peer median in the [categoryNodePath] to "purchased" in the [lookBackPeriod]
  • customerConversionRateCategoryTopPerformers — the percentage of shoppers moving from "considering" the average of the top 95th-99th percent of peers in the [categoryNodePath] to "purchased" in the l[lookBackPeriod]
  • newToBrandCustomerRate — share of customers that had not purchased [Brand Name] products in the last 12 months but did so in the [lookBackPeriod]
  • newToBrandCustomerRateCategoryMedian — share of customers that had not purchased peer median products in the last 12 months but did so in the [lookBackPeriod]
  • newToBrandCustomerRateCategoryTopPerformers — share of customers that had not purchased an average of the top 95th-99th percent of peers' products in the last 12 months but did so in the [lookBackPeriod]
  • brandedSearchesOnly — shoppers that searched for [Brand Name] but did not further engage or purchase from [Brand Name] and [categoryNodePath] in the [lookBackPeriod]
  • brandedSearchesCategoryMedian — shoppers that searched for the peer median but did not further engage or purchase from peer median and [categoryNodePath] in the [lookBackPeriod]
  • brandedSearchesCategoryTopPerformers — shoppers that searched for the avg. of the top 95th — 99th percent of peers and [categoryNodePath] but did not further engage or purchase from the Top Performers in the [lookBackPeriod]
  • viewedDetailPageOnly — shoppers that viewed detail page only of [Brand Name] in [categoryNodePath] in [lookBackPeriod]
  • viewedDetailPageCategoryMedian — shoppers that viewed the detail page only of peer median in [categoryNodePath] in [lookBackPeriod]
  • viewedDetailPageCategoryTopPerformers — shoppers that viewed the detail page only of avg. of the top 95th — 99th percent of peers in [categoryNodePath] in [lookBackPeriod]
  • viewedDetailPageOnlyReturnOnEngagement — The average number of sales per customer in this state 12 months ago drove over one year. Calculate by taking the total original population 12 months ago by the total sales this population moved over the last year for your brand in the selected category.
  • viewedDetailPageROECategoryMedian — The average sales of each customer in this state for the peer median 12 months ago drove over one year. Calculate by taking the total original population 12 months ago by the total sales this population moved over the last year for your brand in the selected category.
  • viewedDetailPageROECategoryTopPerformers — The average sales of each customer in this state for the 95–99 percent peers 12 months ago drove over one year. Calculate by taking the total original population 12 months ago by the total sales this population moved over the last year for your brand in the selected category.
  • brandedSearchesAndDetailPageViews — shoppers that searched brand and viewed the detail page of [Brand Name] in [categoryNodePath] in [lookBackPeriod]
  • brandedSearchesAndDetailPageViewsCategoryMedian — shoppers that searched brand and viewed the detail page of peer median in [categoryNodePath] in [lookBackPeriod]
  • brandedSearchesAndDetailPageViewsCategoryTopPerformers — shoppers that searched brand and viewed the detail page of avg. of the top 95th — 99th percent of peers in [categoryNodePath] in [lookBackPeriod]
  • brandedSearchesAndDetailPageViewsReturnOnEngagement — The average sales of each customer in this state 12 months ago drove over one year. Calculate by taking the total original population 12 months ago by the total sales this population drove over the last year for your brand in the selected category.
  • brandedSearchesAndDetailPageViewsROECategoryMedian — The average sales of each customer in this state for the peer median 12 months ago drove over one year. Calculate by taking the total original population 12 months ago by the total sales this population drove over the last year for your brand in the selected category.
  • brandedSearchesAndDetailPageViewsROECategoryTopPerformers — The average amount of sales each customer in this state for the 95–99 percent peers 12 months ago drove over one year. Calculate by taking the total original population 12 months ago by the total sales this population drove over the last year for your brand in the selected category.
  • addToCarts — shoppers that added [Brand Name] to the cart in [categoryNodePath] in [lookBackPeriod]
  • addToCartsCategoryMedian — shoppers that added the peer median to the cart in [categoryNodePath] in [lookBackPeriod]
  • addToCartsCategoryTopPerformers — shoppers that added the avg. of the top 95th — 99th percent of peers to the cart in [categoryNodePath] in [lookBackPeriod]
  • addToCartsReturnOnEngagement — The average sales of each customer in this state 12 months ago drove over one year. Calculate by taking the total original population 12 months ago by the total sales this population drove over the last year for your brand in the selected category.
  • addToCartsROECategoryMedian — The average sales per customer in this state for the peer median 12 months ago drove over one year. Calculate by taking the total original population 12 months ago by the total sales this population drove over the last year for your brand in the selected category.
  • addToCartsROECategoryTopPerformers — The average sales of each customer in this state for the 95–99 percent peers 12 months ago drove over one year. Calculate by taking the total original population 12 months ago by the total sales this population moved over the last year for your brand in the selected category.
  • brandCustomers — 0%-90% of sales contributing shoppers for [Brand Name] who purchased in [categoryNodePath] in [lookBackPeriod]
  • brandCustomersCategoryMedian — 0%-90% of sales contributors for the peer median who purchased in [categoryNodePath] in [lookBackPeriod]
  • brandCustomersCategoryTopPerformers — 0%-90% of sales contributors for avg. of the top 95th — 99th percent of peers who purchased in [categoryNodePath] in [lookBackPeriod]
  • brandCustomersReturnOnEngagement — The average sales of each customer in this state 12 months ago drove over one year. Calculate by taking the total original population 12 months ago by the total sales this population drove over the last year for your brand in the selected category.
  • brandCustomersROECategoryMedian — The average sales per customer in this state for the peer median 12 months ago drove over one year. Calculate by taking the total original population 12 months ago by the total sales this population drove over the last year for your brand in the selected category.
  • brandCustomersROECategoryTopPerformers — The average sales of each customer in this state for the 95–99 percent peers 12 months ago drove over one year. Calculate by taking the total original population 12 months ago by the total sales this population drove over the last year for your brand in the selected category.
  • high-value customers — top 10% of sales contributing shoppers for
  • highValueCustomersCategoryMedian — top 10% of sales contributing shoppers for peer median in [categoryNodePath] in [lookBackPeriod]
  • highValueCustomersTopPerformers — top 10% of sales contributing shoppers for the top 95th — 99th percent of peers in [categoryNodePath] in [lookBackPeriod]
  • highValueCustomersReturnOnEngagement — The average sales of each customer in this state 12 months ago drove over one year. Calculate by taking the total original population 12 months ago by the total sales this population drove over the last year for your brand in the selected category.
  • highValueCustomersROECategoryMedian — The average sales per customer in this state for the peer median 12 months ago drove over one year. Calculate by taking the total original population 12 months ago by the total sales this population drove over the last year for your brand in the selected category.
  • highValueCustomersCategoryTopPerformers — The average sales of each customer in this state for the 95–99 percent peers 12 months ago drove over one year. Calculate by taking the total original population 12 months ago by the total sales this population drove over the last year for your brand in the selected category.
  • awarenessIndex — Awareness Index measures actual on-Amazon audience signals reflecting awareness for your brand in the short and long term across the entire on-Amazon audience. The percentile lets you know how your brand's awareness activity compares to your peers.
  • considerationIndex — Consideration Index measures actual on-Amazon audience signals reflecting consideration for your brand in the short and long term across the entire audience. The percentile lets you know how your brand's consideration activity compares to your peers.
  • salesIndex — Sales Index represents actual on-Amazon sales in the short term and long term across the whole on-Amazon audience. The percentile lets you know how your sales compare to your peers.

Who Is Eligible For Amazon Brand Metrics?

Brand Metrics is available in beta to professional sellers enrolled in Amazon Brand Registry and vendors selling Amazon products in the following markets: United States, Canada, United Kingdom, Germany, France, Italy, Spain, and Japan. Please note that Brands with less than 20 orders a month will not have access to Brand Metrics.

Amazon Brand Analytics Report Data Automation

Openbridge allows Amazon sellers to streamline the data management process by automating Amazon Brand Analytics API integrations and storing data in a unified data warehouse. This service saves sellers time manually downloading reports and reduces errors in merging and tracking downloaded reports.

Automation eliminates manual download wrangling, ensuring up-to-date and accurate data straight from Amazon APIs. With data stored in a unified data warehouse like Amazon Redshift, Amazon Redshift Spectrum, Google BigQuery, Snowflake, Azure Data Lake, and Amazon Athena, you can combine different Amazon reports is easier to gain a more holistic view of the business.

The automated, streamlined process enables sellers to access all their important data in one private, trusted destination. Your team can then leverage best-in-class analytics and business tools like Google Data Studio, Tableau, Microsoft Power BI, Looker, or Amazon Quicksight.

Sign up for a 30-day free trial of our Brand Analytics Amazon Insights Report automation.


Brand Analytics Amazon: Insights To Optimize Sales Performance was originally published in Openbridge on Medium, where people are continuing the conversation by highlighting and responding to this story.


from Openbridge - Medium https://ift.tt/BCTUuN8
via IFTTT

Amazon Brand Metrics: Automated Reporting

Get direct, automated access to Amazon new to brand metrics, engagement, conversion, etc.

As an Amazon seller or vendor, understanding your brand’s performance at each customer journey stage is crucial to your success. Only recently, measuring this impact was challenging for many Amazon sellers and vendors. However, with Amazon Brand Metrics, a new measurement solution, sellers and vendors can better understand their brand’s performance on Amazon.

Why do Amazon Brand Metrics Matter?

Brand Metrics provides a comprehensive view of your brand’s performance on Amazon, allowing you to quantify opportunities at each stage of the customer journey. With the ability to access Awareness and Consideration indices, you can compare your performance to peers using models predictive of consideration and sales. As a result, Brand Metrics provide valuable insights into your brand’s performance and opportunities for improvement.

What are the benefits of using these metrics?

One of the most significant benefits of Brand Metrics is that it quantifies the number of customers in the awareness and consideration marketing funnel stages. This means that you can track and measure the impact of your brand on the customer journey, allowing you to optimize your marketing efforts and drive more sales.

Brand Metrics is built at scale to measure all shopping engagements with your brand on Amazon, not just ad-attributed engagements. This means you can gain insights into all interactions with your brand, including organic search results, product detail pages, and more. By capturing data from all shopping engagements, Brand Metrics provides a more accurate and comprehensive view of your brand’s performance on Amazon.

In addition to measuring shopping engagements, Brand Metrics include critical shopping engagements at each stage of the shopping journey, along with the Return on Engagement. This enables you to measure the historical sales following a consideration event or purchase, providing a clearer picture of the impact of your brand on the customer journey.

What metrics are available?

Amazon Brand Metrics offers access to various metrics that help you understand your brand’s performance at each customer journey stage. Below are some example metric types available in the data:

  • Customer Conversion Rate: This metric tells you the percentage of customers who convert after engaging with your brand. You can compare your conversion rate to the category median and top performers to see how you stack up against your competitors.
  • Engaged Shopper Rate: This metric measures the percentage of shoppers who engage with your brand after viewing your product. Like the conversion rate, you can compare your engaged shopper rate to the category median and top performers.
  • New-To-Brand Customer Rate: This metric tells you the percentage of new customers to your brand. It can help you understand how successful you are at acquiring new customers and building brand loyalty.
  • Branded Searches Only: This metric tells you how many customers searched for your brand specifically rather than using generic search terms. You can compare this to the category median and top performers to see how well your brand is recognized.
  • Viewed Detail Page Only: This metric measures the number of times customers viewed your product detail page without taking any further action. You can compare this to the category median and top performers to see if your product pages are engaging enough to convert viewers into customers.
  • Add to Carts: This metric tells how many customers added your product to their shopping cart. You can compare this to the category median and top performers to see if your product is competitive in converting viewers into buyers.
  • Brand Customers: This metric tells you how many customers are loyal to your brand. You can compare this to the category median and top performers to see how well your brand retains customers.
  • High-Value Customers: This metric tells you how many customers are high value, meaning they spend more than the average customer. You can compare this to the category median and top performers to see how well your brand appeals to high-value customers.

How to use Amazon Brand Metrics to optimize Advertising efforts?

Brand awareness in the category

Shoppers aware of your brand or products are those who searched for your brand but didn’t engage or make purchases from your brand in the selected timeframe and category.

These shoppers may engage with your brand in a different category from the one selected for your report. They may also be checking other brands and products. Driving engagement from these brand searches can help increase return on engagement.

Advertising strategies

  • Create a Sponsored Brands campaign and bid for the top of a search on branded terms.
  • Create a Sponsored Display campaign with product targeting. This can promote your product among relevant audiences browsing for products outside your category.
  • Create a Sponsored Display campaign and use prebuilt Amazon audiences across Lifestyles and Interests. This helps build brand recognition and engage relevant audiences. Your ads may appear across different pages, such as the Amazon homepage and product details pages. Your ads can also be configured to reach audiences off Amazon across third-party websites.

Shopping experience strategies

Create a Post for your brand. Posts are a way to share your brand content on Amazon at no cost and as often as you’d like.

Product listing optimizations

Check your product headlines and optimize the description to ensure customers can learn about your product while shopping.

Shopper consideration in the category

Shoppers who are considering your brand or product are grouped into one of 3 engagement types:

  1. Viewing your product detail page.
  2. Searching for your brand and visiting your product detail page.
  3. Adding an item from your brand to the cart.

As you review the return on engagement for each group of different engagement types, you’ll notice higher and lower values. The return on engagement for your brand will likely increase as shoppers with no explicit brand intent move from the detail page views only to brand searches.

The same occurs with shoppers with brand intent who move from detail page view to add to cart. This happens because both groups of shoppers are moving closer to purchase and are more likely to generate sales over the next 12 months.

Advertising strategies

Shopping experience strategies

  • Create a Store for your brand. Creating a Store is free, and no design experience is required. You can use predesigned templates to create a Store that fits your brand and spotlights your best-selling products.
  • Create a Post for your brand. Posts are a free way to share your brand content on Amazon.

Product listing optimizations

Brand purchases in the category

Customers who purchased from your brand are divided into two groups:

  1. Customers are purchasing from your brand.
  2. Customers who drive the top 10% of sales or customers who have chosen Subscribe & Save.

Increase value for your brand by helping to drive more sales, moving customers from single to repeat purchases, and increasing the percentage of new-to-brand customers.

Advertising strategies

Shopping experience strategies

  • Create a Store for your brand. Creating a Store is free, and no design experience is required. You can use predesigned templates to create a Store that fits your brand and spotlights your best-selling products.
  • Create a Post for your brand. Posts are a way to share your brand content on Amazon at no cost.

Product listing optimizations

  • Make sure that your products are in stock and ready to ship.
  • Set up Subscribe & Save to make it easier for customers to repeat purchases.

How to access the reports? Manual report downloads or API Automation?

Openbridge allows Amazon sellers and vendors to streamline the data management process by automating Amazon Brand Metrics report API integrations and storing data in a unified data warehouse. This service saves sellers time manually downloading reports and reduces errors in merging and tracking downloaded reports.

Automation eliminates manual download wrangling. Teams ensure they get up-to-date and accurate data from official, certified Amazon APIs. With data stored in a unified data warehouse like Amazon Redshift, Amazon Redshift Spectrum, Google BigQuery, Snowflake, Azure Data Lake, and Amazon Athena, you can combine different Amazon reports is easier to gain a more holistic view of the business.

The automated, streamlined process enables sellers and vendors to quickly access all their brand data in one private, trusted destination. Your team can then leverage best-in-class analytics and business tools like Google Data Studio, Tableau, Microsoft Power BI, Looker, or Amazon Quicksight.

Get Started Automating Amazon Brand Metrics — For Free

Whether you’re an Amazon seller or vendor, Brand Metrics provides a comprehensive view of your brand’s performance on the platform, enabling you to make data-driven decisions to improve your performance and stay ahead of the competition. Automation accelerates the speed at which your team can access this data and deliver insights-driven growth and profit.

Sign up for a 30-day free trial of our Amazon Brand Metrics Report automation.


Amazon Brand Metrics: Automated Reporting was originally published in Openbridge on Medium, where people are continuing the conversation by highlighting and responding to this story.


from Openbridge - Medium https://ift.tt/XipQhE9
via IFTTT

Amazon Fulfilled Shipments Report

Performance Insights For Fulfillment by Amazon

Are you an Amazon seller? If so, you may be interested to know about the Amazon Fulfilled Shipments Report.

What is the Amazon Fulfilled Shipments Report?

This handy report provides detailed information about the shipments of your products that Amazon fulfilled. It includes important details like the order number, shipment date, shipping method, number of items shipped, and destination. You may also see the cost of the shipment, any discounts applied, and the total revenue generated.

With the Amazon Fulfilled Shipments Report, tracking your sales and shipping activity has never been easier! This report provides valuable insights into the shipments of your products that Amazon fulfilled, helping you closely monitor your operations.

It is a helpful tool for keeping track of your sales and shipping activity and can also help you optimize your fulfillment operations. By analyzing the report’s information, you can identify areas for improvement and make changes to ensure everything is running smoothly.

What is included in the Amazon Fulfilled Shipments Report?

The report contains all completed shipments reported to FBA during the specified period. This may only include some items shipped during that time frame if they have yet to be reported to the Amazon system. Those items will be reported in a future period. The report includes order, shipment, and item data, including price and shipping address information. As of April 8, 2021, the Amazon Fulfilled Shipments report will no longer include Amazon customer names and street addresses.

  • Shipment dates are based on when the shipment was reported to the system, generally a few hours after the ship date. Other reports may calculate shipment dates differently. All dates are in GMT.
  • The report does not show customer phone numbers and addresses to comply with our privacy policies.
  • The system may cancel requests for older reports or more comprehensive date ranges.
  • If you have many orders, generating your report may take a while.
  • Specifying shorter date ranges can help your reports get generated faster.
  • This report is designed to provide information at the shipment level. If you would like to know which orders went out in a specific date range, please use the All Orders report.

How frequently is the report updated?

The report is updated shortly after an item is shipped, usually within a few hours. However, in some cases, the data may take up to 24 hours to be populated. This is important to keep in mind when reviewing your report, but for the most part, the information is up-to-date and reliable.

Automate the Amazon Fulfilled Shipments Report or manually download them?

Two primary methods for accessing this report; Automated or manual downloads. Downloading occurs in your account interface. Automation taps into the Amazon Selling Partner API to automate report processing and storage in a cloud warehouse or data lake.

Go Faster With Selling Partner API Report Automation

Openbridge allows Amazon sellers to streamline the data management process by automating Amazon-Fulfilled Shipments report API integrations and storing data in a unified data warehouse. This service saves sellers time manually downloading reports and reduces errors in merging and tracking downloaded reports.

Automation eliminates manual download wrangling, ensuring up-to-date and accurate data straight from Amazon APIs. With data stored in a unified data warehouse like Amazon Redshift, Amazon Redshift Spectrum, Google BigQuery, Snowflake, Azure Data Lake, and Amazon Athena, you can combine different Amazon reports is easier to gain a more holistic view of the business.

The automated, streamlined process enables sellers to access all their important data in one private, trusted destination. Your team can then leverage best-in-class analytics and business tools like Google Data Studio, Tableau, Microsoft Power BI, Looker, or Amazon Quicksight.

If You Want Spend Time Manually Downloading Reports

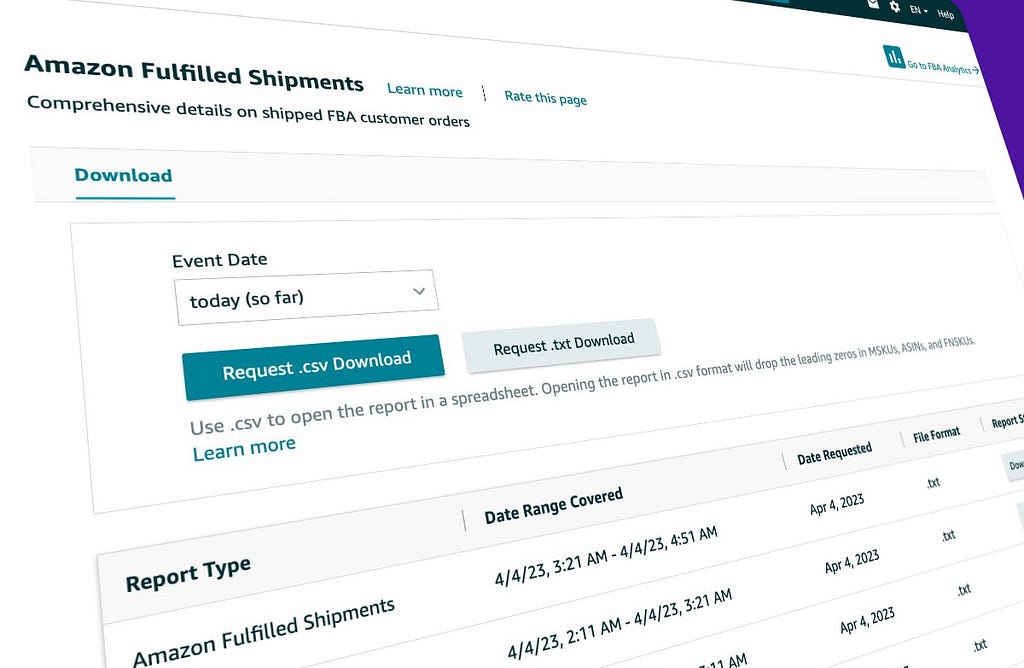
To request an Amazon-Fulfilled Shipments Report, follow the steps below:

  1. Click Amazon-Fulfilled Shipments found under Reports > Fulfillment.
  2. In the Event Date dropdown, select the number of prior days you would like to include. Select Exact Dates to set a specific time range. You can request up to one month of data in a single report.
  3. Click Request Report.

After you generate a report, you can pick up the report from a list of generated reports. Find the report you want to download on the Order Reports page in the Download Report section. If it is ready, a Download button will be available.

How to read manually downloaded Amazon-Fulfilled Shipments Report

After downloading the report, you can open it in any database or spreadsheet program, such as Microsoft Access or Microsoft Excel.

When you open the Amazon-Fulfilled Shipments report in a spreadsheet program like Microsoft Excel, you may encounter some issues with the text, depending on the language. If this happens, don’t worry! You can easily resolve the problem by opening the file with a UTF-8-compatible reader.

One option is the Excel Import Wizard, which allows you to select the File Origin. Choose “65001: Unicode (UTF-8),” and the text will display properly, without any garbled characters.

While this may seem like a small issue, it’s important to be aware of it to view the report accurately and effectively. Using a UTF-8-compatible reader or the Excel Import Wizard with the correct file origin, ensure that the text in the Amazon-Fulfilled Shipments reports displays correctly.

Get Started Automating Amazon Fulfilled Shipments Report — For Free

If you’re an Amazon seller looking to improve your game, the Amazon Fulfilled Shipments Report is worth checking out. It’s user-friendly and provides valuable insights to help you take your business to the next level.

You can ditch the legacy manual report downloads for code-free Amazon SP-API automation. Openbridge offers official SP-API data automation, one of the most powerful tools Amazon Sellers can tap into. Accelerate the speed at which your team can gain valuable insights to deliver data-driven growth and profit.

Sign up for a 30-day free trial of our Amazon Fulfilled Shipments Report automation.


Amazon Fulfilled Shipments Report was originally published in Openbridge on Medium, where people are continuing the conversation by highlighting and responding to this story.


from Openbridge - Medium https://ift.tt/wVOCuSm
via IFTTT

Amazon Advertising Flywheel: How to Accelerate Your E-commerce Growth

Amazon Flywheel

Using a data-driven approach to fuel a successful Amazon Flywheel strategy

The Amazon Advertising Flywheel is a business model that describes how Amazon’s advertising services can drive growth for businesses that sell on Amazon. As a concept, it can be a powerful tool for e-commerce businesses looking to drive growth.

By understanding and utilizing the principles of the Flywheel, businesses can create a positive customer experience, drive customer loyalty, and increase sales.

The Amazon Flywheel Model

Let’s let Mr. Bezos flywheel describe the flywheel strategy;

“We’re not just trying to be the biggest company in the world. We’re trying to be the company that is the most customer-centric and the most customer-obsessed in the world.” — Jeff Bezos

This quote from Jeff Bezos highlights Amazon’s focus on using its Flywheel strategy to be customer-centric and customer-obsessed. It defines a business model that creates a virtuous growth cycle by constantly improving the customer experience.

So what are the critical elements of an Amazon Flywheel strategy? The Amazon Flywheel model consists of three main components:

  1. low prices
  2. fast delivery
  3. a wide selection of products

A business can attract customers by improving these three elements, allowing them to negotiate better deals with suppliers and invest in more efficient logistics.

This creates a positive feedback loop, where each improvement leads to even more customers, and so on. This is the virtuous cycle that Amazon aims to achieve and maintain, hence the name Amazon Flywheel model.

How does the Amazon Flywheel apply to retailers?

You might say, “Yea, it works for Amazon because it’s Amazon! How does this fit for a retailer my size?”

Putting the Flywheel into a non-Amazon context is essential since the goal is to embrace the concept of the Flywheel within your own operations.

  1. Customer experience: Small retailers can focus on providing an excellent customer experience by offering personalized service, fast shipping, and easy returns. Often small retailers can use this as a critical point of differentiation because they can be nimble and personal.
  2. Selection: Small retailers may not be able to offer a wide array of products, but they are not a market. A Smaller retailer can focus on a core set of exceptional products which delight customers, scaling demand and allowing a retailer to expand product lines/offerings. The key is you have a product line that delivers value to customers and “keep coming back.”
  3. Value prices: Small retailers can offer more value by offering fair prices for high-quality products. Coupled with first-class support, value-driven prices attract and retain customers.
  4. Advertising: Small retailers can use various online advertising platforms, like Amazon or Google, to efficiently reach the right customers, communicate their brand value, drive product awareness, and increase sales.

Amazon has the reach that drives scale

Amazon Advertising has a large audience size and reach, as it is one of the largest e-commerce platforms in the world. It has a wide range of targeting options for businesses to reach their desired audience and a variety of ad formats to choose from.

  • Audience size: Amazon has over 310+ million active customer accounts worldwide and more than 175+ million monthly unique visitors to its websites. This provides a vast audience for businesses to reach, which can help to increase their visibility and drive sales.
  • Reach: Amazon Advertising allows businesses to target customers across various devices, including desktop computers, mobile devices, and smart TVs. Advertisers can also reach audiences across multiple Amazon websites and apps, including Amazon.com, Amazon Fresh, and Amazon Prime Video, providing various platforms to reach different audiences.

Through the Amazon Advertising platform, businesses can reach an audience outside of Amazon through audience targeting options, such as external website browsing data and off-amazon conversion tracking. This allows businesses to reach customers beyond Amazon’s ecosystem and expand their audience reach.

Amazon Advertising Product Mix

The Ads platform comprises six main elements: Sponsored Products, Sponsored Brands, Sponsored Display, Amazon Attribution, Amazon DSP, and Amazon Stores.

  • Sponsored Products are text-based ads that appear in search results, product pages, and other relevant pages on Amazon. They are designed to help businesses drive more sales by making their products visible to potential customers.
  • Sponsored Brands are a type of display ad that feature a company’s logo and multiple products. These ads are designed to create brand awareness and help drive more sales by providing customers with a visual representation of the company’s product offerings.
  • Sponsored Display is a highly targeted advertising solution allowing businesses to reach customers across Amazon’s websites, apps, and third-party websites through the Amazon Advertising Platform.
  • Amazon Attribution is a measurement tool that helps businesses understand the customer journey and how their ad campaigns impact sales. This allows businesses to get a complete view of how their ads are performing and how to improve their performance by providing cross-channel attribution, customer journey analytics, and actionable insights.
  • Amazon DSP (Demand-Side Platform) is a programmatic advertising solution that allows businesses to programmatically buy and manage display, video, and audio ad inventory on the Amazon Advertising Platform and other third-party websites; it allows for even more targeting and reaches for a business’s advertising campaigns.

Multiple Ad Platforms For Sellers & Vendors

An advertiser can use Amazon Advertising and Google Ads to reach customers across multiple channels and platforms. Here are a few ways an advertiser can use both platforms to increase their visibility and drive sales:

  1. Synchronize audiences: An advertiser can use customer data from their Google Ads account to create lookalike audiences in Amazon Advertising. This allows them to reach new customers similar to their existing customer base.
  2. Utilize remarketing: An advertiser can use remarketing lists from Google Ads to create similar audiences in Amazon Advertising. This allows them to reach customers who have previously interacted with their brand across both platforms.
  3. Cross-promote: An advertiser can use Google Ads to promote their Amazon store or specific products and use Amazon Advertising to drive traffic to their website or other online platforms. This allows them to reach customers across multiple channels and increase visibility.
  4. Use different ad formats: Google Ads offers various ad formats such as search ads, display ads, and video ads, while Amazon Advertising mainly offers product ads, sponsored products, and sponsored brands; utilizing different ad formats in different platforms can appeal to different customers.
  5. Measure and optimize: An advertiser should track and measure the performance of their campaigns on both platforms and optimize accordingly. This allows them to identify which campaigns drive the most sales and adjust their strategy accordingly.

Amazon Advertising has different features and targeting options than Google Ads, so it’s essential to understand each platform’s strengths and limitations and how they can be used together to achieve the advertiser’s goals. Combining both platforms can be beneficial for an advertiser to increase brand visibility, reach new customers and drive sales. Still, it also requires a proper plan and strategy for the best results.

Amazon Flywheel Case Study

The first Amazon Advertising Flywheel case study is about a company that sells outdoor gear and apparel. The company used Sponsored Products to drive more sales and increase product visibility. As a result, the company saw a significant increase in sales and was able to invest in building brand awareness through Sponsored Brands.

They also added Sponsored Display to reach a wider audience, drive more sales, and increase brand awareness. They utilized Amazon Attribution to gain insights into the customer journey and measure the campaign performance. This virtuous growth cycle helped the company become one of the top sellers in the outdoor gear and apparel category on Amazon.

Another example of the Amazon Advertising Flywheel is a home goods e-commerce store. They used Sponsored Products to drive more sales and increase visibility for their products, and in doing so, they were able to increase their sales by over 50%.

They then used those increased sales to invest in Sponsored Brands to build brand awareness and increase customer loyalty. They also implemented Sponsored Display, reaching more customers and increasing their sales by 25%. They also used Amazon Attribution to gain insights, measure their campaign performance, and improve it, allowing them to continue growing their business on Amazon.

A third example of the Amazon Advertising Flywheel in action is a fashion e-commerce store. They used Sponsored Products to drive more sales and increase product visibility. As a result, the company saw a significant increase in sales and was able to invest in building brand awareness through Sponsored Brands and reach a wider audience with Sponsored Displays.

They also used Amazon Attribution to measure their campaign performance and gain insights, which allowed them to make data-driven decisions and improve their campaigns, leading to further business growth. They also leveraged Amazon DSP and Amazon Stores to reach their audience further, improve customer experience, and build brand awareness.

Using Data to Unlock the Amazon Flywheel

Amazon offers data to help any e-commerce business with the information needed to fuel the strategies outlined in the Amazon Advertising Flywheel. Rather than manual data wrangling data files, Amazon APIs can provide businesses with the tools they need to automate and optimize their advertising campaigns on Amazon.

When sellers and vendors can automate repetitive and time-consuming tasks, they can focus on using data for optimizing business performance. Using code-free, pre-built connectors for various advertising platforms like Google, Facebook, and Amazon DSP allows businesses to have a unified view of their data.

Unified data allows teams large and small to employ advanced analytics and visualization tools like Tableau, Power BI, Looker, and many others better to understand their customers and their campaigns’ performance. This includes tracking and analyzing website traffic, conversion rates, customer engagement, and retention.

Consistently investing in the elements of the Flywheel, e-commerce businesses can create a virtuous cycle of growth, where they can attract and retain customers and generate more revenue, which they can reinvest in their offerings and advertising to continue growing their business on Amazon.

Getting Started with Amazon Automation

Openbridge can help sellers and vendors execute Flywheel’s strategies by providing code-free, fully-automated Amazon API data integration and management capabilities.

Amazon automation for data allows businesses to unify and consolidate from multiple sources, including Amazon, and use that data to gain insights and make data-driven decisions about their advertising campaigns. This includes tracking and measuring the performance of their campaigns using Amazon Attribution and generating actionable insights to optimize them.

Try today, and get an Amazon Automated Data Feeds 30-day Free Trial.


Amazon Advertising Flywheel: How to Accelerate Your E-commerce Growth was originally published in Openbridge on Medium, where people are continuing the conversation by highlighting and responding to this story.


from Openbridge - Medium https://ift.tt/eb5E9FB
via IFTTT