Data-Driven Amazon TACoS Insights

TACos Amazon

Harnessing the Power of Your Amazon Data in TACoS Strategies

Total Advertising Cost of Sales (TACoS) is a key metric used in e-commerce and digital marketing, especially in platforms like Amazon, to assess the impact of advertising spend on overall sales revenue. To effectively utilize TACoS, tapping into data from Amazon Ads, Seller Central, and Vendor Central is a must.

This post details how an Amazon business (Amazon Seller or Vendor) can use data from these sources to analyze TACoS and other Key Performance Indicators (KPIs). This includes the interplay of ad campaigns and organic traffic so you can craft an effective data-driven strategy that optimizes advertising efforts, profit margin, and total ad spend.

TACoS and Organic Sales & Traffic

The relationship between organic ranking on Amazon (or other platforms) and Total Advertising Cost of Sales (TACoS) is often not well understood.

Generally speaking, advertising plays a pivotal role in boosting product visibility, which in turn can enhance organic rankings. This improvement is primarily due to increased sales velocity — a key factor for better organic rankings on platforms like Amazon. As products gain higher visibility through ads and achieve more sales, they naturally start to rank higher in organic search results.

Effective advertising (Sponsored Product, Sponsored Brand, Sponsored Display, Sponsored Video) can improve visibility in organic rankings.

As the organic rankings improve, there is a flip side. When a product’s organic ranking improves, its reliance on paid advertising can decrease. This shift is reflected in the TACoS metric: a lower TACoS indicates a higher proportion of organic sales in the total sales mix.

This means a successful organic ranking can reduce the need for proportional ad spending, leading to a more cost-effective sales strategy. This is why using TACoS as a KPI is important.

  • Direct vs. Indirect Impact: TACoS doesn’t directly measure organic sales or traffic, but it indirectly influences them. A well-executed advertising strategy (reflected in a balanced TACoS) can boost brand awareness and market presence, which in turn can lead to increased organic sales and traffic.
  • Catalyst for Organic Growth: Effective advertising can introduce new customers to the brand. Satisfied customers might return for repeat purchases organically, thereby reducing future dependence on paid advertising and potentially lowering the TACoS.
  • Long-Term Brand Building: A strategic approach to advertising, even with a temporarily high TACoS, can contribute to long-term brand building. As the brand becomes more recognized and trusted, organic sales and traffic are likely to increase.

The result is a beneficial feedback loop — increased organic sales can lead to reinvestment in targeted advertising, further enhancing visibility and sales, while a decrease in TACoS can indicate effective organic growth strategies.

ACoS vs ROAS vs TACoS Amazon Advertising

Return on Advertising Spend (ROAS), Advertising Cost of Sales (ACoS), and Total Advertising Cost of Sales (TACoS) are KPI metrics in analyzing the effectiveness of advertising campaigns, especially for Sellers and Vendors using Amazon Advertising.

Here’s a breakdown of each metric:

ROAS Calculation (Return on Advertising Spend):

  • Definition: ROAS measures the gross revenue generated for every dollar spent on advertising. It’s a metric used to understand advertising campaigns’ effectiveness in revenue generation.
  • Calculation: ROAS is calculated by dividing the revenue generated from advertising by the cost of the advertising.
  • Formula: ROAS=Revenue from AdsCost of AdsROAS=Cost of AdsRevenue from Ads​
  • Interpretation: A higher ROAS indicates a more effective advertising campaign. It directly shows how much revenue is earned for each dollar spent.

ACoS Calculation (Advertising Cost of Sales):

  • Definition: ACoS is a metric used primarily on Amazon and similar e-commerce platforms. It measures the cost of advertising relative to the sales explicitly generated from those advertisements.
  • Calculation: ACoS is calculated by dividing the cost of advertising by the sales generated from advertising.
  • Formula: ACoS=Cost of AdsSales from Ads×100%ACoS=Sales from AdsCost of Ads​×100%
  • Interpretation: A lower ACoS is typically desirable, as it indicates that the advertising is more efficient (i.e., less cost for more sales). It’s beneficial for understanding the direct profitability of advertising campaigns.

TACoS Calculation (Total Advertising Cost of Sales):

  • Definition: TACoS measures the advertising cost relative to the total sales, including organic and ad-driven sales. It offers a broader view of how advertising affects overall sales.
  • Calculation: TACoS is calculated by dividing the total advertising spend by the total sales (both organic and advertising-generated).
  • Formula: TACoS=Total Advertising SpendTotal Sales×100%TACoS=Total SalesTotal Advertising Spend​×100%
  • Interpretation: TACoS helps in understanding the impact of advertising on the entire business. Unlike ACoS, which focuses solely on ad-generated sales, TACoS provides insight into how advertising influences overall sales, including organic sales.

Comparison:

  • ROAS is a general advertising metric applicable across different platforms and industries. It’s best for measuring the direct return on investment from ad campaigns.
  • ACoS is specific to e-commerce platforms like Amazon. It’s used to assess the efficiency of advertising in driving sales. It benefits sellers and marketers who need to understand the direct profit from their advertising on these platforms.
  • TACoS provides a more holistic view of advertising’s role in the overall sales strategy. It’s beneficial for long-term strategic planning, understanding the impact of advertising on total sales, and balancing advertising with other sales and marketing efforts.

Why use TACoS?

The advertiser should extend some of their focus (if you haven’t already) from ACoS and ROAS to TACoS. There are several reasons, but it is vital to understand ad investments’ overall effectiveness and impact on an e-commerce business. Here are key reasons why TACoS should be in the mix with ACoS and ROAS :

  1. Holistic View of Business Performance: TACoS measures the impact of advertising spending against the total revenue of the business, not just the revenue generated from ads. This offers a broader perspective on how advertising influences overall sales, including organic sales.
  2. Balancing Organic and Paid Sales: TACoS helps businesses understand the balance between organic and paid sales. A high ACoS might indicate effective ad-driven sales but could overshadow the status of organic sales. TACoS provides insight into how advertising contributes to overall business growth, including non-ad-driven sales.
  3. Long-Term Growth Strategy: TACoS is more aligned with long-term growth strategies. It considers the business’s overall health, factoring in how advertising contributes to brand awareness and market penetration, which may not immediately translate into direct sales but are crucial for long-term success.
  4. Efficient Resource Allocation: By focusing on TACoS, businesses can make more strategic decisions about allocating resources between advertising and other growth initiatives. It ensures that advertising budgets are being used effectively in the context of the business’s total sales performance.
  5. Adjusting for Market Dynamics: TACoS is less sensitive to short-term market fluctuations than ACoS or ROAS. It provides a more stable metric for evaluating the effectiveness of advertising strategies over time, making it suitable for adjusting long-term business plans.
  6. Branding and Market Presence: Investments in advertising to build brand recognition or capture market share might not yield immediate sales (thus potentially lowering ROAS or increasing ACoS). Still, they contribute to the overall market presence. TACoS accounts for these strategic investments.
  7. Comprehensive Marketing Insights: TACoS gives a comprehensive picture of the marketing funnel. It accounts for all stages of the customer journey, not just the final conversion, offering insights into how advertising influences customer behavior from awareness to purchase.

While ACoS and ROAS are crucial for understanding advertising campaigns’ direct profitability and efficiency, including TACoS in your metrics toolkit, you gain a more inclusive view of how advertising expenditures affect the entire spectrum of business sales. TACoS reflects a metric to help provide insights into whether a business is on a sustainable growth path, has strong market positioning, and realizes long-term brand development goals.

Based on the company, its goals, industry norms, and growth stage, it is crucial to develop insights into what constitutes an effective TACoS, the implications of a high TACoS, and how TACoS affects ad sales, overall revenue, and organic sales.

What is a Good TACoS?

TACoS is not a one-size-fits-all metric. It is a KPI that will depend on a company’s products, goals, and market dynamics.

The key is to balance TACoS with overall business objectives, aiming for a level that supports sustainable growth, brand development, and a healthy mix of organic and paid sales.

  • Depends on Business Objectives: For a business focused on aggressive growth or market penetration, a higher TACoS may be acceptable as it implies reinvestment in advertising to capture market share. For more established businesses or those prioritizing profitability, a lower TACoS might be preferable.
  • Industry Benchmarks: It’s also important to compare TACoS with industry averages. What’s considered good in one industry might be high in another.

Let’s explore an example of a high and low TACoS in the context of selling Apple iPads and watches. For simplicity, we’ll use hypothetical numbers.

High TACoS Example

Suppose Apple Inc. retailer $20,000 on advertising Apple iPads in a month.

  • Total Sales Revenue: In the same month, the total sales revenue (including both organic and ad-driven sales) for Apple iPads is $80,000.

TACoS Calculation:

  • TACoS=$20,000/$80,000×100%=25%

A TACoS of 25% is relatively high. This implies that a significant portion of the total sales revenue is being consumed by advertising costs.

Low TACoS Example

In a different situation, let’s say the Apple spends $5,000 on advertising Apple watches.

  • Total Sales Revenue: The total sales revenue for the month is $100,000.

TACoS Calculation:

  • TACoS=$5,000/$100,000×100%=5%

A TACoS of 5% is relatively low. This suggests that the Apple’s total sales are less reliant on advertising spend for the watch, indicating a strong organic sales performance, a highly efficient advertising strategy, or both!

Regular analysis and adjustment of advertising strategies based on TACoS can help businesses optimize their marketing efforts and grow more effectively.

Benefits Of Data-driven TACoS Insights

To harness the opportunity, Amazon Sellers and Vendors need to continuously monitor, analyze, and adjust their advertising strategies to stay informed about market trends and Amazon platform changes.

Overcoming the challenges of achieving a reasonable Advertising Cost of Sale (ACoS) on Amazon involves a strategic approach that leverages technology and data analytics. Here are some recommendations focusing on the use of Amazon Ads API, analytics tools, and integrating cloud data warehouses or data lakes:

Utilizing Amazon Ads API for Automation and Efficiency

  • Automate Bid Adjustments: Use the Amazon Ads API to understand trends and behaviors based on performance data. This can help optimize your campaigns based on data-driven insights, ensuring competitive bids without overspending.
  • Custom Reporting and Analysis: Develop custom reporting tools using the API to gather more granular data than what is available through Amazon’s default reporting. This can help identify specific areas for improvement.
  • Bulk Operations: Leverage the API for bulk operations to unify Sponsored Brands, Sponsored Products, and campaign data, saving time and ensuring a more holistic approach to campaign insights.
  • Performance Tracking: Employ analytics tools like Looker Studio, Tableau, Microsoft Power BI, Amazon QuickSight, SAP, Alteryx, dbt, Azure Data Factory, Qlik Sense, and many others to create insights that highlight key performance indicators (KPIs) such as TACoS, ROAS, ACoS, click-through rates (CTR), conversion rates, overall sales, and many more. This will help your team in understanding the effectiveness of your ads.
  • Testing: Use these tools to perform testing on different aspects of your ads (like keywords, ad copy, or images) to see what resonates best with your audience.
  • Customer Insights: Analyze customer behavior and preferences. Understanding your target audience can help you tailor your ads more effectively.

Integrating Cloud Data Warehouses or Data Lakes

  • Unified Data Repository: Use industry-leading data lake, data lakehouse, or cloud warehouses like Databricks, Amazon Redshift, Amazon Redshift Spectrum, Google BigQuery, Snowflake, Azure Data Lake, Ahana, and Amazon Athena. Consolidate data from various sources (Amazon sales data, advertising data, external market trends) for a holistic view.
  • Historical Data Analysis: Unified data that you control means you can efficiently analyze historical data, even when that data is no longer available from Amazon, to identify patterns and trends. This can inform your strategy for inventory management, budget allocation, and bidding strategies.
  • Scalability and Flexibility: Cloud solutions offer scalability and flexibility in handling large volumes of data, essential for comprehensive analysis and businesses with fluctuating data loads.
  • Advanced Analytics and Machine Learning: Implement advanced analytics and machine learning models to predict market trends, optimize pricing strategies, and forecast demand, which can directly impact ACoS.

Decision Making

  • Segmentation and Targeting: Utilize data to segment customers and target your ads more precisely. This can improve conversion rates and reduce wasted ad spend.
  • Real-Time Data Processing: Use real-time data processing to adapt quickly to market changes. This agility can be crucial for maintaining optimal ACoS in a dynamic marketplace.

Regular Review and Optimization

  • Continuous Monitoring: Regularly monitor campaign performance and adjust as needed. Stay agile and responsive to data insights.
  • Learning from Successes and Failures: Analyze successful and unsuccessful campaigns to understand what works and doesn’t.

Get Started

No more manual file downloads to calculate TACoS, ROAS, ACoS, and other Amazon KPIs.

Openbridge is an easy-to-use, fully-automated data automation to quickly streamline your workflow to collect, catalog, and unify your data to industry-leading cloud data warehouses and lakes. Unify Amazon data quickly with code-free pipelines so you can use your favorite analytic tools today.

Get a 30-day free trial of the code-free Openbridge data integration for Amazon Advertising, Amazon Selling Partner, and Amazon Vendor Central.


Data-Driven Amazon TACoS Insights was originally published in Openbridge on Medium, where people are continuing the conversation by highlighting and responding to this story.


from Openbridge - Medium https://ift.tt/Bm6bqwy
via IFTTT

Amazon Brand Lift and Amazon Brand Metrics: Growth Toolkit

Take advantage of Amazon Ads brand building insights data to drive sustainable growth

Building a strong brand, especially on Amazon, is a journey that combines strategy, creativity, and consistent customer engagement.

While pushing product sales is important, losing sight of the broader “brand” picture can be a detriment to that lower funnel sales effort.

Why Care About Brand Building On Amazon

Successful brands stand out not only by reaching their audience but by forging lasting connections. To accomplish this brand leaders use a blend of effective interaction, messaging, and a deep understanding of customer experiences.

Brand relevance is often a crucial and deciding element of the purchase process. As a result, brand marketing is one of the key tools for connecting with audiences, shaping perceptions, and storytelling.

Amazon offers a suite of tools to facilitate this, including Amazon Sponsored Ads (Sponsored Brand, Sponsored Product, Sponsored Display), Amazon DSP, Amazon Attribution, and Amazon Shoppers Panel

By leveraging these capabilities, brands can effectively measure and boost their presence on Amazon, leading to increased customer loyalty and sales growth.

For those interested in brand building on Amazon, they offer a couple of innovative, data-driven solutions; Amazon Brand Metrics and Amazon Brand Lift. While both offer an understanding into the performance of your investments across those Amazon capabilities, they serve different purposes.

Amazon’s Brand Metrics

A self-service solution, Amazon Brand Metrics insights data offers brands of all sizes insights into customer engagement and shopping behaviors on Amazon.

The insights data extends beyond simple ad-attributed reporting, enabling brands to quantify and optimize their performance based on shopping engagements predictive of actual sales.

Brand metrics facilitates a deeper understanding of the customer journey from initial awareness to loyalty, supporting long-term brand engagement strategies.

Examples of Brand Metrics

Brand metrics provide visibility into whether an ad-attributed purchase was made by an existing customer or a new buyer for the brand’s product on Amazon within a year. Advertisers has access to information like:

  • Total new-to-brand purchases and sales: Understand the overall impact of your campaigns on acquiring new customers and generating sales from them.
  • New-to-brand purchase rate: Measure the percentage of ad-attributed purchases made by new customers. This metric helps you assess the efficiency of your campaigns in attracting new buyers.
  • Cost per new-to-brand customer: Determine the average cost of acquiring a new customer through your advertising efforts. This metric is crucial for optimizing your budget allocation and maximizing ROI.

With these and other new-to-brand metrics, advertisers can make informed decisions about their marketing strategies, identify the most effective channels and tactics for acquiring new customers, and allocate their resources more efficiently.

Amazon Brand Metrics: Introducing New-To-Brand Analytics

Amazon Brand Lift Study

Accessible through the Amazon DSP console, Amazon Brand Lift studies allow advertisers to launch studies for fast, reliable insights. Amazon Brand Lift is powered by the Amazon Shopper Panel, an invitation-only, opt-in program that surveys at least 1,000 participants.

Amazon Brand Lift uses real feedback from people who shop on Amazon and are exposed to your ads to figure out how well your ads are working. For example, they might ask customers if they’ve seen your ads before, if they know your brand, or if they’re interested in buying something from you. By looking at this data, Amazon can give you a more accurate picture of how your ads are impacting your brand.

These studies measure the impact of ad campaigns, comparing the responses of an ad exposed group to a control group, providing insights into brand perception and loyalty shifts.

Brand Lift: Study the impact of your advertising

Do Brand Building Efforts On Amazon Deliver Results?

The impact of brand building efforts on Amazon is measurable. A study focusing on apparel, shoes, and handbags revealed that brands reaching new shoppers with awareness campaigns achieved incremental growth. Key findings include:

  • New-to-Brand Shoppers: Fashion brands using Amazon Ads for awareness campaigns saw a 19% increase in new-to-brand shoppers.
  • Repeat Purchases: These new shoppers had a 12% higher likelihood of making repeat purchases within the year.
  • Value Lift: There was a 20% lift in value when comparing new-to-brand customers acquired during campaign periods to those who came in the absence of advertising.
  • Increased ROAS: Advertisers using a combination of Sponsored Brands video, Store spotlight, and custom image ad formats saw a 5.5% increase in return on ad spend.
  • Higher Conversion Rate: A 57.8% increase in conversion rate was observed for advertisers using both Sponsored Brands custom image and Store spotlight ad formats.
  • CTR Improvement: The use of the Sponsored Brands video ad format led to a 108.1% increase in click-through rate.

Data-driven Brand Insights: Optimize The Customer Journey

Knowing brand building efforts on Amazon can deliver results, Amazon provides provides a broad collection of metrics and accurate data that is instrumental in measuring and enhancing brand awareness.

  1. Quantitative Insights: Provides quantifiable metrics on shopping engagements, offering a clearer picture of how customer interactions translate into sales.
  2. Performance Optimization: Brands can use these insights to refine their marketing strategies, both paid and organic, leading to more effective campaigns.
  3. Competitive Analysis: Brand Metrics allows brands to monitor their performance relative to their categories, offering a valuable benchmarking tool.
  4. Long-Term Value Measurement: The suite of awareness and consideration metrics within Brand Metrics helps brands measure the long-term value of customer engagement.
  5. Deeper Engagement Insights: By analyzing sales over a 12-month period, brands gain insights into the effectiveness of their strategies in fostering customer loyalty.

By measuring the impact of your upper- and mid-funnel tactics, you can see how shoppers are interacting with your brand throughout the marketing funnel. This enhanced visibility empowers advertisers to measure the true impact of their campaigns on customer acquisition and growth.

For data-driven organizations, the insights Amazon delivers allows your team to have the information needed to to evaluate the value of shopping engagements by looking at sales generated over a 12-month lookback period.

Refine Your Marketing Channels

With insights in hand, teams can make choices on how best to optimize organic marketing and advertising efforts off Amazon, on an Amazon’s store, or in ads to engage more shoppers and build your brand.

The insights can help inform investments more broadly;

  • Email Marketing Enhancements: By tracking the shopper engagement rate from Amazon, you might focus on creating emails that drive more consideration events or purchases, adjusting your content to better engage your audience.
  • Digital Marketing Refinement: Understanding the customer conversion metric can guide you in fine-tuning your digital ads, targeting actions like detail page views or ‘Add to Cart’ clicks to boost conversions.
  • Social Media Strategy Adjustments: If you’re noticing a difference in new-to-brand sales through your Amazon-driven social media posts, it could indicate a need to shift your content to attract more first-time buyers.
  • Website Analytics Strategy: Incorporating insights on branded searches can help in optimizing your website to convert shoppers who have researched your brand but haven’t yet made a purchase.
  • Content Marketing Evolution: By considering the awareness and consideration indexes from Amazon, you can tailor your blog posts and content to better align with the factors that lead to consideration and sales.
  • Video and Streaming TV Ad Optimization: Evaluating the purchase segment data can inform changes to your video content, targeting brand customers, one-time purchasers, and the most engaged shoppers to maximize impact.
  • Sales Approach Enhancement: Insights into different shopper segments — like repeat customers or Subscribe & Save users — can refine your sales team’s approach, focusing on retention strategies or upselling to your most loyal customers.
  • Revenue Focused Adjustments: Understanding the dynamics of new-to-brand sales and branded searches can help you decide where to focus your efforts for maximum revenue generation through Amazon.
  • SEO Strategy Refinement: Integrating shopper engagement and conversion metrics from Amazon into your SEO efforts can guide you to optimize for keywords and content that lead to higher engagement and conversion rates.

The process becomes cyclical as you monitor your performance relative to your category and peers at each stage of the purchase journey.

Getting Started With Amazon Brand Analytics Automation

Say goodbye to manual report downloads and errors in merging and tracking reports. Openbridge eliminates the need for cumbersome manual downloads, ensuring you have up-to-date and accurate data directly from Amazon APIs.

> Sign up for a 30-day free trial of our Amazon Brand Metrics data automation

Openbridge automates Amazon Brand Metrics API integrations and centralizes data storage in a unified data warehouse.

The trial delivers an automated and streamlined data pipeline for all of your crucial brand data to a trusted and private location like Amazon Redshift, Amazon Redshift Spectrum, Google BigQuery, Snowflake, Azure Data Lake, and Amazon Athena.

Unified data empowers your team to use best-in-class analytics tools like Google Data Studio, Tableau, Microsoft Power BI, Looker, or Amazon Quicksight. Combining various Amazon reports becomes a breeze, allowing you to gain a comprehensive and holistic view of your business.

Take action now and optimize Amazon Automation for Sellers and Vendor operations with Openbridge. Simplify your data management and unlock the full potential of your business insights.

Frequently Asked Questions

What is the Eligibility For Amazon Brand Lift?

All ad campaigns run through the Amazon DSP are eligible for Amazon Brand Lift studies. Brands are encouraged to consult with account executives to determine the feasibility of studies for their campaign types. The feasibility of studies varies by campaign type, encouraging brands to consult with account executives for best practices.

Creating a study in the Amazon DSP console is streamlined and self-service. Brands can choose orders, create study parameters, and check the status through the studies dashboard. The process is designed to be user-friendly, ensuring quick turnaround with results ready in as few as 30 days.

Are Brand Lift Studies Private?

Amazon Brand Lift studies are privacy-safe, offering detailed insights and easy reporting. They are available in multiple regions, including the United States, with the Amazon Shopper Panel providing objective, aggregated results.

What does Amazon Brand Lift Cost?

Per Amazon; “Brand Lift is free as long as campaigns meet spend and impression minimums. Minimums vary by marketplace; please visit the Amazon DSP or contact your account executive to learn more.”


Amazon Brand Lift and Amazon Brand Metrics: Growth Toolkit was originally published in Openbridge on Medium, where people are continuing the conversation by highlighting and responding to this story.


from Openbridge - Medium https://ift.tt/AWypvdl
via IFTTT

How Advertisers Can Use Amazon Attribution

Which part of the marketing budget and sales funnel activities are driving profitable growth? Is there a specific marketing effort working to drive conversions on Amazon? Display, search, social, video, or email?

Amazon Attribution performance data helps answer how non Amazon channels are drive growth (or dragging it down).

Amazon Ads Attribution Amazon Attribution metrics

There are two core report classes;

  • Promoted product analyze performance of products associated with your campaign. You can use this type of report to gauge how your campaigns impact shopping activity and sales for your products on Amazon.
  • Brand halo analyze performance of the brand products you didn’t promote (also known as brand halo) with a daily or summary performance broken out by campaign, channel, and publisher. This daily view shows one row per campaign-channel-publisher combination per product per day.

These reports contain a collection of permformance metrics;

  • Add to Cart: Number of times a promoted product is added to a customer’s cart following a click on an associated ad.
  • Brand Halo: Tracks conversions on products by the same brand as the promoted products, excluding the promoted products themselves. Abbreviated as “BH.”
  • Detail Page Views: Number of views of the advertised product’s detail pages on Amazon.
  • New-to-Brand Purchases: Number of first-time purchases for promoted products within the brand over a one-year lookback window.
  • New-to-Brand Product Sales: Total sales (in local currency) of new-to-brand orders.
  • New-to-Brand Units Sold: Quantity of promoted products purchased for the first time within the brand over a one-year lookback period post-ad delivery.
  • Product Sales: Total sales (in local currency) of promoted products purchased on Amazon post-click on an associated ad.
  • Promoted Product: A product tracked by an Amazon Attribution campaign.
  • Purchases: Number of times any amount of a promoted product or products are included in a purchase event.
  • Total Purchases: Number of times any number of products are included in a purchase event, including promoted products and those from the same brand.
  • Total Add to Carts: Number of times a product is added to a customer’s cart, including adds for promoted products and those from the same brand.
  • Total Detail Page Views: Number of ad-attributed detail page views on Amazon, including views for promoted products and those from the same brand.
  • Total Product Sales: Total sales (in local currency) of promoted products and those from the same brands as promoted products post-click on an associated ad.
  • Total Units Sold: Total quantity of promoted products and those from the same brand as promoted products purchased post-click on an associated ad.
  • Units Sold: Total quantity of promoted products purchased on Amazon post-ad exposure.

Amazon Ads Attribution Conversion metrics

You can also a number of conversion metrics designed to help you understand how shoppers engage with and make purchases on Amazon through the entire shopping journey.

Each Amazon Attribution conversion metric comes in two versions:

  • Promoted conversions that include attributed conversions for the products associated with your campaign, and
  • Total conversions that encompass attributed conversions for the products associated with your campaign plus all other products in the same brand. Total conversions equal promoted conversions plus brand halo conversions.

Each metric fits into a specific phase of the shopping journey so you can analyze the full-funnel impact of your non-Amazon marketing campaigns:

Awareness

Invest in growing the total audience of Amazon shoppers who are aware of your brand. Relevant Metric:

  • Clicks

Consideration

Help maximize purchase intent by telling your brand and product story. Relevant Metrics:

  • Detail Page Views
  • Add to Carts

Purchase

Stay present when shoppers are ready to buy. Relevant Metrics:

  • Purchases
  • Sales
  • Units Sold

Optimizing Off-Amazon Digital Marketing Campaigns with Amazon Attribution Data

What can this data offer advertisers? By exploring the rich performance data, teams can identify the most effective channels, publishers, creatives, and messaging strategies that drive customer engagement and conversions.

Strategic Testing: Uncovering Performance Drivers

An effective strategy to use once you have your data unified and ready to go is building an informed testing framework. This can be effective at uncovering the tactics that resonate with target audiences and maximize campaign delivery.

To optimize off-Amazon digital marketing efforts, consider conducting the following tests:

  1. Channel and Publisher Performance Analysis: Identify which channels and publishers are most effectively directing traffic to Amazon and contributing to sales. Focus on scaling efforts with high-performing partners.
  2. Creative and Messaging Resonance: Assess the effectiveness of various creatives and messaging approaches. Determine which combinations drive stronger engagement, conversions, and customer acquisition.
  3. High-Value Opportunity Identification: Utilize the products report to uncover potential advertising opportunities. For instance, if an ad for Product A leads to increased detail page views for Product B, consider creating a dedicated ad for Product B.
  4. Engaging Landing Page Experiences: Conduct landing page A/B tests to evaluate how shopping activities differ based on landing destinations and calls to action. Test different Store page tabs, product detail pages, and CTAs to optimize customer engagement.
  5. Unique Audience Insights: Identify the tactics that best engage specific audience segments across non-Amazon channels. Use these insights to allocate resources and tailor messaging more effectively.

Accessing Attribution Performance Data

You can access your Amazon Attribution manually via the reporting dashboard or as automated data feed from the Amazon Ads API.

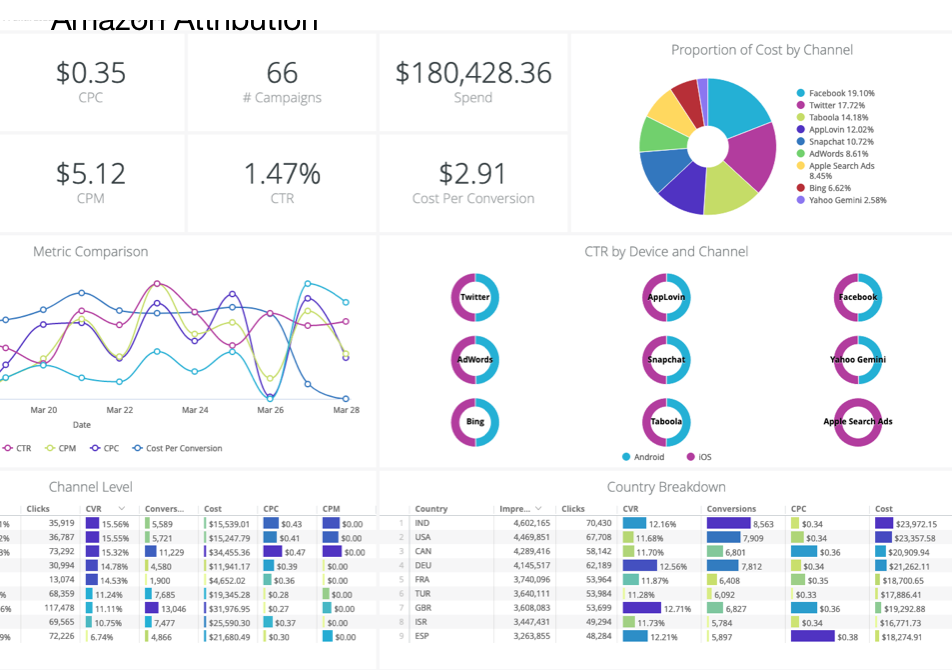
Using the API allows you to create customized, multi-dimensional, visual reporting dashboards in industry leading tools like Looker Data Studio, Tableau, Microsoft Power BI, Looker, or Amazon Quicksight where you can customize the metrics displayed and toggle between campaign and ad group data.

Looker Amazon Ads Attribution Report

Amazon Attribution API Data Feeds

There are two primary report data feeds from the API

Performance Report

  • Included Dimensions: aa_campaignid, aa_adgroupid, aa_creativeid, publisher.
  • Aggregation Level: Can be aggregated at CAMPAIGN, ADGROUP, or CREATIVE level (default: CREATIVE).
  • Metrics: Click-throughs and all Promoted and Total conversion metrics.

Products Report

  • Included Dimensions: aa_campaignid, aa_adgroupid, publisher, productName, productGroup, productCategory, productSubcategory, brandName, productAsin, productConversionType.
  • Aggregation Level: Always aggregated at ad group level.
  • Metrics: Promoted and Brand halo conversion metrics, Brand Referral Bonus. No click-throughs.

Once attribution tags have been implemented and shoppers have clicked your links, Openbridge will call the report endpoint to retrieve your data. Clicks may take up to 24 hours to appear, and conversions may take up to 48 hours.

Getting Started with Amazon Ads Attribution API Automation

Ditch the messy, manual reporting for Amazon Attribution. Automated data feeds guide data-driven decision making to improve off-Amazon digital marketing campaigns. Leverage attribution insights to refine strategies, allocate resources efficiently, and enhance customer engagement across all touchpoints.

Openbridge will unify and deliver performance data to leading data lake or cloud warehouses like Redshift, Google BigQuery, Snowflake, Azure Data Lake, and Amazon Athena for an analytics-ready single source of truth to fuel informed decisions on brand building strategy, media, and customer demand for Amazon.

With your data unified, start to turbocharge reporting, analytics, and business intelligence tools like Google Data Studio, Tableau, Microsoft Power BI, Looker, Amazon QuickSight, SAP, Alteryx, dbt, Azure Data Factory, Qlik Sense, and many others.

Get a 30-day free trial so that you can try Amazon Attribution API automation for yourself


How Advertisers Can Use Amazon Attribution was originally published in Openbridge on Medium, where people are continuing the conversation by highlighting and responding to this story.


from Openbridge - Medium https://ift.tt/jdIJwet
via IFTTT

Breakthrough To Viewers With Amazon Sponsored TV

Reach Audiences With Sponsored TV Ads

Harness the power of Amazon Sponsored TV for new pathways of audience engagement and growth

In the dynamic world of digital advertising, Amazon Ads’ announcement of Sponsored TV at the unBoxed 2023 conference marks a significant milestone.

The new, self-service streaming TV ad solution is set to transform how brands, regardless of their size, engage with audiences across 30+ brand-safe streaming TV services.

Amazon Sponsored TV Streaming Services

As the growth in watch time on streaming services increases, these ads represent a significant opportunity for brands to reach their audience where they are most engaged.

Introducing Amazon Sponsored TV

Amazon Ads has unveiled Sponsored TV, a self-service ad solution designed for brands of all sizes in the U.S. that sell on Amazon. The service allows brands to reach audiences on Amazon Freevee, Twitch’s livestreamed entertainment, and various third-party streaming services through Fire TV apps.

The new service offers Streaming TV ads that are full-screen, non-skippable video ads that appear in streaming TV shows and movies. Amazon stated that the average monthly audience is over 155MM across Amazon ad-supported Streaming TV in the US, Q4 2022.

Amazon Sponsored TV Reach

Per Amazon, the number of reflects an “unduplicated monthly audience across Amazon Freevee, Amazon Publisher Direct, Fire TV Channels, Thursday Night Football, and Twitch.”

Ruslana Zbagerska, Vice President of Amazon Ads, emphasizes that TV advertising should be accessible to all businesses. Sponsored TV campaigns leverage Amazon’s machine-learning optimization and first-party data, offering relevant ad experiences to viewers on the biggest screen in their home.

Bridging The Gap For Brands Of All Sizes

Historically, TV advertising has been perceived as a domain reserved for large corporations due to its high costs and complex execution. However, Sponsored TV shatters this barrier, offering an accessible platform for small and medium-sized brands. This inclusivity is crucial in an era where streaming TV is rapidly overtaking traditional linear TV as the primary mode of content consumption.

The Power Of Self-Service And Flexibility

Sponsored TV, especially in its category, stands out for its flexibility. Brands can now create and manage their streaming TV campaigns with ease, without the burden of minimum campaign spends or upfront commitments. This level of control and adaptability is unprecedented in the realm of TV advertising. Brands can start campaigns with no minimum spend, creating streaming TV campaigns easily within the Amazon Ads console or via the Amazon Ads API.

Patrick Miller, Co-Founder of Flywheel, notes that Sponsored TV makes streaming TV advertising accessible and cost-efficient for both emerging and established brands.

Leveraging Amazon’s Rich Data For Targeted Advertising

At the heart of Sponsored TV’s effectiveness is Amazon’s utilization of first-party shopping and entertainment signals. This approach enables brands to engage with audiences who show interest in specific types of content or products, ensuring that advertisements are not just seen but are also relevant and engaging.

Sponsored TV Or Streaming TV ads?

It can be confusing as terms seem interchangeable for Sponsored TV and Streaming TV. The simplest way to approach this is to think of Sponsored TV as a Streaming TV solution. It enables Sellers and Vendors quick and straightforward access to running Streaming TV ads.

As a result, Amazon provides two distinct avenues for accessing Streaming TV ads:

  • Sponsored Advertising TV
  • Amazon DSP

Both leverage Amazon’s unique signals, premium inventory, and measurement tools to assist you in reaching your marketing objectives. However, the Amazon DSP offers access to supplementary audiences, inventory options, and control features that are currently not accessible through Sponsored TV.

Another point of difference is that Sponsored TV does not have a minimum spending requirement, whereas the Amazon DSP mandates a minimum campaign spend of $50,000. DSP is often a solution used by large brands and agency teams.

Training & Certifications

Unsure where or how to start despite all the self-service tools? Amazon also educates advertisers on the nuances of Streaming TV ads, including understanding different buying options, evaluating PMPs, and adhering to creative policies. To learn more, Amazon offers an intro course called Get Started with Streaming TV Ads.

In-depth Metrics For Measurable Impact

Understanding and measuring the impact of advertising campaigns is crucial for brands. Sponsored TV addresses this need by providing advertisers with in-depth campaign reporting metrics. These insights include ad-attributed branded searches and detailed page views, offering a clear picture of campaign performance.

Get Started Automating Amazon Sponsored TV Reporting Data — For Free.

Do you want fast and unified data access to enable teams to utilize their preferred analytical tools, such as Google Data Studio, Tableau, Microsoft Power BI, Looker, or Amazon Quicksight?

Do you need to automate reports to a leading data lake or cloud warehouses like Redshift, Google BigQuery, Snowflake, Azure Data Lake, and Amazon Athena for a unified, analytics-ready single source of truth to fuel informed decisions on product, media, and customer demand?

Ditch the messy, manual report downloads for code-free automation access to the new Amazon’s Sponsored TV data.

Openbridge integration is a code-free, fully automated Amazon Ads API integration. By providing Sellers and Vendors with access to performance data, they can accelerate the speed at which the team can gain valuable insights that deliver data-driven growth and profit.

Sign up for a 30-day free trial of our Amazon Advertising Sponsored TV data automation.

FAQs

What is Amazon’s Sponsored TV?

  • Sponsored TV is Amazon Ads’ new self-service streaming TV ad solution, enabling brands of all sizes to advertise on streaming TV services.

How does Sponsored TV benefit small and medium-sized brands?

  • It offers an accessible platform for these brands to engage in TV advertising without the high costs and complex execution traditionally associated with it.

What makes Sponsored TV different from traditional TV advertising?

  • Its self-service nature, flexibility, and use of Amazon’s first-party data for targeted advertising set it apart from traditional TV advertising.

Can Sponsored TV help in targeting specific audiences?

  • Yes, it uses Amazon’s first-party shopping and entertainment signals to engage with audiences interested in specific types of content or products.

Is real-time campaign performance tracking available in Sponsored TV?

  • Yes, advertisers have access to real-time metrics like ad-attributed branded searches and detail page views to measure campaign impact.

Navigating new technologies can be challenging, particularly when it involves adapting to new methods of working with Amazon Advertising Sponsored TV. Whether you’re considering a proof-of-concept, a pilot project, or any other data initiative, the Openbridge platform will get you there.

Are you exploring the Amazon Sponsored TV for your organization but not sure where to start? Are you looking to automate messy, manual data workflows? Don’t hesitate to get in touch! If you prefer a more personal touch, we’re just conversation away. Schedule a conversation with our expert team to dive deeper into how we can help. Let’s connect!

Discover how we’re empowering other businesses in their Amazon Automation data endeavors at Openbridge.


Breakthrough To Viewers With Amazon Sponsored TV was originally published in Openbridge on Medium, where people are continuing the conversation by highlighting and responding to this story.


from Openbridge - Medium https://ift.tt/LXxmtk2
via IFTTT

Demystifying Amazon Buy Box: Sellers & Vendors

The Amazon Featured Offer (formerly Buy Box) explained. How to tap into your reporting data!

Amazon has grown to become the go-to platform for both buyers and sellers. Its vast user base offers sellers unmatched visibility, but with great potential comes great competition. Amidst this competition, one feature has emerged as a game-changer for professional sellers and vendors — the Featured Offer formerly known as the “Buy Box.”

Per Amazon;

Buy Box is the former term for what is now the Featured Offer in the Amazon store. This automated component recommends products to aid the online shopping experience.

For most of this post, we will refer to the Featured Offer as the “Buy Box,” given that Amazon Seller Central and Vendor Central still reference it in reports and documentation.

Before diving deep into strategies and their significance, let’s first understand the basics. We will also cover how to tap into first-party Amazon data that supplies critical performance data on the buy box.

What is the Featured Offer or Amazon Buy Box?

When someone asks, “What is a buy box?” on Amazon, it refers to that privileged space on an Amazon product listing where customers can click directly to add items to their shopping carts. It’s not just a simple “Add to Cart” button; it’s the gateway to a sale.

While multiple sellers might offer the same product, not everyone gets this prime real estate. Only one seller “wins” this spot at a given time, and that’s where the term “buy box wins” comes into play.

But what is the meaning of this on Amazon? In essence, it’s the number of times a particular seller’s product is the default option in the Buy Box. Considering the vast number of purchases made directly through this box, you can see why understanding and optimizing for it is crucial for sellers.

How Does the Buy Box Work?

You might think, “What are buy box wins based on?”. The answer lies in Amazon’s sophisticated algorithm. The premium spot isn’t awarded merely based on the lowest price; it considers several factors. Per Amazon, these can include:

  1. Price: While not the only factor, competitive pricing can increase your chances of securing the placement.
  2. Seller Rating: Amazon trusts sellers with better ratings. A high seller rating, derived from customer reviews and feedback, can boost your Buy Box eligibility.
  3. Shipping: Fast and reliable shipping is a significant determinant. Amazon Prime sellers or those using Fulfillment by Amazon (FBA) often have an edge.
  4. Order Defect Rate: Fewer order issues (like cancellations and returns) can make you a favorite for placement.
  5. Availability: Keeping items consistently in stock ensures you remain a contender.

The Meaning of ‘Buy Box Wins’ on Amazon

The term “winning the buy box” on Amazon essentially refers to the frequency with which your product is the default option in the Buy Box. For instance, if a customer lands on a product page and your product is displayed in the Buy Box, you’ve just had a “Buy Box win.”

For sellers, buy-box wins translate directly to sales. Studies indicate that most Amazon sales come now from the Buy Box, emphasizing its importance. Moreover, with the rise of mobile shopping, where screen real estate is limited, the Buy Box assumes even greater significance.

Strategies for Winning the Buy Box

Now that we’ve covered “what is the buy box” on Amazon and its significance let’s focus on how to increase your chances of winning it:

  1. Optimize Your Pricing Strategy: While the lowest price doesn’t guarantee a win, staying competitive does matter. Consider using automated repricing tools that adjust your product prices in real time based on the competition.
  2. Improve Seller Performance: Regularly monitor metrics like order defect rate, cancellation rate, and late shipment rate. Strive for excellence in these areas to enhance your eligibility.
  3. Offer Prime Shipping: If feasible, enroll in Amazon’s FBA program. Not only does it provide logistical support, but FBA sellers also often have an advantage in placement, given Prime shipping times.
  4. Maintain Stock Levels: Regularly review your inventory level’s shipping times. Running out of stock can lose the spot and harm your seller rating.
  5. Gather Reviews: Encourage satisfied customers to leave positive feedback. A robust seller rating can significantly influence wins.

Debunking Common Myths About the Amazon Buy Box

As the buy box wins remain a focal point for Amazon sellers, various myths and misconceptions have inevitably arisen. These myths often lead sellers astray, making them focus on the wrong strategies or disheartened. Let’s delve deeper into some of these prevalent myths, debunking them and shedding light on the reality.

“The Lowest Price Always Wins”

Myth: Many sellers believe the surefire way to secure a placement is by offering the product at the lowest price.

Reality: While price is a crucial factor in the Buy Box algorithm, it’s far from the only one. Amazon’s primary goal is to ensure a stellar customer experience. Thus, they consider multiple factors, of which price is just one.

For instance, if two sellers offer a product at similar prices, but one has consistently better reviews and a history of timely deliveries, the latter is more likely to win. Amazon recognizes that a marginally higher price can often be justified by better service, faster shipping, or superior product quality.

Strategy: Sellers should aim for a balanced approach instead of engaging in a relentless race to the bottom with prices. Staying competitive with pricing is essential to maintaining high-quality service and vital seller metrics.

“New Sellers Can’t Win the Buy Box”

Myth: A common belief is that the placement is reserved for seasoned sellers on Amazon, with newcomers having little to no chance of gaining this coveted spot.

Reality: While it’s true that established sellers with a consistent track record have an edge, Amazon’s algorithm isn’t biased against new sellers. What matters most are the performance metrics. If a new seller can demonstrate excellence in order fulfillment, customer feedback, and product availability, they stand a good chance of winning. Amazon’s primary concern is the customer’s experience, not the duration a seller has been on the platform.

Strategy: New sellers should focus on building a solid foundation. This includes ensuring accurate product listings, prompt customer service, reliable shipping, and actively seeking customer feedback. Over time, even if they haven’t been on the platform for long, their performance metrics can position them favorably for consideration.

Winning the buy box: Use Amazon Data!

The Amazon Buy Box, though shrouded in some mystery, isn’t as enigmatic as many believe. Sellers can focus on tangible, impactful strategies that genuinely influence their eligibility.

To accomplish this, it’s essential to approach the opportunity with a combination of data-driven insights and a commitment to offering outstanding customer experiences.

Does Amazon share the buy box data? Yes!

Sellers can immediately check out the Amazon Detail Page Sales and Traffic Business Reports in their Seller Central Business Reports section.

This report offers insights into each product’s winning percentage (child ASIN). It breaks down the number of times a product was viewed when it held the Buy Box versus the total number of times it was considered. Having the buy box percentage data directly from Amazon is critical. This information can help sellers understand which products are performing well and which might need attention.

Another example is in FBA Inventory Reports. You can see the featured offer price per ASIN for your Inventory. (SeeGET_FBA_INVENTORY_PLANNING_DATA).

What about Vendors? Amazon Vendors also have direct access to a collection of data feeds;

In addition, Vendors have access to supporting data for brand, traffic, and ads-related performance data that feed into featured offer determinations:

For example, in the Vendor Real-time Inventory data, the metrics reflect when an Amazon shopper notices the product available in the Buy Box as Ships and Sold by Amazon (vendors) or Ships from Amazon (FBA seller); that quantity is reflected in this metric. In a near real-time context, reflecting what shoppers notice allows vendors and FBA sellers to tailor their activities accordingly.

Understanding this data will provide you with immediate insight into ASIN-level activity.

See this post from Amazon for more details on how this Vendor data works and how it varies from other Vendor Reports.

Getting Started with the Amazon API Automation

Unifying and owning Amazon data allows you to build a view of sales over time, understand buyer behavior more intensely, or trend monthly traffic patterns. Data-driven insights mean your sales funnel will be whole, your content strategy aligned, and your traffic potential will be optimized.

If you are looking to automate and unify your Amazon data, Openbridge offers no-code, fully automated data pipelines;

With data automation, you can understand and optimize your digital marketing strategy and efficiently grow your existing customer base while identifying ideal customers that drive revenue. Informed decisions are within reach with automation for all of the critical types of reports you have come to rely on.

Getting Started — Automate Today

Are you interested in tapping into your Buy Box or Featured Offer data? Get started so you can create data-driven insights for order reports, product page performance, gross product sales, and much more.

Try our code-free, full-automated Amazon Selling Partner API data integration today with a 30-day free trial!


Demystifying Amazon Buy Box: Sellers & Vendors was originally published in Openbridge on Medium, where people are continuing the conversation by highlighting and responding to this story.


from Openbridge - Medium https://ift.tt/AMLw5Vz
via IFTTT

The Power of the Manage FBA Inventory Report: Archive

Manage FBA Inventory Report

A Comprehensive Guide to Optimizing Inventory Management and Boosting Profits on Amazon

The “Manage FBA Inventory Report: Archive” provides valuable information for Amazon sellers to help drive growth and profit through effective inventory management.

Why Use The Manage FBA Inventory Report: Archive?

The report provides listing, condition, disposition, and quantity information to help Amazon sellers with day-to-day inventory management tasks, including listings that have been archived.

Here’s how sellers can use the data in this report:

  • Inventory Planning: Sellers can use the SKU, FNSKU, and ASIN information to identify and track specific products within their inventory. This helps them plan which products to focus on and which may need attention.
  • Condition Monitoring: The “condition” field indicates whether products are listed as new or used-good. Sellers can assess the condition of their inventory and make pricing and restocking decisions accordingly.
  • Pricing Strategy: Sellers can review their current selling prices (“your-price”) and adjust them based on market conditions and competition. Pricing optimization can lead to increased sales and profits.
  • Fulfillment Method: The “mfn-listing-exists” and “afn-listing-exists” fields help sellers identify whether products are listed for fulfillment by themselves or by Amazon (Fulfillment by Amazon). Sellers can evaluate which fulfillment method is more cost-effective and convenient for each SKU.
  • Inventory Levels: Sellers can monitor the “afn-warehouse-quantity” and “afn-fulfillable-quantity” to ensure they have sufficient stock in Amazon fulfillment centers to meet customer demand. Maintaining optimal inventory levels prevents running out of stock or incurring storage fees for excess inventory.
  • Unsellable Inventory: The “afn-unsellable-quantity” field provides insight into the number of unsellable units. Sellers can investigate why these units are unsellable and take corrective actions, such as removing damaged items.
  • Reserved Inventory: Sellers can keep track of the “afn-reserved-quantity” to understand how many units are currently being processed, packed, or reserved for internal purposes. This helps in estimating when these units will become available for sale again.
  • Total Inventory: The “afn-total-quantity” field gives an overview of the inventory units across various stages, including warehouse stock, inbound shipments, and more. Sellers can use this to assess the overall health of their inventory.
  • Inbound Shipment Tracking: Information about inbound shipments, such as “afn-inbound-working-quantity” and “afn-inbound-shipped-quantity,” helps sellers track the progress of their shipments to Amazon fulfillment centers and ensures timely availability.
  • Future Supply: Sellers can plan for future inventory replenishment by considering “afn-future-supply-buyable” units available for customers to buy while inventory is in transit. They can also monitor “afn-reserved-future-supply” units, which customers have pre-purchased.

This report shows that Amazon sellers can make informed decisions about pricing, restocking, managing inventory health, and optimizing their overall FBA strategy. This can lead to improved sales, reduced storage costs, and increased profitability on the Amazon platform.

What Report Fields Are Included In The Manage FBA Inventory Report?

  • SKU (Stock Keeping Unit): Unique identifiers for your products comprising letters or numbers (e.g., AB-8675309).
  • FNSKU (Fulfillment Network Stock Keeping Unit): Unique IDs assigned by Amazon to products stored and fulfilled from Amazon’s centers (e.g., X00000E5TX).
  • ASIN (Amazon Standard Identification Number): Amazon’s 10-character code for identifying items (e.g., B003ZYF3LO).
  • Product Name: The title of your product (e.g., Toysmith Nonstick Bakeware Set).
  • Condition: Indicates whether the product is new or used (e.g., New or Used-Good).
  • Your Price: Your current selling price (e.g., $10.25).
  • MFN Listing Exists: Indicates if the product is listed for fulfillment by you as the seller (e.g., Yes).
  • MFN Fulfillable Quantity: The quantity in your fulfillment network available for picking, packing, and shipping (e.g., 10).
  • AFN Listing Exists: Indicates if the item is listed for Fulfillment by Amazon (e.g., Yes).
  • AFN Warehouse Quantity: Units for an SKU in Amazon fulfillment centers that have been processed (e.g., 35).
  • AFN Fulfillable Quantity: Units in Amazon fulfillment centers ready to be picked, packed, and shipped (e.g., 20).
  • AFN Unsellable Quantity: Units in Amazon fulfillment centers in unsellable condition (e.g., 5).
  • AFN Reserved Quantity: Units in Amazon fulfillment centers being processed, packed, or sidelined (e.g., 10).
  • AFN Total Quantity: The overall units for an SKU in inbound shipments or Amazon fulfillment centers (e.g., 55).
  • Per-Unit Volume: Volume per unit (e.g., 0.23).
  • AFN Inbound Working Quantity: Units in inbound shipments you’ve notified Amazon about (e.g., 10).
  • AFN Inbound Shipped Quantity: Units in shipments with notification and tracking numbers (e.g., 5).
  • AFN Inbound Receiving Quantity: Units at Amazon fulfillment centers for processing (e.g., 5).
  • AFN Researching Quantity: Units under research at Amazon fulfillment centers (not exceeding 30 days) (e.g., 1).
  • AFN Future Supply Buyable: Units available for customers while in transit to Amazon centers via In-Stock Head Start (e.g., 10).
  • AFN Reserved Future Supply: Units pre-purchased by customers while in transit via In-Stock Head Start (e.g., 5).

Why are my items being researched?

There is a newer inventory classification on the Manage FBA inventory and Manage FBA Inventory — Archived report called “Researching.” This represents the misplaced or fulfillment-center-damaged inventory that is actively being confirmed at our fulfillment centers.

The research process is limited to a maximum duration of 30 days. After the inventory under investigation has either been reimbursed or the 30-day timeframe has passed, you will find the corresponding adjustment reflected in the detailed view of the Inventory ledger report. For inventory adjustments made after March 19, 2021, there is no need to wait for the full 30 days before filing a claim, as we now handle the 30-day research period on your behalf.

Unify Manage FBA Inventory Report: Archive Data

While you can manually download the report, automation and unifying this data is when you can create insights that drive growth and operational efficiency.

Automating the extraction and integration of the Amazon Manage FBA Inventory report data using the Amazon Selling Partner API, unifying it in a data warehouse or data lake, and leveraging BI tools like Tableau or Power BI for insights can streamline inventory management and provide valuable insights for Amazon sellers.

  • Amazon Selling Partner API Integration: No need to develop a script or application that utilizes the Amazon Selling Partner API to retrieve the Manage FBA Inventory report data. Openbridge has pre-built the Amazon SPAPI app for you.
  • Data Extraction and Transformation: Openbridge automates extracting the data from the API response in a structured format, such as JSON or CSV. We will transform the raw data into a standardized format easily ingested by your data warehouse or data lake. This includes data type conversions, cleaning, and formatting.
  • Data Warehousing or Data Lake: Openbridge unifies the data into a trusted, private data warehouse or data lake like Amazon Redshift, Amazon Redshift Spectrum, Google BigQuery, Snowflake, Azure Data Lake, and Amazon Athena, owned by you. Creating tables, views, and data structures in your data warehouse or data lake needed to accommodate the Amazon FBA inventory data is automated and fully-managed.
  • Data Integration and ETL (Extract, Transform, Load): No need to develop ETL (Extract, Transform, Load) processes to automate the regular extraction of Amazon FBA inventory data from the API and load it into your data warehouse or data lake. Openbridge automates and schedules these ETL processes to run at predefined intervals (e.g., hourly, daily or weekly).
  • Data Unification: Openbridge will unify the Amazon FBA inventory data with other relevant data sources, such as sales, advertising, and marketing data, when needed. This creates a comprehensive, unified dataset for analysis.
  • BI Tool Integration: Unified data simplifies connecting your chosen BI tool (e.g., Google Data Studio, Tableau, Microsoft Power BI, Looker, or Amazon Quicksight) to your data warehouse or data lake. These tools offer easy integration to kickstart your insights efforts.
  • Data Visualization and Analysis: Create dashboards, reports, and visualizations in your BI tool to analyze the unified Amazon FBA inventory data. You can use the data to gain insights into product performance, inventory levels, pricing strategies, etc. Set up parameters and filters in your BI tool to allow users to customize their analyses based on specific criteria.
  • Automation and Alerts: Implement automation to generate alerts or notifications when specific inventory conditions are met. For example, you can set up alerts for low inventory levels or when unsellable inventory exceeds a certain threshold.
  • Regular Maintenance and Monitoring: Continuously monitor the data integration and ETL processes to ensure data accuracy and reliability. Regularly update and expand your data warehouse or data lake to accommodate new data sources or additional historical data.
  • Data Governance and Security: Implement data governance practices to ensure data quality, security, and compliance with relevant regulations, especially if sensitive customer data is involved.

By automating this process and utilizing BI tools, Amazon sellers can gain real-time insights into their FBA inventory, make data-driven decisions, optimize inventory management, and drive growth and profit on the Amazon platform.

Getting Started — Automate Today

Get code-free, fully-automated Amazon Selling Partner API data pipelines for orders, inventory, traffic, fulfillment, finance, and many more.

Here is a snapshot of the available Amazon data:

If you are looking to automate and unify your Amazon data, Openbridge offers no-code, fully automated data pipelines. Get started so you can create data-driven insights for order reports, product page performance, gross product sales, and much more.

Try our code-free, full-automated Amazon Selling Partner API data integration today with a 30-day free trial!


The Power of the Manage FBA Inventory Report: Archive was originally published in Openbridge on Medium, where people are continuing the conversation by highlighting and responding to this story.


from Openbridge - Medium https://ift.tt/s90Xtdu
via IFTTT

Airbyte Connectors: Data Source, Destination, and Catalog Configuration

Building your open source Airbyte integrations from source to destination

In today’s data-driven world, integrating various platforms and databases is crucial. With tools like Airbyte offering many ETL and integration connectors, data synchronization can be efficiently automated.

But what is Airbyte, and how do its connectors play a pivotal role in data orchestration?

What is Airbyte?

Airbyte is a data integration framework designed to streamline ETL processes. With an extensive list of pre-built Airbyte connectors and the flexibility to create custom ones, it has gained traction among data enthusiasts and businesses.

There are two core principles of an Airbyte Integration, the data source and destination.

Airbyte Integrations and Connectors

The strength lies in its vast array of Airbyte’s ETL connectors, which can be categorized as:

Data Source Connectors: These are responsible for fetching data from various sources. Source connectos cover a broad spectrum, from databases to SaaS platforms, ensuring data from almost any source can be integrated.

Destination Connectors: After fetching data, you need to send it somewhere. Whether cloud storage, a data warehouse, or another database, Airbyte’s destination connectors ensure data lands where you need it.

Connecting the two creates an integration “pipeline”, moving data from the source to a target destination.

Airbyte Integrations: Bring Your Own App

Airbyte connectors follow the “Bring Your Own App” (BYOA) model. A “Bring Your Own App” reflects a customer-created app, typically an app upstream at a data source. For example, if you want to use the open-source Amazon Selling Partner API connector, Amazon requires you to “register” an app to access a seller or vendor account to sync data. Without access to the source, there is no data to sync and each source system defines the available data and protocols on how that data can be accessed.

Given the nature of “BYOA,” the configuration of sources and destinations is vital.

Airbyte Connector Config Files?

One of its requirements to successfully run Airbyte pipelines is sorting out your source and destination configurations.

Finding the configuration specifications for Airbyte connectors can be challenging to locate. They are often nested deep within the Airbyte repository or spread across different directories.

Thankfully, many source and destination configs are available on GitHub via the open source Airbridge project.

Go to the Airbridge project on GitHub. In the project are two folders:

  1. Data Sources: config/reference/source
  2. Data Destinations: config/reference/destination

Select the data source or destination configuration that matches your needs. You are welcome to browse the hundreds of pre-generated source and destination configs.

Examples Source Connectors

  1. Sales Connectors: These connectors focus on integrating data from sales platforms like Salesforce, HubSpot, and Pipedrive. They help businesses streamline their sales data, ensuring seamless syncing across platforms and aiding in sales analytics.
  2. Ads Connectors: Geared towards marketers and advertising professionals, Ads connectors allow data integration from advertising platforms such as TikTok Marketing, Google Ads, Facebook Ads, and Bing Ads. This ensures that advertising metrics, campaign data, and performance indicators are consolidated and easily accessible.
  3. CRM Connectors: CRM (Customer Relationship Management) connectors cater to platforms like Salesforce Pardot, Microsoft Dynamics, NetSuite, and Freshsales. These connectors are pivotal for businesses aiming to have a unified view of customer interactions, ensuring that data from CRM platforms is synced with other data sources.
  4. Finance & Accounting Connectors: These connectors are designed to integrate data from financial and accounting platforms such as QuickBooks, Xero, and Stripe. They are essential for businesses to maintain accurate financial records, consolidate transaction data, and ensure financial compliance.

What is in a source config? Here is an example config for TikTok Marketing.

{
"credentials": {
"auth_type": "optional_value",
"app_id": "optional_value",
"secret": "optional_value",
"access_token": "optional_value",
"advertiser_id": "optional_value"
},
"start_date": "optional_value",
"end_date": "optional_value",
"attribution_window": "optional_value",
"include_deleted": "optional_value"
}

The Airbyte connector source config file for TikTok Marketing can be found here:

airbridge/config/reference/source/source_tiktok_marketing_source_spec.json at dev · openbridge/airbridge

Here is an example connector config for Bing Ads.

{
"auth_method": "optional_value",
"tenant_id": "optional_value",
"client_id": "required_value",
"client_secret": "optional_value",
"refresh_token": "required_value",
"developer_token": "required_value",
"reports_start_date": "required_value",
"lookback_window": "optional_value"
}

The config file for Bing Ads can be found here:

airbridge/config/reference/source/source_bing_ads_source_spec.json at dev · openbridge/airbridge

Here is an example Airbyte connector config for Hubspot.

{
"start_date": "required_value",
"credentials": {
"credentials_title": "optional_value",
"client_id": "optional_value",
"client_secret": "optional_value",
"refresh_token": "optional_value",
"access_token": "optional_value"
}
The config file for Bing Ads can be found here:https://github.com/openbridge/airbridge/blob/dev/config/reference/source/source_hubspot_source_spec.json

The config file for Hubspot can be found here:

airbridge/config/reference/source/source_hubspot_source_spec.json at dev · openbridge/airbridge

Catalog Configuration: Source and destination integration connector definitions

One of the critical components of Airbyte’s configuration is the catalog.json file, which defines the streams (i.e., tables, collections, or any other structured data) that a specific source connector can read from.

This file plays an integral role in the ETL (Extract, Transform, Load) process, as it defines the schema for the data that will be extracted from a source and loaded into a destination.

To find the catalog.json, navigate to the respective sources on GitHub.

For example, if you are interested in Chargebee, go to source-chargebee/integration_tests/. In that folder, you will find the configured_catalog.json.

Typically, no changes are needed to the catalog unless you are familiar with customizing this file. For most users, leaving it as-is would be sufficient. However, check the docs for each source to learn what changes are needed in the catalog.

Airbyte Connectors: Destinations

The term “ destination” in the context of Airbyte Integrations refers to location where source data will land. This could be a specific cloud database, data warehouse, data lake, or another storage platform.

Here are some of the more popular destinations;

  1. BigQuery: This is Google Cloud’s fully managed, low-cost analytics database. With the BigQuery destination connector, users can push data directly into BigQuery datasets.
  2. Amazon Redshift: Redshift is Amazon’s data warehousing solution that’s a part of the Amazon Web Services (AWS) ecosystem. Airbyte’s Redshift destination connector facilitates the transfer of data into Redshift clusters.
  3. Snowflake: Snowflake is a cloud-based data warehousing platform. The Airbyte Snowflake destination connector ensures data from various sources can be consolidated within Snowflake.
  4. Amazon S3: Amazon S3 (Simple Storage Service) is a scalable object storage service from AWS. With the Airbyte S3 destination connector, users can save data in various formats (like CSV, JSON, Parquet) directly into S3 buckets.

The following is an example config for Amazon Web Services S3:

{
"access_key_id": "optional_value",
"secret_access_key": "optional_value",
"s3_bucket_name": "required_value",
"s3_bucket_path": "required_value",
"s3_bucket_region": "required_value",
"format": {
"format_type": "optional_value",
"compression_codec": "optional_value",
"flattening": "optional_value",
"compression": {
"compression_type": "optional_value"
},
"block_size_mb": "optional_value",
"max_padding_size_mb": "optional_value",
"page_size_kb": "optional_value",
"dictionary_page_size_kb": "optional_value",
"dictionary_encoding": "optional_value"
},
"s3_endpoint": "optional_value",
"s3_path_format": "optional_value",
"file_name_pattern": "optional_value"
}

Airbyte Development Kits

While Airbyte offers a plethora of pre-built connectors, there will always be niche platforms or databases that aren’t covered out-of-the-box. For example, there is no open-source Hotjar connector built (yet). This is where customer development kits come into play.

Airbyte Custom Connector Development

You can create custom connectors tailored to your specific data sources or destinations using the provided development kit. Whether you’re looking to integrate with a proprietary system or a lesser-known platform, Airbyte CDKs are a path.

Connector Development | Airbyte Documentation

Airbyte Cloud: The Open Source Option

Although not every aspect of Airbyte qualifies as an open-source data integration platform, many of its source and destination connectors do. This mix of open-source and proprietary elements within its framework necessitates a clear distinction for users that want want an Airbyte Cloud deployment.

For those eager to utilize the open-source facets of Airbyte in cloud platforms such as AWS, Google Cloud, and Azure, recognizing the differences between these open-source and proprietary components is vital.

The following are two open source projects for running an open source version of Airtbyte in the cloud:


Airbyte Connectors: Data Source, Destination, and Catalog Configuration was originally published in Openbridge on Medium, where people are continuing the conversation by highlighting and responding to this story.


from Openbridge - Medium https://ift.tt/Zb270Lv
via IFTTT