Automated Amazon Vendor Central Sales Reports

Discover how to become a data-driven merchant with sales insights

The Sales reports from Amazon Vendor Central provide Vendors with detailed insights into account sales performance.

Amazon describes the reports as follows;

“Quickly identify opportunities by determining what is contributing to sales performance.”

What are the benefits of Amazon Vendor Central Sales Reports?

The sales reports offer Vendors key insights into account performance:

  • Performance Analysis: Sales reports enable Vendors to analyze their sales performance over a specified period (in this case, yearly). This includes understanding which products (ASINs) are selling well and which aren’t.
  • Opportunity Identification: By examining sales data, Vendors can quickly identify opportunities for improvement or expansion. This could involve increasing the stock of high-performing products or reassessing the marketing or pricing strategies of underperforming ones.
  • Decision Making: The data aids in strategic decision-making, such as inventory management, marketing focus, pricing strategies, and forecasting future sales.
  • Insight into Consumer Behavior: Understanding what drives sales and how customers respond to products.
  • Financial Planning: Aids in more accurate financial planning and Revenue forecasting.
  • Market Trends Analysis: Helps identify market trends and consumer preferences.

What Data Is Available For Vendor Central Sales?

As of 2023, Vendor Retail Analytics Sales reports and new “real-time” Rapid Retail Analytics sales feeds exist.

For information on the new real-time data for Vendors, see:

This post will focus on Retail Analytics Sales reports.

What Is Included In Vendor Central Retail Analytics Sales Reports?

Here’s a breakdown of the Vendor Central Retail Analytics Sales Reports columns. There are two classes of Vendor Central Sales reports:

  • Sourcing View: This report shows product sales data with an offer from a vendor code listed in the vendor group.
  • Manufacturing View: This report provides ASIN-level data for products manufactured by the vendor.

The Sourcing report provides a detailed breakdown of product performance regarding revenue, cost, units shipped, and returns. The Sourcing report contains the following columns:

  1. ASIN: Amazon Standard Identification Number is a unique identifier for each product.
  2. Product Title: The name or title of the product.
  3. Brand: The brand associated with each product.
  4. Shipped Revenue: The total Revenue generated from the shipped products.
  5. Shipped COGS (Cost of Goods Sold): The cost of producing or purchasing the goods sold.
  6. Shipped Units: The number of units shipped.
  7. Customer Returns: The number of units customers return.

This Manufacturing report provides a comprehensive overview of the product’s performance. It differentiates between ordered and shipped metrics, giving a clearer picture of demand versus fulfillment. The Manufacturing report includes the following key columns:

  1. ASIN: Amazon Standard Identification Number, unique to each product.
  2. Product Title: The name or title of the product.
  3. Brand: The brand associated with each product.
  4. Ordered Revenue: The total Revenue from orders placed.
  5. Ordered Units: The number of units ordered.
  6. Shipped Revenue: The total Revenue generated from the shipped products.
  7. Shipped COGS (Cost of Goods Sold): The cost of producing or purchasing the goods sold.
  8. Shipped Units: The number of units shipped.
  9. Customer Returns: The number of units customers return.

Both reports have a few qualifications around what is and is not included in the data

  • Exclusions: Warehouse Deals sales are not included in these metrics. This is important as it affects the accuracy and relevance of the sales data.
  • Inclusions: Customer returns and free replacements are accounted for in shipped units and Revenue. This provides a more realistic picture of actual sales performance.
  • Attribution of Returns and Cancellations: These are attributed based on the original date of the sale, affecting how Revenue and returns are analyzed over time.

Vendor Central API Automation For Data-Driven Sales Insights

The Amazon Selling Partner API (SP-API) allows for direct, automated access to Amazon Vendor Sales data, making it easier for businesses to integrate it into their systems.

The following are just a few examples of reports you can create with automated data using tools such as Google Data Studio, Tableau, Microsoft Power BI, Looker, or Amazon Quicksight.

You can create simple, ASIN-based performance visualizations:
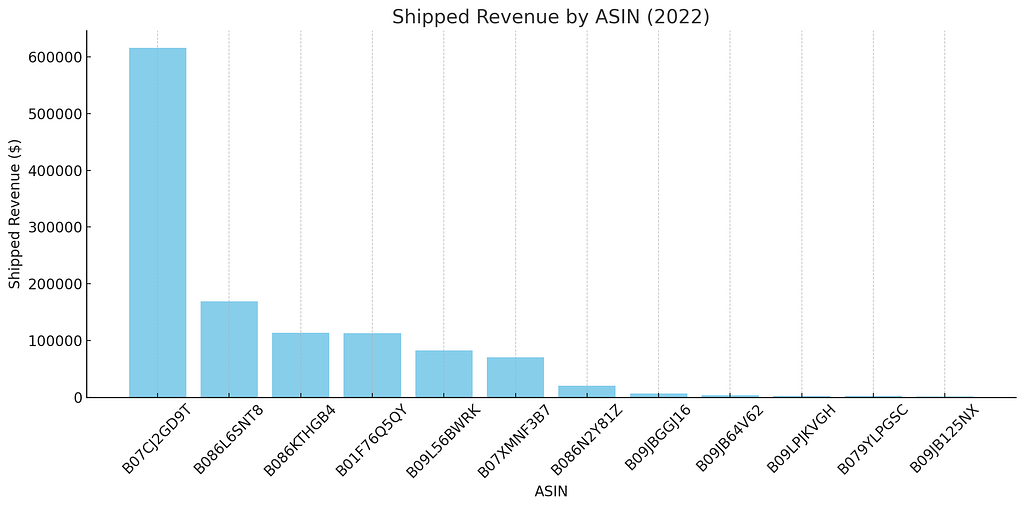
The bar chart above visualizes the ‘Shipped Revenue’ for different ASINs (products) in 2022, based on the Sourcing View report from Amazon Vendor Central. Each bar represents a specific product (ASIN), and the height of the bar indicates the total revenue generated from that product.

You can also create comparisons like shipped units and customer returns by ASIN:
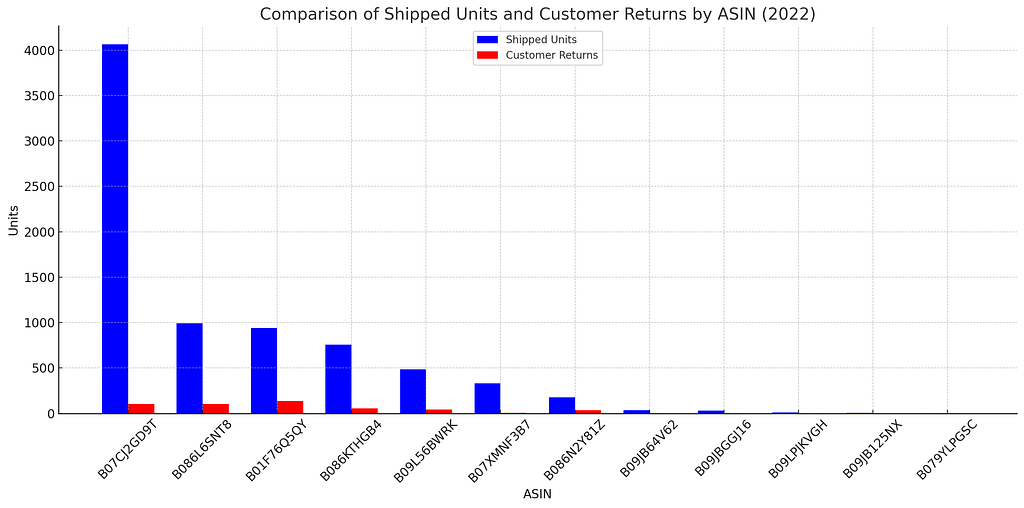
The grouped bar chart above compares ‘Shipped Units’ (in blue) and ‘Customer Returns’ (in red) for each product (ASIN) based on the Sourcing View report for 2022. This visualization allows for an easy side-by-side comparison of these two metrics.

Product Portfolio Analysis

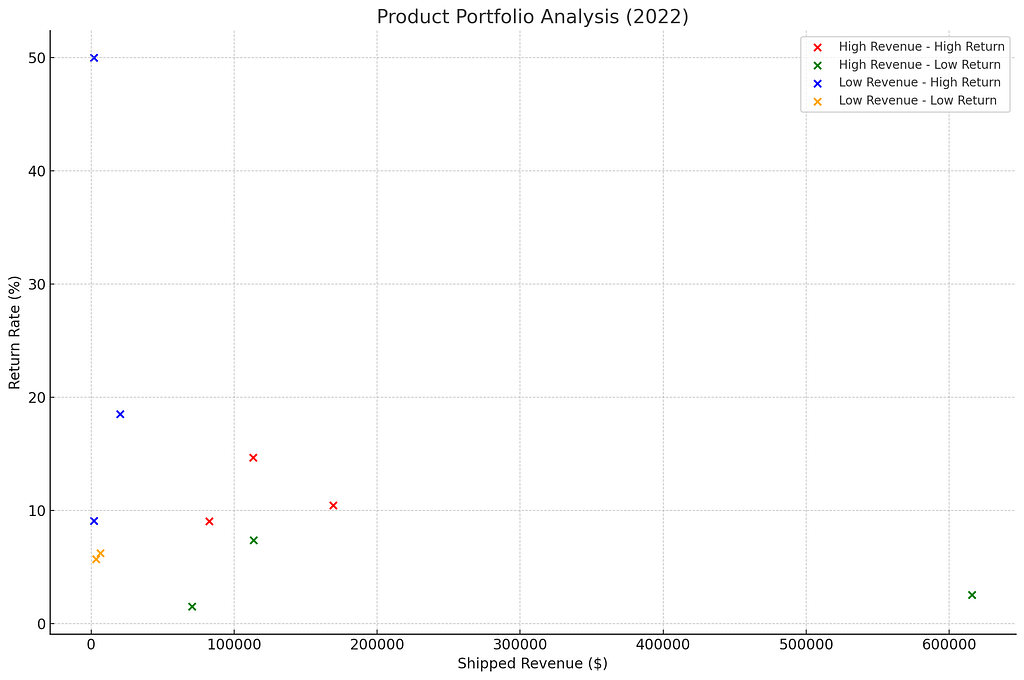
A Product Portfolio Analysis classifies products into categories based on revenue and return rates. The categories could be:

  1. High Revenue — High Return (Red): Products in this category generate high revenue but also have a high return rate. This might indicate issues with the product despite its popularity.
  2. High Revenue — Low Return (Green): These are the most desirable products, generating high revenue with a low return rate, indicating strong market fit and customer satisfaction.
  3. Low Revenue — High Return (Blue): Products that are not performing well in terms of sales and also experiencing high return rates. These might need reassessment or improvement.
  4. Low Revenue — Low Return (Orange): These products have low sales and low return rates, possibly indicating niche markets or opportunities for increased marketing or product development.

We use the ‘Shipped Revenue’ and ‘Customer Returns’ metrics for the analysis. We calculate each product's return rate (as a percentage of shipped units) and then use these two metrics to categorize the products.

The scatter plot below represents the Product Portfolio Analysis for 2022. It categorizes products into four segments based on their Shipped Revenue and Return Rate:
High Revenue — High Return:

  • Products: B086L6SNT8, B01F76Q5QY, B09L56BWRK

High Revenue — Low Return:

  • Products: B07CJ2GD9T, B086KTHGB4, B07XMNF3B7

Low Revenue — High Return:

  • Products: B086N2Y81Z, B09LPJKVGH, B079YLPGSC

Low Revenue — Low Return:

  • Products: B09JBGGJ16, B09JB64V62, B09JB125NX

How To Access Vendor Central Sales Reports?

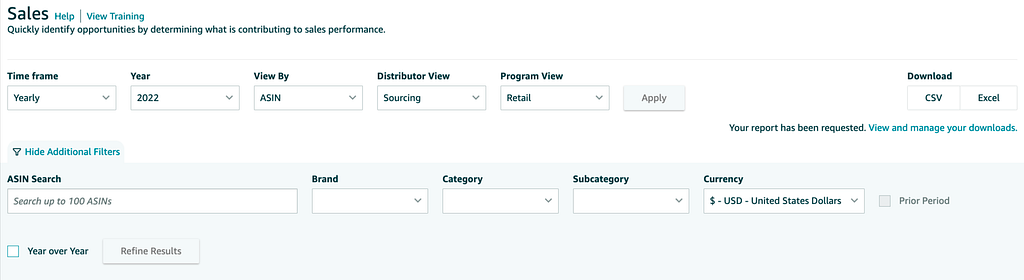
Vendors have two primary paths to access Sales reports: manual downloads or API automation.

Manual downloading occurs in your Vendor Central account interface. Automation taps into the Amazon Selling Partner API (Amazon SP-API) to automate report processing and storage in a cloud warehouse or data lake (see the Amazon docs here).
Manual Access via Vendor Central:

  1. Login: First, Vendors must log into their Amazon Vendor Central account.
  2. Navigate to Reports: Usually found in the main navigation bar, this section contains various sales, inventory, and performance reports.
  3. Locate the ‘Sales’ Within the Reports section
  4. Select Date Range: Amazon allows Vendors to pull reports based on specific dates. Choose the desired range.
  5. Download: Once the report has been generated, there will typically be an option to download it. The report is often available in different formats .csv or .xls.

Note: Manual downloads are more time-consuming and may not be ideal for frequent and up-to-date data analytics.

Automate And Unify Your Vendor Central Sales Data — Free For 30 Days

Openbridge API automation allows Amazon Vendors to save time manually downloading Sales reports, increasing data velocity and reducing errors in messy merging and tracking downloaded reports.

Start your journey towards data-driven growth and profit with Openbridge. Our code-free, fully automated Selling Partner API integration simplifies your Amazon Vendor Central operations.

Ready to automate and unify your Amazon Sales Data?

→ Sign up for a 30-day free trial of our Vendor Central Sales Report automation.


Automated Amazon Vendor Central Sales Reports was originally published in Openbridge on Medium, where people are continuing the conversation by highlighting and responding to this story.


from Openbridge - Medium https://ift.tt/oyzIjp0
via IFTTT

Automated Amazon Vendor Central Sales Reports

Discover how to become a data-driven merchant with sales insights

The Sales reports from Amazon Vendor Central provide Vendors with detailed insights into account sales performance.

Amazon describes the reports as follows;

“Quickly identify opportunities by determining what is contributing to sales performance.”

What are the benefits of Amazon Vendor Central Sales Reports?

The sales reports offer Vendors key insights into account performance:

  • Performance Analysis: Sales reports enable Vendors to analyze their sales performance over a specified period (in this case, yearly). This includes understanding which products (ASINs) are selling well and which aren’t.
  • Opportunity Identification: By examining sales data, Vendors can quickly identify opportunities for improvement or expansion. This could involve increasing the stock of high-performing products or reassessing the marketing or pricing strategies of underperforming ones.
  • Decision Making: The data aids in strategic decision-making, such as inventory management, marketing focus, pricing strategies, and forecasting future sales.
  • Insight into Consumer Behavior: Understanding what drives sales and how customers respond to products.
  • Financial Planning: Aids in more accurate financial planning and Revenue forecasting.
  • Market Trends Analysis: Helps identify market trends and consumer preferences.

What Data Is Available For Vendor Central Sales?

As of 2023, Vendor Retail Analytics Sales reports and new “real-time” Rapid Retail Analytics sales feeds exist.

For information on the new real-time data for Vendors, see:

This post will focus on Retail Analytics Sales reports.

What Is Included In Vendor Central Retail Analytics Sales Reports?

Here’s a breakdown of the Vendor Central Retail Analytics Sales Reports columns. There are two classes of Vendor Central Sales reports:

  • Sourcing View: This report shows product sales data with an offer from a vendor code listed in the vendor group.
  • Manufacturing View: This report provides ASIN-level data for products manufactured by the vendor.

The Sourcing report provides a detailed breakdown of product performance regarding revenue, cost, units shipped, and returns. The Sourcing report contains the following columns:

  1. ASIN: Amazon Standard Identification Number is a unique identifier for each product.
  2. Product Title: The name or title of the product.
  3. Brand: The brand associated with each product.
  4. Shipped Revenue: The total Revenue generated from the shipped products.
  5. Shipped COGS (Cost of Goods Sold): The cost of producing or purchasing the goods sold.
  6. Shipped Units: The number of units shipped.
  7. Customer Returns: The number of units customers return.

This Manufacturing report provides a comprehensive overview of the product’s performance. It differentiates between ordered and shipped metrics, giving a clearer picture of demand versus fulfillment. The Manufacturing report includes the following key columns:

  1. ASIN: Amazon Standard Identification Number, unique to each product.
  2. Product Title: The name or title of the product.
  3. Brand: The brand associated with each product.
  4. Ordered Revenue: The total Revenue from orders placed.
  5. Ordered Units: The number of units ordered.
  6. Shipped Revenue: The total Revenue generated from the shipped products.
  7. Shipped COGS (Cost of Goods Sold): The cost of producing or purchasing the goods sold.
  8. Shipped Units: The number of units shipped.
  9. Customer Returns: The number of units customers return.

Both reports have a few qualifications around what is and is not included in the data

  • Exclusions: Warehouse Deals sales are not included in these metrics. This is important as it affects the accuracy and relevance of the sales data.
  • Inclusions: Customer returns and free replacements are accounted for in shipped units and Revenue. This provides a more realistic picture of actual sales performance.
  • Attribution of Returns and Cancellations: These are attributed based on the original date of the sale, affecting how Revenue and returns are analyzed over time.

Vendor Central API Automation For Data-Driven Sales Insights

The Amazon Selling Partner API (SP-API) allows for direct, automated access to Amazon Vendor Sales data, making it easier for businesses to integrate it into their systems.

The following are just a few examples of reports you can create with automated data using tools such as Google Data Studio, Tableau, Microsoft Power BI, Looker, or Amazon Quicksight.

You can create simple, ASIN-based performance visualizations:

The bar chart above visualizes the ‘Shipped Revenue’ for different ASINs (products) in 2022, based on the Sourcing View report from Amazon Vendor Central. Each bar represents a specific product (ASIN), and the height of the bar indicates the total revenue generated from that product.

You can also create comparisons like shipped units and customer returns by ASIN:

The grouped bar chart above compares ‘Shipped Units’ (in blue) and ‘Customer Returns’ (in red) for each product (ASIN) based on the Sourcing View report for 2022. This visualization allows for an easy side-by-side comparison of these two metrics.

Product Portfolio Analysis

A Product Portfolio Analysis classifies products into categories based on revenue and return rates. The categories could be:

  1. High Revenue — High Return (Red): Products in this category generate high revenue but also have a high return rate. This might indicate issues with the product despite its popularity.
  2. High Revenue — Low Return (Green): These are the most desirable products, generating high revenue with a low return rate, indicating strong market fit and customer satisfaction.
  3. Low Revenue — High Return (Blue): Products that are not performing well in terms of sales and also experiencing high return rates. These might need reassessment or improvement.
  4. Low Revenue — Low Return (Orange): These products have low sales and low return rates, possibly indicating niche markets or opportunities for increased marketing or product development.

We use the ‘Shipped Revenue’ and ‘Customer Returns’ metrics for the analysis. We calculate each product's return rate (as a percentage of shipped units) and then use these two metrics to categorize the products.

The scatter plot below represents the Product Portfolio Analysis for 2022. It categorizes products into four segments based on their Shipped Revenue and Return Rate:

High Revenue — High Return:

  • Products: B086L6SNT8, B01F76Q5QY, B09L56BWRK

High Revenue — Low Return:

  • Products: B07CJ2GD9T, B086KTHGB4, B07XMNF3B7

Low Revenue — High Return:

  • Products: B086N2Y81Z, B09LPJKVGH, B079YLPGSC

Low Revenue — Low Return:

  • Products: B09JBGGJ16, B09JB64V62, B09JB125NX

How To Access Vendor Central Sales Reports?

Vendors have two primary paths to access Sales reports: manual downloads or API automation.

Manual downloading occurs in your Vendor Central account interface. Automation taps into the Amazon Selling Partner API (Amazon SP-API) to automate report processing and storage in a cloud warehouse or data lake (see the Amazon docs here).

Manual Access via Vendor Central:

  1. Login: First, Vendors must log into their Amazon Vendor Central account.
  2. Navigate to Reports: Usually found in the main navigation bar, this section contains various sales, inventory, and performance reports.
  3. Locate the ‘Sales’ Within the Reports section
  4. Select Date Range: Amazon allows Vendors to pull reports based on specific dates. Choose the desired range.
  5. Download: Once the report has been generated, there will typically be an option to download it. The report is often available in different formats .csv or .xls.

Note: Manual downloads are more time-consuming and may not be ideal for frequent and up-to-date data analytics.

Automate And Unify Your Vendor Central Sales Data — Free For 30 Days

Openbridge API automation allows Amazon Vendors to save time manually downloading Sales reports, increasing data velocity and reducing errors in messy merging and tracking downloaded reports.

Start your journey towards data-driven growth and profit with Openbridge. Our code-free, fully automated Selling Partner API integration simplifies your Amazon Vendor Central operations.

Ready to automate and unify your Amazon Sales Data?

→ Sign up for a 30-day free trial of our Vendor Central Sales Report automation.


Automated Amazon Vendor Central Sales Reports was originally published in Openbridge on Medium, where people are continuing the conversation by highlighting and responding to this story.


from Openbridge - Medium https://ift.tt/aLX4Yh5
via Openbridge

Amazon Vendor Central Forecasting Report Automation

Explore the power of harnessing your Vendor Central Forecasting report data for growth

Forecast reports for Amazon Vendor Central contain valuable information for understanding and predicting customer demand for various products.

Per Amazon, the Forcast reports;

identify customer demand of the products for production and inventory planning purposes.

These reports are used for production and inventory planning, crucial aspects of retail operations, especially in a dynamic and competitive marketplace like Amazon.

What Is The Vendor Central Forecasting Report?

The forecasting reports provide a detailed, weekly demand forecast, enabling precise short- to medium-term planning. Data is reported at the ASIN level for the most recent weekly forecast generation date.

The granular report data is beneficial for managing inventory levels and ensuring supply aligns closely with expected demand.

Product Information: Detailed information about each product, possibly including SKU numbers, product names, categories, and other identifiers.

Historical Sales Data: Data on past sales, which could be segmented by periods (daily, weekly, monthly, etc.).

Demand Forecasts:

  • Mean Forecast
  • P70, P80, P90 Forecasts

Geographical Data: Since the reports are specified for the United States, they might include region-specific or state-specific demand forecasts.

Time Series Data: Forecasts might be provided for future periods, such as the next quarter, half-year, or full year.

Market Trends and Seasonality: Insights into how different times of the year or market trends impact product demand.

What Data Is Included In The Vendor Central Forecasting Report?

Here’s a breakdown of the columns included in the Vendor Central Forecasting Reports:

  1. ASIN and Product Information: The report contains columns for ‘ASIN’ (Amazon Standard Identification Number), ‘Product Title,’ and ‘Brand.’ This information is used to identify each product uniquely.
  2. Weekly Forecasts: The report provides weekly demand forecasts for various weeks. Each column seems to represent a specific week (like ‘Week 0 (7 Jan — 13 Jan)’, ‘Week 1 (14 Jan — 20 Jan)’, etc.), indicating the forecasted demand for each product in those weeks.
  3. Forecast: The report’s title suggests that these forecasts are mean (average), P70, P80, and P90. The numbers represent an average expected demand for each weekly product.
  4. Numerical Values: The values in the report are likely the forecasted quantities (units) expected to be sold each week.

The P70, P80, and P90 forecasts are valuable for risk management and inventory safety. By planning for a higher-than-average demand scenario; businesses can ensure sufficient stock to meet unexpected increases in demand, thus minimizing the risk of stockouts and potentially lost sales.

Next, we dig into what are P-levels and why they matter.

What Do P-levels Forecasting Reports Mean?

P-levels (such as P80, P90, etc.) are critical in inventory and demand planning, and they play a significant role in determining the level of buffer stock to maintain.

  1. P-Level (Probability Level): The ‘P’ in P-level stands for ‘probability’. P-level forecast provides an estimate of future demand with a certain confidence level. For instance, a P80 forecast indicates an 80% probability that actual demand will not exceed the forecasted amount.
  2. Buffer Stock Implications:
     — P80 Forecast: This forecast level suggests a moderate buffer stock. It indicates a balance between having enough inventory to meet most demand scenarios (80% probability) and not overstocking excessively.
     — P90 Forecast and Higher: As the P-level increases, it implies a higher buffer stock level. For example, a P90 forecast indicates a higher certainty (90% probability) that the actual demand will not exceed the forecasted amount, leading to more inventory being kept as a buffer to meet potential spikes in demand.
  3. Stock Availability: The CR or P-level is directly tied to the likelihood of an ASIN being in stock. A higher P-level means a greater probability that the product will be available throughout the buying horizon, reducing the risk of stockouts.
  4. Risk Management: Choosing the appropriate P-level is a risk management decision. Lower P-levels (like P80) might reduce carrying costs but increase the risk of stockouts. Higher P-levels (like P90) increase carrying costs but reduce the risk of losing sales due to stockouts.
  5. Strategic Decision Making: Businesses need to consider various factors like the cost of holding inventory, the likelihood of demand spikes, and the consequences of stockouts when deciding on the P-level for their forecasting.

Different P-level forecasts provide a range of scenarios from optimistic (lower P-levels) to conservative (higher P-levels). This allows businesses to plan their inventory and production strategies according to risk tolerance and operational objectives.

What are the benefits of the Amazon Vendor Central Forecasting Reports?

There are a few benefits of forecasting reports. By analyzing this data, businesses can identify trends, anticipate future demands, and adjust their strategies.

  1. Inventory Management: Helps determine how much stock to keep to meet customer demand without overstocking, which ties up capital and space, or understocking, which can lead to lost sales.
  2. Production Planning: Assists manufacturers in planning their production schedules, raw material procurement, and labor allocation based on anticipated product demand.
  3. Risk Mitigation: The probabilistic forecasts (P70, P80, P90) provide different scenarios, helping in planning for uncertainty and reducing the risk of unexpected demand fluctuations.
  4. Financial Forecasting and Budgeting: Essential for financial planning, including revenue projections and budgeting for marketing, logistics, and other operational expenses.
  5. Strategic Decision Making: Guides high-level strategy, including decisions on product development, market expansion, and promotional campaigns.
  6. Customer Satisfaction: Accurately predicting customer demand ensures that products are available when customers want them, thus enhancing customer satisfaction and loyalty.
  7. Customization for Market Needs: Account for regional market trends and consumer behaviors, enabling more tailored decision-making.
  8. Supply Chain Optimization: Accurate demand forecasting helps optimize the supply chain, from supplier orders to distribution strategies.

Forecast Reports Do Not Equal Purchase Orders

It is important to note that Forecasting reports provide a forecast for customer demand, not a promise of purchase orders. The report provides a forecast for unconstrained customer demand. Per Amazon, “If there are already on-hand or on-order units available to cover customer demand, this would be accounted for when the system issues purchase orders.”

How To Access Vendor Central Forecasting Reports?

Vendors have two primary paths to access reports: manual downloads or API automation.

Manual downloading occurs in your Vendor Central account interface. Automation taps into the Amazon Selling Partner API (Amazon SP-API) to automate report processing and storage in a cloud warehouse or data lake (see the Amazon docs here).

Manual Access via Vendor Central:

  1. Login: First, sellers must log into their Amazon Vendor Central account.
  2. Navigate to Reports: Usually found in the main navigation bar, this section contains various sales, inventory, and performance reports.
  3. Locate the ‘Forecasting’: Within the Reports section
  4. Select Date Range: Amazon allows sellers to pull reports based on specific dates. Choose the desired range.
  5. Download: Once the report has been generated, there will typically be an option to download it. The report is often available in different formats .csv or .xls.

Note: Manual downloads are more time-consuming and may not be ideal for frequent and up-to-date data analytics.

Automating Vendor Central Data:

The Amazon Selling Partner API (SP-API) allows for direct, automated access to Amazon forecasting data, making it easier for businesses to integrate it into their systems. Openbridge allows Amazon Vendors to save time manually downloading reports, increasing data velocity and reducing errors in messy merging and tracking downloaded reports.

Unlock Effortless Inventory Management With Our Code-Free Amazon Integration

Are you struggling with complex, messy forecasting data management for Vendor Central? Say goodbye to the hassle. Openbridge offers a seamless, automated solution that unifies your data into a private, trusted data warehouse or data lake like Amazon Redshift, Databricks, Google BigQuery, and more — all without a single line of code.

Why Choose Openbridge?

  • Automate with Ease: Skip the manual report downloads. Enjoy automated data feeds directly into your private cloud data warehouse or data lake.
  • Data-Driven Insights: Leverage high-velocity data for machine learning, business intelligence, and more.
  • Versatile Compatibility: Works effortlessly with Google Data Studio, Tableau, Microsoft Power BI, and other tools.

Openbridge automation extends beyond inventory to a broad collection of Amazon and non-Amazon data sources;

Automate And Unify Your Vendor Central Data — Free For 30 Days

Start your journey towards data-driven growth and profit with Openbridge. Our code-free, fully automated Selling Partner API integration simplifies your Amazon Vendor Central operations.

Ready to harness the power of your Amazon Forecasting data?

Sign Up Now for Your Free 30-day Trial For Vendor Central Forecasting Report Automation.


Amazon Vendor Central Forecasting Report Automation was originally published in Openbridge on Medium, where people are continuing the conversation by highlighting and responding to this story.


from Openbridge - Medium https://ift.tt/nxwCRtY
via IFTTT

Amazon Vendor Central Forecasting Report Automation

Explore the power of harnessing your Vendor Central Forecasting report data for growth

Forecast reports for Amazon Vendor Central contain valuable information for understanding and predicting customer demand for various products.

Per Amazon, the Forcast reports;

identify customer demand of the products for production and inventory planning purposes.

These reports are used for production and inventory planning, crucial aspects of retail operations, especially in a dynamic and competitive marketplace like Amazon.

What Is The Vendor Central Forecasting Report?

The forecasting reports provide a detailed, weekly demand forecast, enabling precise short- to medium-term planning. Data is reported at the ASIN level for the most recent weekly forecast generation date.

The granular report data is beneficial for managing inventory levels and ensuring supply aligns closely with expected demand.

Product Information: Detailed information about each product, possibly including SKU numbers, product names, categories, and other identifiers.

Historical Sales Data: Data on past sales, which could be segmented by periods (daily, weekly, monthly, etc.).

Demand Forecasts:

  • Mean Forecast
  • P70, P80, P90 Forecasts

Geographical Data: Since the reports are specified for the United States, they might include region-specific or state-specific demand forecasts.

Time Series Data: Forecasts might be provided for future periods, such as the next quarter, half-year, or full year.

Market Trends and Seasonality: Insights into how different times of the year or market trends impact product demand.

What Data Is Included In The Vendor Central Forecasting Report?

Here’s a breakdown of the columns included in the Vendor Central Forecasting Reports:

  1. ASIN and Product Information: The report contains columns for ‘ASIN’ (Amazon Standard Identification Number), ‘Product Title,’ and ‘Brand.’ This information is used to identify each product uniquely.
  2. Weekly Forecasts: The report provides weekly demand forecasts for various weeks. Each column seems to represent a specific week (like ‘Week 0 (7 Jan — 13 Jan)’, ‘Week 1 (14 Jan — 20 Jan)’, etc.), indicating the forecasted demand for each product in those weeks.
  3. Forecast: The report’s title suggests that these forecasts are mean (average), P70, P80, and P90. The numbers represent an average expected demand for each weekly product.
  4. Numerical Values: The values in the report are likely the forecasted quantities (units) expected to be sold each week.

The P70, P80, and P90 forecasts are valuable for risk management and inventory safety. By planning for a higher-than-average demand scenario; businesses can ensure sufficient stock to meet unexpected increases in demand, thus minimizing the risk of stockouts and potentially lost sales.

Next, we dig into what are P-levels and why they matter.

What Do P-levels Forecasting Reports Mean?

P-levels (such as P80, P90, etc.) are critical in inventory and demand planning, and they play a significant role in determining the level of buffer stock to maintain.

  1. P-Level (Probability Level): The ‘P’ in P-level stands for ‘probability’. P-level forecast provides an estimate of future demand with a certain confidence level. For instance, a P80 forecast indicates an 80% probability that actual demand will not exceed the forecasted amount.
  2. Buffer Stock Implications:
     — P80 Forecast: This forecast level suggests a moderate buffer stock. It indicates a balance between having enough inventory to meet most demand scenarios (80% probability) and not overstocking excessively.
     — P90 Forecast and Higher: As the P-level increases, it implies a higher buffer stock level. For example, a P90 forecast indicates a higher certainty (90% probability) that the actual demand will not exceed the forecasted amount, leading to more inventory being kept as a buffer to meet potential spikes in demand.
  3. Stock Availability: The CR or P-level is directly tied to the likelihood of an ASIN being in stock. A higher P-level means a greater probability that the product will be available throughout the buying horizon, reducing the risk of stockouts.
  4. Risk Management: Choosing the appropriate P-level is a risk management decision. Lower P-levels (like P80) might reduce carrying costs but increase the risk of stockouts. Higher P-levels (like P90) increase carrying costs but reduce the risk of losing sales due to stockouts.
  5. Strategic Decision Making: Businesses need to consider various factors like the cost of holding inventory, the likelihood of demand spikes, and the consequences of stockouts when deciding on the P-level for their forecasting.

Different P-level forecasts provide a range of scenarios from optimistic (lower P-levels) to conservative (higher P-levels). This allows businesses to plan their inventory and production strategies according to risk tolerance and operational objectives.

What are the benefits of the Amazon Vendor Central Forecasting Reports?

There are a few benefits of forecasting reports. By analyzing this data, businesses can identify trends, anticipate future demands, and adjust their strategies.

  1. Inventory Management: Helps determine how much stock to keep to meet customer demand without overstocking, which ties up capital and space, or understocking, which can lead to lost sales.
  2. Production Planning: Assists manufacturers in planning their production schedules, raw material procurement, and labor allocation based on anticipated product demand.
  3. Risk Mitigation: The probabilistic forecasts (P70, P80, P90) provide different scenarios, helping in planning for uncertainty and reducing the risk of unexpected demand fluctuations.
  4. Financial Forecasting and Budgeting: Essential for financial planning, including revenue projections and budgeting for marketing, logistics, and other operational expenses.
  5. Strategic Decision Making: Guides high-level strategy, including decisions on product development, market expansion, and promotional campaigns.
  6. Customer Satisfaction: Accurately predicting customer demand ensures that products are available when customers want them, thus enhancing customer satisfaction and loyalty.
  7. Customization for Market Needs: Account for regional market trends and consumer behaviors, enabling more tailored decision-making.
  8. Supply Chain Optimization: Accurate demand forecasting helps optimize the supply chain, from supplier orders to distribution strategies.

Forecast Reports Do Not Equal Purchase Orders

It is important to note that Forecasting reports provide a forecast for customer demand, not a promise of purchase orders. The report provides a forecast for unconstrained customer demand. Per Amazon, “If there are already on-hand or on-order units available to cover customer demand, this would be accounted for when the system issues purchase orders.”

How To Access Vendor Central Forecasting Reports?

Vendors have two primary paths to access reports: manual downloads or API automation.

Manual downloading occurs in your Vendor Central account interface. Automation taps into the Amazon Selling Partner API (Amazon SP-API) to automate report processing and storage in a cloud warehouse or data lake (see the Amazon docs here).

Manual Access via Vendor Central:

  1. Login: First, sellers must log into their Amazon Vendor Central account.
  2. Navigate to Reports: Usually found in the main navigation bar, this section contains various sales, inventory, and performance reports.
  3. Locate the ‘Forecasting’: Within the Reports section
  4. Select Date Range: Amazon allows sellers to pull reports based on specific dates. Choose the desired range.
  5. Download: Once the report has been generated, there will typically be an option to download it. The report is often available in different formats .csv or .xls.

Note: Manual downloads are more time-consuming and may not be ideal for frequent and up-to-date data analytics.

Automating Vendor Central Data:

The Amazon Selling Partner API (SP-API) allows for direct, automated access to Amazon forecasting data, making it easier for businesses to integrate it into their systems. Openbridge allows Amazon Vendors to save time manually downloading reports, increasing data velocity and reducing errors in messy merging and tracking downloaded reports.

Unlock Effortless Inventory Management With Our Code-Free Amazon Integration

Are you struggling with complex, messy forecasting data management for Vendor Central? Say goodbye to the hassle. Openbridge offers a seamless, automated solution that unifies your data into a private, trusted data warehouse or data lake like Amazon Redshift, Databricks, Google BigQuery, and more — all without a single line of code.

Why Choose Openbridge?

  • Automate with Ease: Skip the manual report downloads. Enjoy automated data feeds directly into your private cloud data warehouse or data lake.
  • Data-Driven Insights: Leverage high-velocity data for machine learning, business intelligence, and more.
  • Versatile Compatibility: Works effortlessly with Google Data Studio, Tableau, Microsoft Power BI, and other tools.

Openbridge automation extends beyond inventory to a broad collection of Amazon and non-Amazon data sources;

Automate And Unify Your Vendor Central Data — Free For 30 Days

Start your journey towards data-driven growth and profit with Openbridge. Our code-free, fully automated Selling Partner API integration simplifies your Amazon Vendor Central operations.

Ready to harness the power of your Amazon Forecasting data?

Sign Up Now for Your Free 30-day Trial For Vendor Central Forecasting Report Automation.


Amazon Vendor Central Forecasting Report Automation was originally published in Openbridge on Medium, where people are continuing the conversation by highlighting and responding to this story.


from Openbridge - Medium https://ift.tt/FVPeEio
via Openbridge

Digging Into Amazon Vendor Central Inventory Reports

A deep dive into the Vendor Central Inventory Reports

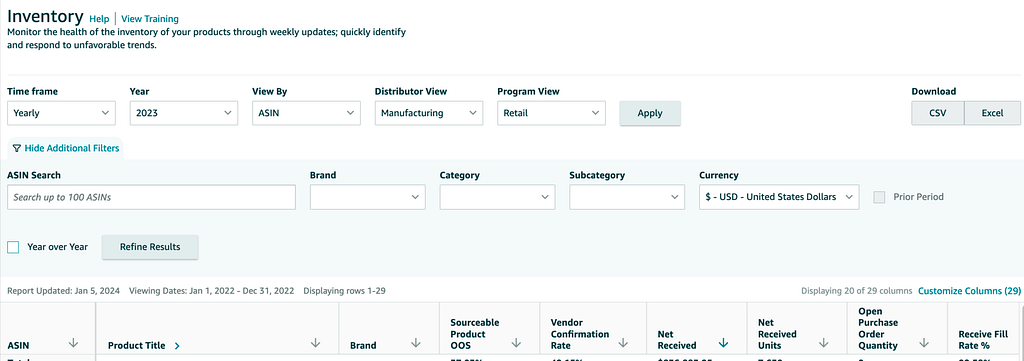
Amazon offers Vendor Central accounts a set of Inventory Reports via Amazon Retail Analytics (ARA).

Specifically, Amazon states these reports;

Monitor the health of the inventory of your products through weekly updates; quickly identify and respond to unfavorable trends.

As such, Vendor Central Inventory Reports are valuable for manufacturers, retailers, and supply chain managers in making informed decisions on the health of their Amazon business.

What are the benefits of the Amazon Vendor Central Inventory Reports?

There are a few benefits; specifically, the inventory reports aid in optimizing inventory levels, improving vendor relationships, enhancing customer satisfaction, and maintaining a healthy financial status. By analyzing this data, businesses can identify trends, anticipate future demands, and adjust their strategies.

  • Inventory Management: They provide a comprehensive view of the inventory status, including stock levels, order quantities, and aged inventory. This helps in managing inventory more efficiently, reducing overstock or stockout situations.
  • Vendor Performance Analysis: Metrics like vendor confirmation rate and lead time offer insights into vendor reliability and performance, enabling better vendor management and selection.
  • Financial Planning: Information on the net value of received inventory and sellable aged inventory assists in financial planning and forecasting.
  • Supply Chain Optimization: The reports can identify supply chain bottlenecks, such as products with high unfilled customer orders or long vendor lead times.
  • Customer Satisfaction: Businesses can improve customer satisfaction by monitoring out-of-stock rates and unfilled customer orders.
  • Health of Inventory: Tracking unhealthy units helps maintain inventory quality and reduces losses due to damaged or expired products.

What Data Is Included In The Vendor Central Inventory Report?

Here’s a breakdown of the columns included in the Vendor Central Inventory Report (Manufacturing):

  • ASIN (Amazon Standard Identification Number): A unique identifier for each product listed on Amazon.
  • Product Title: The name or title of the product.
  • Brand: The brand associated with each product.
  • Sourceable: Indicates if the product is sourceable or not.
  • Product OOS (Out of Stock) Vendor Confirmation Rate: The rate at which vendors confirm out-of-stock situations.
  • Net Received: The net value of received inventory.
  • Net Received Units: The total number of units received.
  • Open Purchase Order Quantity: The quantity of products on available purchase orders.
  • Receive Fill Rate %: The percentage of orders filled upon receipt.
  • Overall Vendor Lead Time (days): The average time vendors take to fulfill orders.
  • Unfilled Customer Ordered Units: The number of customer orders that remain unfilled.
  • Aged 90+ Days Sellable Inventory: The value of inventory that has been sellable but aged over 90 days.
  • Unhealthy Units: The count of units considered unhealthy (e.g., damaged, expired, etc.).

The Vendor Central Inventory Sourcing report contains data similar to the manufacturing report, with a few notable differences. Here’s a breakdown of the columns in the sourcing report:

  • ASIN (Amazon Standard Identification Number)
  • Product Title
  • Brand
  • Vendor Confirmation Rate: The rate at which vendors confirm the sourcing of products.
  • Net Received: The net value of received inventory.
  • Net Received Units: The number of units received.
  • Open Purchase Order Quantity
  • Receive Fill Rate %
  • Overall Vendor Lead Time (days)
  • Aged 90+ Days Sellable Inventory: The value of inventory that has been sellable but aged over 90 days.
  • Unhealthy Units

How To Access Vendor Central Inventory Reports?

Vendors have two primary paths to access reports: manual downloads or API automation.

Manual downloading occurs in your Vendor Central account interface. Automation taps into the Amazon Selling Partner API (Amazon SP-API) to automate report processing and storage in a cloud warehouse or data lake (see the Amazon docs here).

Manual Access via Vendor Central:

  1. Login: First, Vendors must log into their Amazon Vendor Central account.
  2. Navigate to Reports: Usually found in the main navigation bar, this section contains various sales, inventory, and performance reports.
  3. Locate the ‘Inventory’ within the Reports section
  4. Select Date Range: Amazon allows Vendors to pull reports based on specific dates. Choose the desired range.
  5. Download: Once the report has been generated, there will typically be an option to download it. The report is often available in different formats .csv or .xls.

Note: Manual downloads are more time-consuming and may not be ideal for frequent and up-to-date data analytics.

Automating Vendor Central Data:

The Amazon Selling Partner API (SP-API) allows for direct, automated access to Amazon Vendor data, making it easier for businesses to integrate it into their systems. Openbridge allows Amazon Vendors to save time manually downloading reports, increasing data velocity and reducing errors in messy merging and tracking downloaded reports.

The following are just a few examples of reports you can create with automated data using tools such as Google Data Studio, Tableau, Microsoft Power BI, Looker, or Amazon Quicksight:

  1. Vendor Confirmation Rate by Brand: A bar chart showing the vendor confirmation rate for different brands. This could provide insights into which brands have more reliable supply chains.
  2. Net Received Units versus Open Purchase Order Quantity: A scatter plot comparing the number of units received against the quantity ordered for each product. This could highlight discrepancies and efficiency in fulfilling orders.
  3. Overall Vendor Lead Time: A histogram or box plot displaying the distribution of vendor lead times. This would help in understanding the variability in lead times across products.
  4. Aged Inventory: A pie chart showing the proportion of inventory aged over 90 days for different products. This is useful for inventory health analysis.

Unlock Effortless Inventory Management With Our Code-Free Amazon Integration

Are you struggling with complex, messy inventory data management for Vendor Central? Say goodbye to the hassle. Openbridge offers a seamless, automated solution that unifies your data into a private, trusted data warehouse or data lake like Amazon Redshift, Databricks, Google BigQuery, and more — all without a single line of code.

Why Choose Openbridge?

  • Automate with Ease: Skip the manual report downloads. Enjoy automated data feeds directly into your private cloud data warehouse or data lake.
  • Data-Driven Insights: Leverage high-velocity data for machine learning, business intelligence, and more.
  • Versatile Compatibility: Works effortlessly with Google Data Studio, Tableau, Microsoft Power BI, and other tools.

Openbridge automation extends beyond inventory to a broad collection of Amazon and non-Amazon data sources;

Automate And Unify Your Vendor Central Inventory Data — Free For 30 Days

Start your journey towards data-driven growth and profit with Openbridge. Our code-free, fully automated Selling Partner API integration simplifies your Amazon Vendor Central operations.

Ready to Transform Your Amazon Inventory Data?

→ Sign up for a 30-day free trial of our Vendor Central Inventory Report automation.


Digging Into Amazon Vendor Central Inventory Reports was originally published in Openbridge on Medium, where people are continuing the conversation by highlighting and responding to this story.


from Openbridge - Medium https://ift.tt/qHClGMI
via IFTTT

Digging Into Amazon Vendor Central Inventory Reports

A deep dive into the Vendor Central Inventory Reports

Amazon offers Vendor Central accounts a set of Inventory Reports via Amazon Retail Analytics (ARA).

Specifically, Amazon states these reports;

Monitor the health of the inventory of your products through weekly updates; quickly identify and respond to unfavorable trends.

As such, Vendor Central Inventory Reports are valuable for manufacturers, retailers, and supply chain managers in making informed decisions on the health of their Amazon business.

What are the benefits of the Amazon Vendor Central Inventory Reports?

There are a few benefits; specifically, the inventory reports aid in optimizing inventory levels, improving vendor relationships, enhancing customer satisfaction, and maintaining a healthy financial status. By analyzing this data, businesses can identify trends, anticipate future demands, and adjust their strategies.

  • Inventory Management: They provide a comprehensive view of the inventory status, including stock levels, order quantities, and aged inventory. This helps in managing inventory more efficiently, reducing overstock or stockout situations.
  • Vendor Performance Analysis: Metrics like vendor confirmation rate and lead time offer insights into vendor reliability and performance, enabling better vendor management and selection.
  • Financial Planning: Information on the net value of received inventory and sellable aged inventory assists in financial planning and forecasting.
  • Supply Chain Optimization: The reports can identify supply chain bottlenecks, such as products with high unfilled customer orders or long vendor lead times.
  • Customer Satisfaction: Businesses can improve customer satisfaction by monitoring out-of-stock rates and unfilled customer orders.
  • Health of Inventory: Tracking unhealthy units helps maintain inventory quality and reduces losses due to damaged or expired products.

What Data Is Included In The Vendor Central Inventory Report?

Here’s a breakdown of the columns included in the Vendor Central Inventory Report (Manufacturing):

  • ASIN (Amazon Standard Identification Number): A unique identifier for each product listed on Amazon.
  • Product Title: The name or title of the product.
  • Brand: The brand associated with each product.
  • Sourceable: Indicates if the product is sourceable or not.
  • Product OOS (Out of Stock) Vendor Confirmation Rate: The rate at which vendors confirm out-of-stock situations.
  • Net Received: The net value of received inventory.
  • Net Received Units: The total number of units received.
  • Open Purchase Order Quantity: The quantity of products on available purchase orders.
  • Receive Fill Rate %: The percentage of orders filled upon receipt.
  • Overall Vendor Lead Time (days): The average time vendors take to fulfill orders.
  • Unfilled Customer Ordered Units: The number of customer orders that remain unfilled.
  • Aged 90+ Days Sellable Inventory: The value of inventory that has been sellable but aged over 90 days.
  • Unhealthy Units: The count of units considered unhealthy (e.g., damaged, expired, etc.).

The Vendor Central Inventory Sourcing report contains data similar to the manufacturing report, with a few notable differences. Here’s a breakdown of the columns in the sourcing report:

  • ASIN (Amazon Standard Identification Number)
  • Product Title
  • Brand
  • Vendor Confirmation Rate: The rate at which vendors confirm the sourcing of products.
  • Net Received: The net value of received inventory.
  • Net Received Units: The number of units received.
  • Open Purchase Order Quantity
  • Receive Fill Rate %
  • Overall Vendor Lead Time (days)
  • Aged 90+ Days Sellable Inventory: The value of inventory that has been sellable but aged over 90 days.
  • Unhealthy Units

How To Access Vendor Central Inventory Reports?

Vendors have two primary paths to access reports: manual downloads or API automation.

Manual downloading occurs in your Vendor Central account interface. Automation taps into the Amazon Selling Partner API (Amazon SP-API) to automate report processing and storage in a cloud warehouse or data lake (see the Amazon docs here).

Manual Access via Vendor Central:

  1. Login: First, Vendors must log into their Amazon Vendor Central account.
  2. Navigate to Reports: Usually found in the main navigation bar, this section contains various sales, inventory, and performance reports.
  3. Locate the ‘Inventory’ within the Reports section
  4. Select Date Range: Amazon allows Vendors to pull reports based on specific dates. Choose the desired range.
  5. Download: Once the report has been generated, there will typically be an option to download it. The report is often available in different formats .csv or .xls.

Note: Manual downloads are more time-consuming and may not be ideal for frequent and up-to-date data analytics.

Automating Vendor Central Data:

The Amazon Selling Partner API (SP-API) allows for direct, automated access to Amazon Vendor data, making it easier for businesses to integrate it into their systems. Openbridge allows Amazon Vendors to save time manually downloading reports, increasing data velocity and reducing errors in messy merging and tracking downloaded reports.

The following are just a few examples of reports you can create with automated data using tools such as Google Data Studio, Tableau, Microsoft Power BI, Looker, or Amazon Quicksight:

  1. Vendor Confirmation Rate by Brand: A bar chart showing the vendor confirmation rate for different brands. This could provide insights into which brands have more reliable supply chains.
  2. Net Received Units versus Open Purchase Order Quantity: A scatter plot comparing the number of units received against the quantity ordered for each product. This could highlight discrepancies and efficiency in fulfilling orders.
  3. Overall Vendor Lead Time: A histogram or box plot displaying the distribution of vendor lead times. This would help in understanding the variability in lead times across products.
  4. Aged Inventory: A pie chart showing the proportion of inventory aged over 90 days for different products. This is useful for inventory health analysis.

Unlock Effortless Inventory Management With Our Code-Free Amazon Integration

Are you struggling with complex, messy inventory data management for Vendor Central? Say goodbye to the hassle. Openbridge offers a seamless, automated solution that unifies your data into a private, trusted data warehouse or data lake like Amazon Redshift, Databricks, Google BigQuery, and more — all without a single line of code.

Why Choose Openbridge?

  • Automate with Ease: Skip the manual report downloads. Enjoy automated data feeds directly into your private cloud data warehouse or data lake.
  • Data-Driven Insights: Leverage high-velocity data for machine learning, business intelligence, and more.
  • Versatile Compatibility: Works effortlessly with Google Data Studio, Tableau, Microsoft Power BI, and other tools.

Openbridge automation extends beyond inventory to a broad collection of Amazon and non-Amazon data sources;

Automate And Unify Your Vendor Central Inventory Data — Free For 30 Days

Start your journey towards data-driven growth and profit with Openbridge. Our code-free, fully automated Selling Partner API integration simplifies your Amazon Vendor Central operations.

Ready to Transform Your Amazon Inventory Data?

→ Sign up for a 30-day free trial of our Vendor Central Inventory Report automation.


Digging Into Amazon Vendor Central Inventory Reports was originally published in Openbridge on Medium, where people are continuing the conversation by highlighting and responding to this story.


from Openbridge - Medium https://ift.tt/GkZTgC9
via Openbridge

Data Lake vs Data Warehouse: Which Is Better?

Avoiding the data warehouse vs data lake hype and misinformation

It is not uncommon to see a data lake framed as just “storage,” or claims are made that a data warehouse is a lake. As a result, this narrow dialogue gets stuck on consultant or vendor talking points that artificially pit both models against each other.

The innovative, strategic discussion is about how a lake and warehouse are designed to work in tandem. Specific jobs and tasks, traditionally done in a warehouse, can be offloaded to a data lake for cost efficiency. Pairing the two can ensure flexibility across both engineering and business capabilities.

Ultimately, the warehouse and data lake service model are about delivering business value.

Below, we have compiled a few posts on the topic


Data Lake vs Data Warehouse: Which Is Better? was originally published in Openbridge on Medium, where people are continuing the conversation by highlighting and responding to this story.


from Openbridge - Medium https://ift.tt/T0pYOhS
via IFTTT

Building An Amazon Marketing Cloud Clean Room

Enhancing Data Privacy & Collaboration With A Private, Trusted Amazon Marketing Cloud Clean Room

The term “Data Clean Rooms (DCRs)” is often used in conjunction with descriptions of Amazon Marketing Cloud. But what, exactly, is a DCR? A DCR provides a protected setting where various organizations or sections of a single organization can collectively analyze data while adhering to specific rules and limitations to ensure data security.

AMC Clean Room and Cloud DSP

Amazon offers what they describe as an “Amazon Marketing Cloud Clean Room” to house the data and an interface to issue SQL queries. However, a DCR is not limited to the Amazon Ads AMC.

Did you realize platforms like Snowflake, Google BigQuery, Databricks, and others can also operate as an Amazon DCR? They can! This means there are two types of clean rooms available;

  1. Amazon Ads developed and managed AMC Clean Room
  2. Cloud Platform Clean Room (Snowflake, Google BigQuery, Databricks, AWS Clean Rooms, and many others)

We will go into the variations on each below.

Amazon Marketing Cloud “Clean Room”

AMC’s integration with Cloud DSP (Demand-Side Platform) is built and managed by the Amazon Ads team, on top of AWS infrastructure.

The Amazon Ads AMC DCR environment allows advertisers to combine and analyze their data with aggregated, anonymized Amazon data without compromising user privacy. The clean room concept is particularly relevant in an era where data privacy concerns are paramount. It provides a secure space where advertisers can glean insights from vast datasets while adhering to stringent data privacy standards.

This powerful tool enables advertisers to buy display, video, and audio ads programmatically. Integrating Cloud DSP within AMC offers a seamless experience for managing advertising campaigns across Amazon’s ecosystem and beyond. Teams can unify sales and marketing data from sources like Amazon Selling Partner, Amazon Advertising, Google Ads, Facebook Marketing, Shopify, and many others to private DCRs in data lakes or cloud warehouses.

This feature is particularly beneficial for businesses looking to enhance their reach and impact across various platforms while maintaining control and visibility over their campaigns.

Private, Trusted, Owned Cloud Data Warehouse Platform Clean Room

Unlike the Amazon Ads AMC Clean Room, platform-based DCRs do not have Amazon DSP requirements. You have full control and flexibility to define what resides in your DCR and how it should be used.

Example BigQuery Clean Room Model

Using platforms like Snowflake, Google BigQuery, Azure, AWS, and Databricks, these types of solutions offer substantial benefits for data-clean rooms (DCR) and non-DCR use cases.

In DCR scenarios, these tools ensure data security and privacy, a critical aspect of compliance with regulations like GDPR and CCPA. They enable secure data sharing and collaboration within an organization and with external partners without exposing sensitive raw data.

This is particularly beneficial for projects that require joint data insights while maintaining strict data privacy.

Databricks Clean Room Reference Model

For non-DCR use cases, these platforms offer a unified data environment that is highly scalable and efficient. They can handle large volumes of data, making them ideal for advanced analytics and machine learning tasks across various business functions.

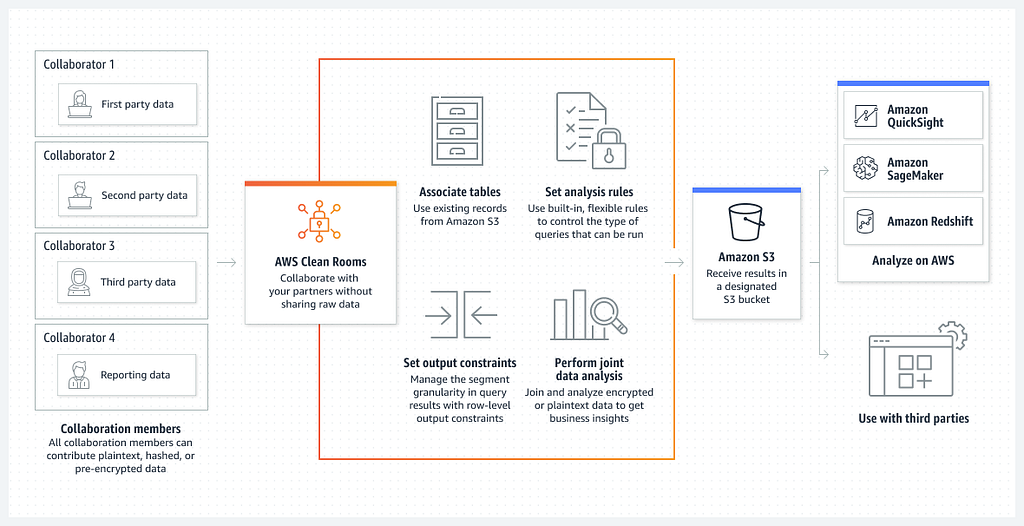
AWS Clean Room Model

Their flexibility in integrating with diverse data sources and formats makes them versatile tools for various data management needs. Comprehensive data governance ensures accuracy and consistency, enhancing overall data quality and supporting responsible data usage across different business applications.

Industry Standard, Robust Ecosystems

The robust ecosystem surrounding data warehouse solutions like Snowflake, Google BigQuery, Azure, AWS, and Databricks significantly enhances their utility.

They are natively supported by a wide range of data visualization, machine learning, reporting, query, and business intelligence (BI) tools, enabling comprehensive data analysis and insight generation. Get the data you need to fuel your favorite reporting, data visualization, SQL, or data science tools like Tableau, Microsoft Power BI, Looker, Amazon Quicksight, SAP, SAS, and others.

These integrations with advanced analytics and machine learning tools allow businesses to derive deeper insights from their data, facilitating data-driven decision-making.

The compatibility with various data visualization and BI tools makes it easier for businesses to interpret complex data sets and effectively communicate findings across the organization.

This ecosystem streamlines the data analysis and empowers businesses to leverage their data clean room environment for strategic advantage, optimizing operations and enhancing customer experiences.

Take the next step — for free

Want to activate BigQuery, Snowflake, Databricks, Amazon Athena, and Azure Data Lake clean rooms? You can create clean rooms in minutes and quickly analyze datasets with your partners.

Openbridge offers code-free, fully automated data pipelines to a private, trusted cloud warehouse or data lake clean room. With your data unified, you can use your favorite analytic tools like Power BI, Looker, Tableau, and others for internal teams or external partners.

By providing advertisers with automated, direct first-party data, Openbridge accelerates the speed at which your team's team can collaborate, share, and gain valuable insights that deliver data-driven growth and profit.

Get a 30-day free trial of the code-free Openbridge data integration for Amazon Advertising, Amazon Selling Partner, and Amazon Vendor Central.


Building An Amazon Marketing Cloud Clean Room was originally published in Openbridge on Medium, where people are continuing the conversation by highlighting and responding to this story.


from Openbridge - Medium https://ift.tt/hicvgST
via IFTTT

What is a good ACoS on Amazon?

Amazon ACoS insights

The Amazon Seller’s Playbook: Defining a ‘Good’ Amazon ACoS for Maximum Profit

We recently covered the topic of TACoS in Data-Driven Amazon TACoS Insights for Sellers and Vendors using Amazon Advertising. For this post we shift focus to another key metric: Amazon ACoS.

What is a good ACoS? Reference By Product Category

What is a good ACoS for Amazon PPC ?A good Advertising Cost of Sale (ACoS) on Amazon can vary widely depending on the category of products, the market’s competitiveness, and the seller’s goals.

The reference values below are based on standard ACoS calculation:

  • ACOS = (ad spend ÷ ad revenue) x 100

Below are a number of reference point categorizing ACoS percentages by product category. These are guideposts to illustrate Amazon’s average ACoS benchmarks for the following categories. The data is source from Amazon Brand Metric reports. (Note: These numbers can vary daily, so reference the latest data sets from Amazon on the topic):

Appliances

  • Top 25%: 12%
  • Typical: 16%
  • Bottom 25%: 17%

Arts, Crafts & Sewing

  • Top 25%: 12%
  • Typical: 17%
  • Bottom 25%: 20%

Automotive

  • Top 25%: 20%
  • Typical: 28%
  • Bottom 25%: 39%

Baby

  • Top 25%: 23%
  • Typical: 35%
  • Bottom 25%: 55%

Beauty & Personal Care

  • Top 25%: 18%
  • Typical: 29%
  • Bottom 25%: 50%

Clothing, Shoes & Jewelry

  • Top 25%: 15%
  • Typical: 20%
  • Bottom 25%: 30%

Electronics

  • Top 25%: 10%
  • Typical: 16%
  • Bottom 25%: 25%

Grocery & Gourmet Food

  • Top 25%: 20%
  • Typical: 29%
  • Bottom 25%: 46%

Grocery Store

  • Top 25%: 18%
  • Typical: 25%
  • Bottom 25%: 35%

Health & Household

  • Top 25%: 20%
  • Typical: 30%
  • Bottom 25%: 45%

Health & Personal Care

  • Top 25%: 15%
  • Typical: 25%
  • Bottom 25%: 44%

Home & Garden

  • Top 25%: 15%
  • Typical: 20%
  • Bottom 25%: 30%

Home & Kitchen

  • Top 25%: 18%
  • Typical: 25%
  • Bottom 25%: 35%

Industrial & Scientific

  • Top 25%: 25%
  • Typical: 35%
  • Bottom 25%: 45%

Musical Instruments

  • Top 25%: 13%
  • Typical: 19%
  • Bottom 25%: 29%

Office Products

  • Top 25%: 20%
  • Typical: 35%
  • Bottom 25%: 45%

Patio, Lawn & Garden

  • Top 25%: 13%
  • Typical: 19%
  • Bottom 25%: 28%

Sports & Outdoors

  • Top 25%: 12%
  • Typical: 22%
  • Bottom 25%: 34%

Tools & Home Improvement

  • Top 25%: 16%
  • Typical: 25%
  • Bottom 25%: 35%

Toys & Games

  • Top 25%: 11%
  • Typical: 16%
  • Bottom 25%: 26%

As you can see, the low ACoS for one category will differ from the high ACoS for another. So, what is a good ACoS for Amazon Ads for one brand may be poor for a different brand in an alternate category. As a result, a target ACoS should be defined relative to your business benchmarks and the category for which you operate. If you are not using Brand Metrics already, you may want to start looking at this data from Amazon.

Why Is Amazon ACoS Important?

Generally, a lower ACoS indicates a more efficient advertising spend relative to sales, but the ideal ACoS can depend on your specific business objectives.

  1. For Profit Maximization: If your goal is to maximize profit, a good ACoS is typically lower than your profit margin. This ensures that your advertising costs don’t eat into your profits. For instance, if your profit margin is 30%, you would ideally want an ACoS lower than 30%.
  2. For Market Penetration or Brand Awareness: If you are more focused on gaining market share or building brand awareness, you might be willing to accept a higher ACoS. You invest in future sales or brand recognition rather than immediate profitability.
  3. Industry Benchmarks: ACoS also varies by industry. Some products have higher average ACoS due to intense competition or higher costs per click (CPC). It’s helpful to research industry benchmarks for a more accurate picture of what constitutes a good ACoS in your specific market.
  4. Balancing ACoS with Other Metrics: While ACoS is an important metric, it should be considered alongside other key performance indicators like total sales, conversion rate, and return on ad spend (ROAS). A balanced approach ensures you’re not overly focusing on one metric at the expense of overall business health.
  5. Dynamic Nature of ACoS: Remember that ACoS can fluctuate based on various factors like seasonality, changes in competition, and Amazon’s platform changes. Regularly reviewing and adjusting your strategies based on current data is essential.

Ultimately, a good ACoS on Amazon aligns with your business goals, whether maximizing immediate profitability, investing in long-term brand growth, or balancing various performance metrics. It’s crucial to continuously monitor and adjust your advertising strategies to maintain an optimal ACoS.

Amazon Data sets for data-driven ACoS analytics

Optimizing Amazon Advertising Campaigns for Sellers and Vendors ensures efficient ad revenue requires data. Amazon Ads offers a collection of data feeds to assist with those insights efforts:

In addition to Amazon Ads data, there is a broad collection of retail information available:

What are the challenges to achieving a good ACoS on Amazon?

Achieving a reasonable Advertising Cost of Sale (ACoS) on Amazon can be challenging due to several factors:

  • High Competition: Many product categories on Amazon are highly competitive. More sellers bidding for the same keywords can significantly increase the cost per click (CPC). This can lead to a higher ACoS, especially in popular categories or trending products.
  • Keyword Optimization: Selecting the right keywords is crucial for effective advertising. The challenge lies in identifying keywords that are not only relevant but also cost-effective. Overly broad keywords can lead to irrelevant traffic and low conversion rates, while particular keywords might have lower search volumes.
  • Budget Constraints: Smaller businesses or new sellers might have limited advertising budgets. This constraint can make it difficult to compete with established sellers who can afford to spend more on advertising and absorb higher ACoS for extended periods.
  • Changing Market Trends and Consumer Preferences: Consumer trends and preferences can change rapidly. Keeping up with these changes and adjusting advertising strategies is a constant challenge. What works today might not be effective tomorrow.
  • Product Pricing and Profit Margins: Products with lower profit margins are more sensitive to advertising costs. Even a relatively low ACoS can be too high if the profit margin is slim. Pricing strategies must be carefully balanced with advertising spend.
  • Amazon’s Algorithm Changes: Amazon regularly updates its algorithms, which can affect how products are displayed and how ads perform. These unpredictable changes may require sellers to adapt their strategies continuously.
  • Ad Campaign Management Skills: Effective management of Amazon ad campaigns requires skill and experience. This includes understanding different ad format targeting options and using Amazon’s analytics tools effectively. For those new to Amazon advertising, there is a learning curve to overcome.
  • Seasonality and Market Fluctuations: Sales and advertising effectiveness can vary greatly depending on the season or current market conditions. This fluctuation requires sellers to adapt their strategies throughout the year, which can be challenging, especially for products with seasonal demand.
  • Brand Awareness and Product Reviews: New or lesser-known brands may struggle to achieve a good ACoS compared to well-established brands. Positive product reviews and strong brand awareness can significantly improve conversion rates, but building these takes time and effort.
  • Inventory Management: Running successful ad campaigns can lead to increased sales, but if inventory management isn’t aligned, it can result in stockouts, leading to lost sales opportunities and potentially increased ACoS when ads run while products are out of stock.

How to reduce ACoS on Amazon

Let’s look at the data

Using ACoS is one of many KPIs for the efficiency of your Amazon Ad Campaign. Reducing ACoS not only improves the profitability of ad sales but also enhances the overall health of your Amazon sales strategy.

Here are some opportunities on how to reduce ACoS on Amazon:

  1. Optimize Your Product Listings: Amazon Listing Optimization is crucial. A well-optimized product page with high-quality images, detailed descriptions, and relevant keywords can improve organic sales, reducing reliance on Sponsored Ads for revenue. This balance between organic sales and ad sales helps maintain a lower ACoS.
  2. Focus on High-Performing Keywords: Analyze your Amazon Seller Central data to identify which keywords are driving sales. Investing more in these keywords in your Amazon Advertising Campaigns can yield better returns, thus lowering the ACoS.
  3. Leverage Amazon Sponsored Brand and Sponsored Display Ads: These advertising formats can help increase visibility and drive more targeted traffic to your product page, potentially increasing sales revenue and decreasing the ACoS.
  4. Monitor and Adjust Total Ad Spend: Regularly review your total ad spend concerning the sales revenue generated. Keeping a close eye on this ratio helps make informed decisions about where to allocate your advertising budget most effectively.
  5. Analyze and Compare with Amazon Benchmark: Regularly compare your category’s ACoS with the Amazon Benchmark. Understanding where you stand about the average can guide you in adjusting your strategies to align with or outperform the benchmark.
  6. Adjust Product Cost and Pricing Strategy: If feasible, reviewing and adjusting the product cost can be a strategy. A competitive pricing strategy can lead to an increase in sales volume, potentially lowering the ACoS.
  7. Utilize Amazon FBA: For many sellers, using Amazon Fulfillment by Amazon (FBA) can lead to increased sales due to the Prime eligibility of products, which can help in reducing ACoS.
  8. Integrate with Other Platforms like Google Ads: Integrating your Amazon Ad Campaign with other platforms like Google Ads can drive additional traffic to your Amazon product page, potentially increasing sales and lowering ACoS.
  9. Experiment with Different Advertising Campaign Types: Don’t just stick to one type of campaign. Experiment with different kinds of Amazon Sponsored Ads to see which ones yield the best return on investment.
  10. Conduct Regular Campaign Audits: Regular audits of your Amazon Advertising Campaigns can uncover inefficiencies and areas for optimization. This continuous improvement process is vital to maintaining a healthy ACoS.

Reducing ACoS on Amazon requires a multifaceted approach that combines Amazon Listing Optimization, strategic advertising, and continuous performance monitoring. By focusing on these areas, Amazon Sellers can effectively lower their ACoS, leading to more profitable advertising campaigns and a healthier balance between organic sales and ad-driven revenue.

Get Started

No more manual file downloads to calculate TACoS, ROAS, ACoS, and other Amazon KPIs. Pair all of your Amazon Ads campaign data sets with Amazon Retail data feeds for a 360 view of your Seller or Vendor business.

Openbridge will collect, catalog, and unify to a private, trusted industry-leading cloud data warehouses and lakes like Azure, Snowflake, BigQuery, AWS, or Databricks. One your Amazon data is unified, you can use your favorite analytic tools like Power BI, Looker, Tableau, and many others for data-driven insights.

Get a 30-day free trial of the code-free Openbridge data integration for Amazon Advertising, Amazon Selling Partner, and Amazon Vendor Central.


What is a good ACoS on Amazon? was originally published in Openbridge on Medium, where people are continuing the conversation by highlighting and responding to this story.


from Openbridge - Medium https://ift.tt/9uGTy4z
via IFTTT