Discover the Power of Amazon Automation

How to Transform Your Amazon Seller or Amazon Vendor Business and Increase Sales With Automation

Automation can help businesses operating on Amazon save time and resources and improve efficiency and accuracy.

Why is Amazon automation important? Here are the principal benefits of automation;

  1. Streamline Your Operations: Amazon automation can help you to streamline various tasks and processes within the Amazon ecosystem, such as managing inventory, tracking and fulfilling orders, and managing customer interactions, saving you time and resources.
  2. Improve Efficiency and Accuracy: By automating tasks and processes on Amazon, you can reduce the risk of errors and improve the efficiency and accuracy of your operations, helping you to deliver a better customer experience.
  3. Support Business Growth and Scalability: As your business grows, Amazon automation can help you to scale your operations and support the growth of your business, allowing you to take on more orders and customers without increasing your workload.
  4. Save Money: By automating tasks and processes on Amazon, you can reduce your labor costs and other expenses, helping you to save money and improve your bottom line.
  5. Stay Ahead of the Competition: By using Amazon automation tools and services, you can stay ahead of the competition and gain a competitive edge, helping you to attract more customers and drive more sales on the platform.
  6. Customize Your Automation: With Amazon automation, you can customize the automation solutions to meet your business's specific needs and goals, allowing you to tailor your automation to your unique business model.
  7. Easy to Use: Many Amazon automation tools and services are user-friendly and easy to use, even for those new to automation, making it easy for you to get started with automation and see results quickly.
  8. Stay Compliant with Amazon’s Policies: By using Amazon automation tools and services that are compliant with Amazon’s policies and terms of service, you can ensure that your automation efforts are in line with the company’s rules and regulations.

Amazon Automation uses technology and processes to automate various tasks and operations within the Amazon ecosystem. This can include automating the listing of products, managing inventory, warehouse operations, tracking and fulfilling orders, and managing customer interactions.

Amazon Automation is an essential tool for FBA Sellers or Vendors operating on Amazon, as it can help to improve efficiency, accuracy, scalability, and competitiveness.

How does Amazon automation work?

Amazon Automation uses technology and processes to automate various tasks and procedures within the Amazon ecosystem. This can be done using a combination of Amazon’s services and tools and third-party software and services that integrate with Amazon’s API (Application Programming Interface).

For example, a business operating on Amazon may use Amazon FBA (Fulfillment by Amazon) to store its products in Amazon’s fulfillment centers, where they are then picked, packed, and shipped by Amazon when an order is placed. This can help the business to save time and resources on order fulfillment.

The business may also use Amazon SP-API (formerly MWS — Marketplace Web Service) to automate various tasks and processes on Amazon, such as listing products, managing orders and inventory, and processing payments. This can be done using APIs (Application Programming Interfaces) that allow the business to connect its systems with Amazon’s systems and automate various tasks and processes.

For more information on the Amazon Selling Partner API, see Amazon Releases New Selling Partner API (SP-API). Also, Amazon has extended the API to support Vendors as well! See Unlocking Amazon Vendor Central Data With New API.

In addition, the business may use third-party tools that integrate with Amazon’s API, such as inventory management or order fulfillment software, to automate various tasks and processes on Amazon. These tools can help the business streamline its Amazon operations and improve efficiency and accuracy.

Overall, Amazon Automation uses technology and processes to automate various tasks and procedures within the Amazon ecosystem, which can help businesses operating on Amazon save time and resources, improve efficiency and accuracy, and scale their operations more efficiently.

What is Amazon automation software?

Amazon automation software is designed to automate various tasks and processes within the Amazon ecosystem. This can include managing inventory, tracking and fulfilling orders, managing customer interactions, and optimizing advertising campaigns. Amazon automation software can help businesses operating on Amazon save time and resources and improve efficiency and accuracy.

Some common types of Amazon automation software include:

  1. Data Automation software: This software automates various tasks and processes related to API integration, data management, loading, and processing. This can include tasks such as collecting and organizing data from various sources, cleaning and transforming data and enabling teams to easily use tools like Tableau, Power BI, Looker, and others to generate reports and visualizations based on the data. For example, see Secret To Unlocking Amazon Vendor Central Reports.
  2. Inventory management software: This type of software helps businesses to automate various tasks related to managing their inventory on Amazon, such as tracking stock levels, forecasting demand, and replenishing stock as needed.
  3. Order fulfillment software: This type of software helps businesses to automate the process of fulfilling orders on Amazon, including tasks such as packing and shipping orders, tracking orders, and handling returns.
  4. Customer service software: This type of software helps businesses to automate various tasks related to managing customer interactions on Amazon, such as responding to customer inquiries, handling customer complaints, and tracking customer satisfaction.
  5. Advertising automation software: This type of software helps businesses to automate various tasks and processes related to advertising on Amazon, such as creating and managing sponsored product campaigns, targeting specific customers, and optimizing ad spending.

What Amazon automation tools are available?

Various Amazon Automation tools are available, including Amazon’s services and third-party software and services that integrate with Amazon’s API. Some standard Amazon Automation tools include:

  1. Amazon FBA (Fulfillment by Amazon): This service allows businesses to store their products in Amazon’s fulfillment centers, where they are picked, packed, and shipped by Amazon when an order is placed. This can help businesses to save time and resources on order fulfillment.
  2. Amazon SP-API (formerly MWS : Marketplace Web Service): This is a collection of APIs that allows businesses to automate various tasks and processes on Amazon, such as listing products, managing orders and inventory, and processing payments.
  3. Amazon LTL (Less than Truckload): This service allows businesses to ship large or bulky items to Amazon fulfillment centers using less-than-truckload carriers. This can reduce shipping costs and improve delivery times.
  4. Third-party tools: There are also many third-party tools available that integrate with Amazon’s API, such as inventory management software, order fulfillment software, and customer relationship management (CRM) software. These tools can help businesses automate various Amazon tasks and processes, such as listing products, managing orders, and inventory, and interacting with customers.

Many Amazon Automation tools are available to businesses operating on Amazon, which can help automate various tasks and processes and improve efficiency and accuracy.

What are Amazon Seller automated reports?

Amazon seller automated reports are reports generated automatically by Amazon regularly, typically daily or weekly, for sellers on the platform. These reports provide sellers with valuable information about their sales, orders, and performance on Amazon and can be used to track and analyze various metrics and trends.

Some common types of Amazon seller automated reports include:

  1. Sales reports: These reports provide information about the seller’s sales and revenue, including the number of units sold, the total value of the sales, and the fees and charges associated with the sales.
  2. Inventory reports: These reports provide information about the seller’s inventory, including the number of units available for sale, the number of units in transit, and the number of units in storage.
  3. Order reports: These reports provide information about the seller’s orders, including the number of orders received, the status of the orders, and the fulfillment method used for the orders.
  4. Performance reports: These reports provide information about the seller’s performance on Amazon, including metrics such as the seller’s feedback rating, the number of returns, and the seller’s order defect rate.

Amazon seller automated reports are a valuable tool for sellers on the platform, as they provide a wealth of information about the seller’s sales, orders, and performance on Amazon and can be used to track and analyze various metrics and trends.

Also, if you are a vendor, see Code-free Amazon Vendor Central Software.

Can I automate inventory report downloads from Amazon SellerCentral?

Automating the download of inventory reports from Amazon Seller Central is possible.

To automate the download of inventory reports from Amazon Seller Central, you will need to use Amazon’s Selling Partner API. Selling Partner is a collection of APIs that allows sellers to automate various tasks and processes on Amazon, including downloading inventory reports.

By integrating SP-API into your systems and making API calls to the Selling Partner Inventory API, you can automate the download of these reports and streamline your inventory management on Amazon.

See How To Export Inventory From Amazon for more information on report automation.

What types of Amazon automation services exist?

The best Amazon automation service for your business will depend on your specific needs and goals. Some common types of Amazon automation services include:

  1. Data services: These services integrate with Amazon Selling Partner and Amazon Advertising APIs to automate data flow for operations, reporting, and visualizations.
  2. Repricing services: These services automatically adjust the prices of your products on Amazon based on a set of rules that you define to help ensure that your prices are competitive and maximize your profits.
  3. Inventory management services: These services help you to automate various tasks related to managing your inventory on Amazon, such as tracking stock levels, forecasting demand, and replenishing stock as needed.
  4. Order fulfillment services: These services help you to automate the process of fulfilling orders on Amazon, including tasks such as packing and shipping orders, tracking orders, and handling returns.
  5. Customer service services: These services help you to automate various tasks related to managing customer interactions on Amazon, such as responding to customer inquiries, handling customer complaints, and tracking customer satisfaction.

It is essential to carefully evaluate your specific needs and goals and choose a service that meets them. Consider factors such as the service provider’s reputation, price, and any additional features or support that the service offers.

See Amazon Seller Central Sales Report Automation for more information on Selling Partner API automation services.

What is Amazon Advertising automation?

Amazon Advertising Automation refers to the use of technology and processes to automate various tasks and processes related to advertising on Amazon. This can include automating the creation and management of sponsored product campaigns, targeting specific customers, and optimizing ad spending. Automation can help businesses operating on Amazon save time and resources and improve their advertising efforts’ efficiency and effectiveness.

For example, automation provides the keys to understanding Amazon Advertising Report data for BI, reporting, and data analysis. See Amazon Advertising Reports: Performance Data.

Some standard tools for Amazon Advertising Automation include Amazon’s advertising platforms, such as Amazon Advertising and Amazon DSP (Demand-Side Platform), and third-party software and services that integrate with Amazon’s API.

These tools can help businesses to automate various tasks and processes related to advertising on Amazon, such as creating and managing sponsored product campaigns, targeting specific customers, and optimizing ad spending.

Amazon Advertising Automation is an essential tool for businesses operating on Amazon, as it can help improve their advertising efforts’ efficiency and effectiveness and drive more sales on the platform.

For more information on unlocking Amazon Seller & Vendor Central advertising automation for efficiency, scale, and growth, see Amazon Advertising API Automation or How To Unlock Amazon DSP Insights, Reporting, & Optimization.

How to automate pricing on Amazon?

There are several ways to automate Amazon pricing, depending on your business’s specific needs and goals. Some common strategies for automating pricing on Amazon include:

  1. Using repricing software: Repricing software is a tool that automatically adjusts the prices of your products on Amazon based on a set of rules you define. This can ensure that your prices are competitive and maximize your profits.
  2. Integrating with a pricing API: Some third-party software and services offer APIs (Application Programming Interfaces) that allow you to automate the pricing of your products on Amazon. You can integrate these APIs into your systems and use them to automate the pricing of your products based on various factors, such as the prices of your competitors or market trends.
  3. Using Amazon’s pricing tools: Amazon offers a variety of tools and resources to help sellers manage the pricing of their products on the platform. For example, you can use Amazon’s Retail Pricing API to automate the pricing of your products based on a set of rules you define.

Depending on your specific needs and goals, there are several ways to automate pricing on Amazon. By using repricing software, integrating with a pricing API, or using Amazon’s pricing tools, you can automate the pricing of your products on Amazon and streamline your operations on the platform.

What does an Amazon automation engineer do?

An Amazon automation engineer may be an employee or contractor responsible for designing and implementing automation solutions for various tasks and processes within the Amazon ecosystem. This may include managing inventory, tracking and fulfilling orders, managing customer interactions, and optimizing advertising campaigns.

Some specific responsibilities of an Amazon automation engineer may include the following:

  1. Analyzing business processes and identifying opportunities for automation
  2. Designing and implementing automation solutions using tools such as Amazon’s SPI-API and third-party software and services
  3. Testing and debugging automation solutions to ensure that they are working correctly
  4. Monitoring and maintaining automation solutions to ensure that they are functioning properly
  5. Collaborating with other teams, such as product development, operations, and customer service, to identify and implement automation solutions

The typical Amazon automation engineer is responsible for designing and implementing automation solutions for various tasks and processes within the Amazon ecosystem to improve efficiency and accuracy and support the growth and scalability of the business.

Is Amazon automation a good investment?

Amazon automation can be a good investment for businesses operating on Amazon, as it can help to improve efficiency and accuracy, save time and resources, and support the growth and scalability of the company.

However, it is crucial to carefully evaluate your business’s specific needs and goals and the potential costs and benefits of implementing Amazon automation before deciding. Some factors to consider when deciding whether Amazon automation is a good investment include the following:

  1. The cost of the automation tools and services: Amazon automation tools and services can vary, so it is essential to carefully consider your budget and the potential return on investment (ROI) of the automation tools and services you are considering.
  2. The specific needs and goals of your business: Different businesses may have different needs and goals when it comes to Amazon automation, so it is essential to carefully evaluate your specific needs and goals and choose automation tools and services that are a good fit for your business.
  3. The potential benefits of automation: It is essential to carefully consider the potential benefits of Amazon automation for your business, such as improved efficiency and accuracy, time and resource savings, and support for business growth and scalability.

For example, if you have an employee manually download an Amazon order report, there are costs related to inefficient, manual work. Your employee will typically need to follow these manual steps:

  1. Log in to your Amazon Seller Central account
  2. Navigate to the “Reports” section of the dashboard
  3. Select the type of order report you want to download
  4. Select the date range for the report
  5. Click the “Request report” button
  6. Wait for the report to be generated and made available for download

Depending on the size and complexity of the report, it can take anywhere from a few minutes to several hours for the report to be generated and made available for download. Once the report is available, it should take just a few seconds to download to their computer or device.

This may be a full-time job if your employee does so for several reports across marketplaces and FBA seller accounts. Is manual data wrangling a good investment? Automated report processing can free this person to work on tasks other than messy, manual data wrangling.

Amazon automation can be a good investment for businesses operating on Amazon. Still, it is crucial to carefully evaluate your business’s specific needs and goals and the potential costs and benefits of implementing automation before making a decision.

Who are the leading Amazon automation companies?

Many companies offer Amazon automation services and tools, and the leading companies in this space may vary depending on a variety of factors, such as the specific needs and goals of your business, the type of automation services or tools you are looking for, and your budget.

Some examples of leading Amazon automation companies to include:

  1. Openbridge: This company offers code-free, fully-automated data integration services for Sellers and Vendors to the Amazon Selling Partner API and Amazon Advertising API.
  2. FeedbackFive: This company offers a range of tools for automating various tasks and processes on Amazon, including managing customer feedback, managing product reviews, and driving seller ratings.
  3. SellerLabs: This company offers a range of tools and services for automating various tasks and processes on Amazon, including keyword research, product listing optimization, and repricing.
  4. SellerExpress: This company offers a range of tools and services for automating various tasks and processes on Amazon, including inventory management, order fulfillment, and customer service.
  5. ZonGuru: This company offers a range of tools and services for automating various tasks and processes on Amazon, including product research, product listing optimization, and repricing.

Many companies offer Amazon automation services and tools, and the leading companies in this space may vary depending on your specific needs and goals. It is vital to carefully research and compare different options to find the best fit for your business.

Who is the leading Amazon automation agency?

Many agencies offer Amazon automation services and tools, and the leading agencies in this space may vary depending on a variety of factors, such as the specific needs and goals of your business, the type of automation services or tools you are looking for, and your budget.

Some examples of leading Amazon automation agencies to include:

  1. AMZ Advisers: This agency offers a range of services for automating various tasks and processes on Amazon, including product research, product listing optimization, and repricing.
  2. AMZ One Step: This agency offers a range of services for automating various tasks and processes on Amazon, including product research, product listing optimization, and customer service.
  3. AMZ Blitz: This agency offers various services for automating various tasks and processes on Amazon, including product research, product listing optimization, and inventory management.
  4. AMZ Data Studio: This agency offers various services for automating various tasks and processes on Amazon, including product research, product listing optimization, and order fulfillment.

Many agencies offer Amazon automation services and tools, and the leading agencies in this space may vary depending on your specific needs and goals. It is vital to carefully research and compare different options to find the best fit for your business.

Is Amazon automation illegal?

Amazon automation is not necessarily illegal as long as it is used in compliance with Amazon’s policies and terms of service. Amazon allows automation tools and processes to streamline various tasks and operations on the platform as long as they do not violate company policies or terms of service.

For example, Amazon’s policies prohibit using automation to manipulate customer reviews or ratings or to engage in deceptive or fraudulent behavior. Amazon also prohibits using automation to bypass or circumvent any company’s systems or processes.

Some software tools and services use bots, screen scrapers, and other methods to automate processes. However, these violate Amazon's terms and policies. Openbridge offers a Bot Free Promise for its Amazon automation tools to ensure compliance with Amazon Acceptable User and Data Protection policies.

As long as you use Amazon automation tools and processes in compliance with Amazon’s policies and terms of service, it is not illegal. However, it is essential to carefully review and understand these policies and terms to ensure that you are using automation in a way that complies with Amazon’s rules.

Get started with Amazon Automation — 30-day Free Trial

Openbride is a leading amazon automation tool, providing direct, official access to Amazon Seller Central, Amazon Vendor Central, and Amazon Advertising APIs. We deliver the data that can supercharge Amazon store automation. FBA sellers get code-free, automated access to Amazon fulfillment center status, inventory levels, buy box, orders, finances, and other performance data.

Automation accelerates performance and the speed at which your team can gain valuable insights to deliver data-driven growth and profit.

Sign up for a 30-day free trial of our Amazon automation software.

Amazon Automation FAQs

  1. What is Amazon automation? Amazon automation refers to using technology and processes to automate various tasks and operations within the Amazon ecosystem, such as managing inventory, tracking and fulfilling orders, managing customer interactions, and optimizing advertising campaigns.
  2. Why is Amazon automation critical? Amazon automation can be important for businesses operating on Amazon because it can help to improve efficiency and accuracy, save time and resources, and support the growth and scalability of the company.
  3. What types of tasks can be automated on Amazon? Many tasks and processes can be automated on Amazon, including managing inventory, tracking and fulfilling orders, managing customer interactions, and optimizing advertising campaigns.
  4. What tools and services are available for Amazon automation? There is a wide range of tools and services available for Amazon automation, including Amazon’s platforms, such as Amazon Advertising and Amazon DSP, as well as third-party software and services that integrate with Amazon’s API.
  5. How do I get started with Amazon automation? To start with Amazon automation, you will need to evaluate your business’s specific needs and goals and research the various tools and services available for Amazon automation. You may also need to obtain access to Amazon’s MWS (Marketplace Web Service) API or other relevant APIs and integrate them into your systems.
  6. Can I automate all of my tasks and processes on Amazon? It is not necessarily possible or practical to automate your tasks and processes on Amazon, as some tasks may require human worker intervention or may not be suitable for automation. It is essential to carefully evaluate your business’s specific needs and goals and determine which tasks and processes are ideal for automation.
  7. Is Amazon automation legal? Amazon automation is generally permitted as long as it is used in compliance with Amazon’s policies and terms of service. However, Amazon prohibits using automation to manipulate customer reviews or ratings or to engage in deceptive or fraudulent behavior.
  8. Is Amazon automation expensive? The cost of Amazon automation tools and services can vary and may depend on factors such as the specific needs and goals of an Amazon business, the complexity of the automation solutions you are implementing, and the reputation and pricing of the service provider. It is essential to evaluate the potential amazon store automation offers carefully.
  9. What does Amazon say about the topic of automation? See the blog post How ecommerce automation works in the Amazon store.

Discover the Power of Amazon Automation was originally published in Openbridge on Medium, where people are continuing the conversation by highlighting and responding to this story.


from Openbridge - Medium https://ift.tt/PhNRYlf
via IFTTT
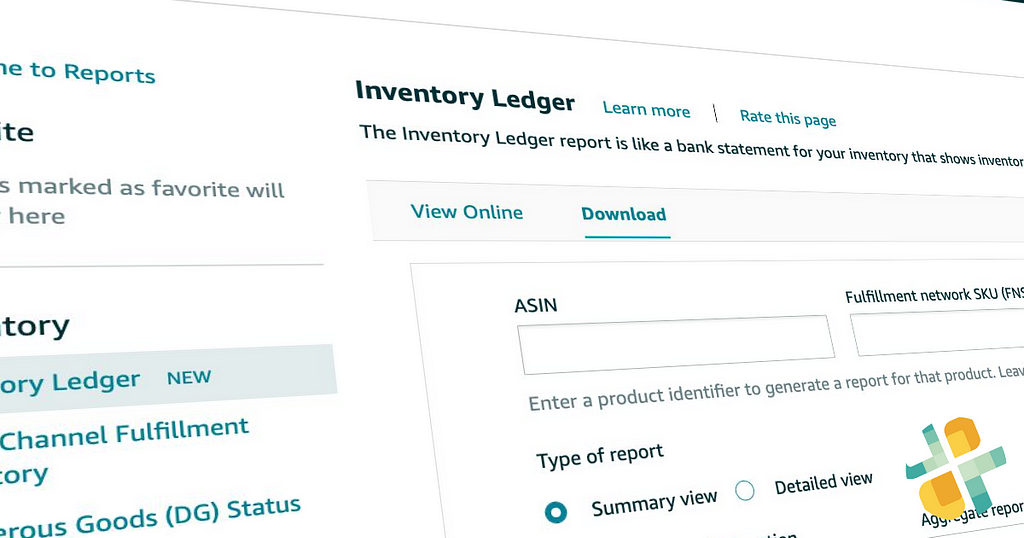
Amazon Inventory Ledger Report

The Inventory Ledger report provides an Amazon FBA Seller with a consolidated view of an Amazon Seller inventory.

The Inventory Ledger report is like a bank statement for an Amazon Seller inventory. It provides end-to-end inventory reconciliation capability by showing your starting inventory balance, received Inventory, customer orders, customer returns, adjustments, removals, and ending balance for an Amazon account.

The Inventory Ledger report supports inventory management and accounting analysis. Also, since it includes Inventory received in the fulfillment center, adjustments, and reconciliation events, you can see inventory movement within Amazon fulfillment centers.

Amazon Sellers should use this report to analyze inventory movements to and from fulfillment centers, including sold, returned, removed, disposed of, damaged, lost, and found products. As a result, it is common for an Amazon Seller to use this data in their accounting software.

Amazon delivers this report’s historical movement data of Seller inventory for 18 months.

Per Amazon, the Inventory Ledger report replaces six reports:

  1. Daily Inventory History
  2. Monthly Inventory History
  3. Inventory Event Detail
  4. Inventory Adjustments
  5. Inventory Reconciliation
  6. Received Inventory

As of January 31, 2023, these six reports are no longer available.

What Is Included In The Amazon Inventory Ledger Report?

You can view inventory events in the Inventory Ledger report using the Summary and Detailed views.

Ledger Report: Summary View

The summary view of the Inventory Ledger report shows a history of inventory events (such as receipts, shipments, and adjustments) by SKU and disposition (such as sellable, customer damaged, carrier damaged, fulfillment center damaged, expired, distributor damaged, and defective).

The freshness of the data depends on the period by which the report is aggregated. For daily aggregation, the data is refreshed each day. For weekly, the data is refreshed every Monday. The data is refreshed monthly on the second day of the month.

Ledger Report: Detailed View

The detailed View of the Inventory Ledger report details all inventory events in fulfillment centers, including event type, quantity, location, country, and disposition. Data in the detailed View is updated in near real-time.

If you notice any discrepancies, try expanding the dates of your report. An inventory event could have occurred in the previous month, which would affect your data in the report window. Extending the dates of your report can give you a better understanding of your inventory movements. The best way to reconcile Inventory is to use the FNSKU field to specify the product in each report.

You can also view your reimbursements in the online report by clicking See reimbursements for the reported dates. Reimbursements for lost or damaged units may take up to 45 days to post to your account. To learn more about reimbursements, go to the FBA inventory reimbursement policy.

Understanding Ledger Report Adjustment Types And Reason Codes

Adjustment-type rows in the Inventory Ledger report’s detailed View show the history of adjustments to your Inventory in response to issues such as disposition changes, misplaced Inventory, found Inventory, and ownership corrections. Inventory adjustments are categorized by type and reason code.

  • The type shows whether an adjustment increases or decreases your inventory level.
  • The reason code describes the adjustment that was made.

Inventory adjustments often occur in pairs. For example, suppose your Inventory changes disposition from sellable to expired. In that case, there will be two adjustments to your Inventory: a decrease in your sellable Inventory and an increase in your expired Inventory.

The following table lists all inventory adjustment reason codes and their type.

Inventory dispositions

Inventory disposition represents the physical state of a unit or units for an Amazon Seller account.

Reconciliation events

Inventory adjustments for misplaced Inventory found and Damaged at the Amazon fulfillment center will have corresponding reconciliations. You can view these reconciliations in both online and downloadable views.

The following table lists all possible original event and reconciliation event combinations.

Inventory adjustments other than Inventory misplaced, Inventory found, and Damaged at the Amazon fulfillment center will not show a reconciliation reason in the online or downloadable View.

Why are my items being researched?

You will notice a new inventory classification on the Manage FBA inventory page and report called Researching. This represents the misplaced or fulfillment-center-damaged Inventory that is actively being confirmed at our fulfillment centers.

A timeline shows the duration of the research, which will always be at most 30 days. Once the Inventory being researched has been reimbursed or exceeded the 30-day period, an Amazon Seller will see the corresponding adjustment to the Inventory Ledger report’s detailed View. For inventory adjustments after March 19, 2021, an Amazon FBA Seller does not have to wait 30 days to file a claim because Amazon will handle the 30-day research duration for them.

How Access Your Ledger Reports: Manual Wrangling or Full Automation?

Amazon offers the Selling Partner API to Vendors and Sellers for direct, official access to reports. Amazon also allows online viewing and manual downloads by logging into your Seller Central account.

Amazon Automation: Ledger Summary and Detail Reports

Automation ensures your team can skip the manual data wrangling and take control of your Inventory Ledger data.

Store reports in a private data lake or cloud warehouses such as Amazon Redshift, Amazon Redshift Spectrum, Google BigQuery, Snowflake, Azure Data Lake, and Amazon Athena.

Your team can then leverage best-in-class analytics and business tools like Google Data Studio, Tableau, Microsoft Power BI, Looker, or Amazon Quicksight.

Are you interested in automation? Openbridge offers code-free, fully-automated access to your Amazon Seller Central reporting data.

Manual Reporting: Online Or Request Report For Download

You can view adjustments to your Inventory online in Seller Central or by downloading the Inventory Ledger report’s detailed View.

  • The View online method is recommended for quickly viewing inventory adjustments and reconciliations. When there is a reconciliation for an inventory adjustment, a link will connect you to either the reconciliation adjustment in the Inventory Ledger report’s detailed View or the reimbursement transaction in the Reimbursement report.
  • The Download method is recommended for understanding the reconciliation status of inventory adjustments at scale.

To manually view your inventory or download adjustments online, follow these steps:

  1. In the Inventory Ledger report, click View online.
  2. Select Summary or Detailed View, and select the desired date range in the Date Range drop-down menu.
  3. If you want to filter the results further, add the Merchant SKU, Fulfillment Network SKU, ASIN, or any combination of those identifiers.
  4. Click Generate report.

The report will generate multiple pages if there are more than 50 inventory adjustments.

You can get more information in the online View about the reconciled quantities with reason codes for Damaged at the Amazon fulfillment center, Inventory misplaced, or Inventory found. For unreconciled quantities with reason codes for Damaged at the Amazon fulfillment center and Inventory misplaced, you may be eligible for reimbursement under the FBA inventory reimbursement policy.

Get Started Automating Inventory Ledger Reports — For Free

Ditch the legacy manual report downloads for code-free Amazon SP-API automation. Openbridge offers official SP-API data automation, one of the most powerful tools Amazon Sellers can tap into. Accelerate the speed at which your team can gain valuable insights to deliver data-driven growth and profit.

Sign up for a 30-day free trial of our Amazon Seller Inventory Ledger Report automation


Amazon Inventory Ledger Report was originally published in Openbridge on Medium, where people are continuing the conversation by highlighting and responding to this story.


from Openbridge - Medium https://ift.tt/2EZlvLb
via IFTTT

What Is Reserved Inventory On Amazon?

Harness the power of automated Amazon FBA Reserved Inventory performance insights reporting

Per Amazon, inventory in the reserved status will be tied to a customer order shipped between fulfillment centers or set aside at a fulfillment center for additional processing. While inventory is being sent to another fulfillment center, it is still available for purchase.

Why is my Amazon Inventory Reserved?

Units can be reserved for the following reasons:

  • Customer order: These units are used to fulfill customer orders.
  • Fulfillment center transfer: These units are being transferred from one fulfillment center to another to help place the inventory closer to customers. Units in the FC transfer status are available for customers to buy. However, customers might be shown a future ship date if no other units are available in the fulfillment centers for immediate fulfillment. Transfers may take up to 22 to 25 days to complete. In some cases, transfers may take longer, and investigation may be required (for example, delays due to COVID-19 or weather restrictions).
  • Fulfillment center processing: These units have been sidelined at the fulfillment center for additional processing, such as verification of item dimensions and weight, pending investigations, or pending removal orders.

What does Amazon “FC” mean?

The acronym Fulfillment Center (FC) is employed to signify a specific condition of your existing inventory or those items located in the “processing” status at an Amazon warehouse. This depicts the elements housed in one of Amazon’s distribution hubs globally. Once your FBA supply reaches the FC processing stage at an Amazon center, it is categorized and shipped to other warehouses so that Amazon can dispatch orders quickly and proficiently while lessening costs.

When inventory is being processed for transfer to another Amazon fulfillment center, those units might show up under FC transfer and FC processing for a short time. Units in FC transfer are available for sale but can only be eligible for Prime delivery once they are transferred to destination fulfillment centers.

What is Amazon Inventory Reserved in relation to overall inventory levels?

The total number of units you have for an SKU in a shipment sent to a fulfillment center equals:

 Available quantity + Unsellable quantity + Reserved quantity* + Inbound quantity.

*Reserved quantity is not included in Available or Unsellable quantities.

Is there an Amazon Reserved Inventory Report for an FBA seller to review?

The reserved inventory report is part of a broader inventory performance and management datasets collection. Specifically, the Amazon Reserved Inventory report shows a breakdown of reserved units in your inventory. Here is a snapshot of the data you can get in an Amazon Reserved Inventory Report;

  • sku: SKUs are unique blocks of letters or numbers that identify your products. SKUs are assigned by you as the seller.
  • fnsku: A unique identifier assigned by Amazon to items stored in and fulfilled from a fulfillment center.
  • asin: ASINs are unique blocks of 10 letters or numbers that identify items. Amazon assigns ASINs. You can find the ASIN on the product detail page.
  • product-name: The title of your product.
  • reserved_qty: The total number of units in the reserved status.
  • reserved_customerorders: The number of units reserved for customer orders.
  • reserved_fc-transfers: The number of units transferred from one fulfillment center to another.
  • reserved_fc-processing: The number of units that have been sidelined at the fulfillment center for additional processing, which includes units tied to a removal order.

The report can also help you find more information about the reserved units. Amazon reserved inventory levels are available for sellers globally.

Is the Amazon Seller Central Reserved Inventory data available for export?

The Amazon FBA reserved inventory report can be downloaded manually as a CSV report. However, rather than messy and time-consuming manual data wrangling, you can automate the flow of reserved amazon inventory information to a leading data lake or cloud warehouses like Databricks, Redshift, Google BigQuery, Snowflake, Azure Data Lake, Ahana, and Amazon Athena.

Automation provides a unified, analytics-ready single source of truth for BI tools. For example, you can use your tools for e-commerce insights like business intelligence, data visualization, SQL, or data science tools. Examples are Google Data Studio, Tableau, Microsoft Power BI, Looker, and Amazon Quicksight.

What type of data is available to help with Amazon inventory management?

Amazon FBA inventory reports cover a broad cross-section of data points. There are reports for Amazon fulfilled, stranded inventory, active listing, all listings, and many others. For example, here are a collection of FBA-specific reports;

  • Inventory Ledger NEW
  • Multi-Channel Fulfillment Inventory
  • Dangerous Goods (DG) Status
  • Restock Inventory
  • Stranded Inventory
  • Reserved Inventory
  • Subscribe & Save Forecasting
  • Inventory Reconciliation
  • Small and Light Inventory
  • Amazon Fulfilled Inventory
  • Multi-Country Inventory
  • Daily Inventory History
  • Monthly Inventory History
  • Received Inventory
  • Inventory Event Detail
  • Inventory Adjustments
  • Manage FBA Inventory
  • Manage FBA Inventory Report — Archived
  • Inbound Performance
  • Exportable Inventory (US)
  • Bulk Fix Stranded Inventory
  • FBA Inventory

These Seller reports will contain data about Amazon sales, stock level, restock limits, storage fees, storage type, storage limits, and many others for inventory planning or analysis.

If you are looking for broader report automation for sales, fulfillment, finance, and other data FBA feeds, see Amazon Seller Central Sales Report Automation.

Get Started Automating Amazon Seller Central Reserved Inventory Reports — For Free.

Ditch the manual Amazon Reserved Inventory report downloads. Openbridge is a verified partner Amazon Selling Partner API developer and offers code-free data automation, one of the most potent tools FBA sellers can tap. Automation accelerates performance and the speed at which your team can gain valuable insights to deliver data-driven growth and profit.

Sign up for a 30-day free trial today


What Is Reserved Inventory On Amazon? was originally published in Openbridge on Medium, where people are continuing the conversation by highlighting and responding to this story.


from Openbridge - Medium https://ift.tt/eycVqQ2
via IFTTT

Amazon Vendor Central Frequently Asked Questions

Vendor Central

How to use Amazon Vendor Central, optimize sales performance, and become a data-driven retailer.

Optimizing your e-commerce sales can be challenging for a brand or business owner. From establishing an Amazon store to leveraging Amazon Advertising products like Sponsored products or Sponsored brands, reaching Amazon customers is critical to success.

This Amazon Vendor Central FAQ covers various performance reports in your Vendor Central account, business metrics, definitions, and areas of opportunity as you optimize sales and operational performance.

What is Amazon Retail Analytics?

Amazon Retail Analytics (ARA) provides reports that let an Amazon Vendor analyze sales and operational data, such as revenue and inventory levels.

All vendors have access to ARA, including manufacturers and authorized resellers.

Amazon Brand Analytics (ABA) is a set of reports that lets you analyze your customers’ buying and search behavior. To access ABA, you must be enrolled in Brand Registry and be responsible for selling the brand in the Amazon store. Brand Registry enrollment is not required for ARA.

You can access ARA and ABA through the Reports menu in your account or the Selling Partner API (see Unlocking Amazon Vendor Central Data With New API) for automation and data unification.

What are Vendor Retail Analytics Reports?

Vendors have access to performance data they need to manage and grow their business with Amazon Retail. Through vendor-specific dashboards, reports, or API, you can monitor your retail KPIs, evaluate your performance, identify operational improvement opportunities, and glean valuable insights to shape your business strategy.

What types of ARA Reports are available?

A collection of specific report types available; Sales, Traffic, Net Pure Product Margin (PPM), Inventory, Catalog, and Forecasting. The Traffic, Net Pure Product Margin (PPM), and Forecasting dashboards are only displayed to manufacturers.

As mentioned earlier, Reports are available via the Vendor Central interface, downloads, or API. See Secret To Unlocking Amazon Vendor Central Reports

Do I have to download Reports manually? Is Vendor Reporting Automation supported?

Automation will automatically generate reports, process, route, and load to your private data destination so you can manage and optimize your sales and inventory. This is accomplished via the Selling Partner API for Vendors.

What are the benefits of Vendor Report Automation?

You can unify your Vendor data to a leading data lake or cloud warehouses like Databricks, Redshift, Redshift Spectrum, Google BigQuery, Snowflake, Azure Data Lake, Ahana, and Amazon Athena for a unified, analytics-ready single source of truth to fuel informed decisions for Vendor insights.

Automated, unified data unlocks the ability to use tools like Google Data Studio, Tableau, Microsoft Power BI, Looker, and Amazon Quicksight.

See Code-free Amazon Vendor Central Software for more information on automation opportunities.

Can I select prior reporting periods in the Amazon reporting interface?

Select Trailing in the Time frame drop-down menu to see trailing period options. Trailing period options include four weeks, 13 weeks, and 12 months. To see the prior period, select Show additional filters.

Regular period options include year-to-date, quarter-to-date, month-to-date, and week-to-date. Select Recurring in the Time frame drop-down menu to see recurring period options. To see year over year, select Show additional filters.

What is the cadence of reporting data availability?

Reports may take up to a week to populate data after a reporting period closes. Amazon targets to update all weekly reports within 72 hours and continuously improves its system to get Vendor reports out faster.

Does ARA support the Lost buy box (LBB)?

The Amazon pricing team no longer supports LBB and can’t provide an LBB metric in ARA until an effective replacement metric is available. An alternative metric, the Lost featured offer (LFO), is in development, but we need to guide when that metric is available.

Are Conversion and average sale prices derived metrics?

Yes, conversion and average sale prices (ASP) are derived metrics, meaning they can be calculated using other metrics already provided in the sales dashboard. Conversion means the number of ordered units divided by glance views. ASP means the amount of shipped revenue divided by shipped units.

Difference between the Manufacturing view and the Sourcing view

All vendors have access to Sourcing views, which will show the sales data for ASINs sourced from a vendor code in the vendor group. If you are a manufacturer, you will also have access to the Manufacturing view, which shows data for any ASIN manufactured by the Vendor, regardless of who sourced the product to Amazon.

There needs to be ASINs in the ARA dashboard. Why?

Here are a few possible reasons:

  • Distributor view: Make sure you’ve selected the correct distributor view. The Manufacturing view shows data for ASIN numbers you’ve made regardless of where they came from. The Sourcing View displays data of ASINs directly imported into your inventory system from suppliers’ codes in your Suppliers’ Groups.
  • No data in the period: A product must have data on one of the metrics in a dashboard to display in that particular DashBoard. For example, a product with stock will show in the Stock DashBoard but not in the Sales Dashboard if there were no sales for that product during the time frame specified.
  • ASIN mapping: Vendors can create an ASIN catalog to map to ARA. When they do so, they must also configure the ASINs to match the ARA report structure. They must wait until the dashboard reflects the changes before seeing them.

Why are there Unowned ASINs in the dashboard?

An ASIN mapping is a likely root cause. If ASINs are correctly mapped to ARA via the correct vendor hierarchies, vendor groups, and attribute setups, they may appear correctly in ARA dashboards. If you’re having trouble with ASIN mappings, contact your retailers or submit an issue through our Support Center, and Amazon will be happy to assist you.

Data does not match the data from the vendor manager or account manager.

You can use Amazon Seller Central (ASIN) level data parity between Amazon Retail Analytics (ARA) and your retailers’ internal systems to report their sales performance. If you want to know if your retailer has reported you for any issues, contact them directly or open a Contact Us request.

Why are some users able to see a particular dashboard while others can’t?

Users who aren’t admins need Financial Reports permission turned on for them to view their inventory. Admins already have all permissions turned on by defau­lt. Only an Administrator can turn off another user’s permissions.

What is the Vendor Forecasting dashboard?

The Forecasting dashboard allows you to identify the future demands for your product so you can plan for production and inventory. It doesn’t promise precisely when your potential buyers may buy your product.

What is the meaning of the different P-levels?

The forecasting tool generates forecasts for an ASIN with different levels of certainty or critical ratios (CR) or probabilities. A higher CR or probability level indicates more significant amounts of inventory. For example, if you set a CR of.80 shows an 80 percent chance that the item will be available within 30 days.

Do Vendor purchase orders match with the units forecast?

The report forecasts unconstrained customer demands, which does not guarantee future purchases. If already on-hand or on-ordered units are available to meet customer demands, these would be considered when issuing buy requests.

What is the Vendor Inventory dashboard?

The Inventory Dashboard let you monitor the health of the products in your store by providing weekly reports. You can quickly identify any issues and take action accordingly.

What is the sellable on-hand unit calculation?

In the Inventory dashboard, sellable on-hand units refer to the product’s physical condition as recorded in our inventory before we account for any outbound units, such as customer shipments, transfers, or removals. The sellable inventory does not necessarily mean that it is available on the Amazon website, only that it is not considered defective.

Why am I unable to view inventory metrics at the daily granularity

Some inventory reports aren’t available daily, so the “Inventory Dashboard” report has been disabled.

Out-of-stock (OOS) metrics are not replenishable out of stock (Rep OOS).

ARA surfaces procurable consider both replenishable and non-replenishable products. However, Rep OOS only looks at replenishable ASINs. Since there are more replenishable ASINs than non-replenishable ones, Rep OOS has fewer opportunities to surface new non-replenishable ASIN

There are no ROOS or unfilled orders in the Sourcing view.

This is normal behavior because the data from ROOS (returns ordered online) and unfilled orders (orders not filled by the manufacturer) are only available for manufacturers. These are ASIN-level data, so they cannot be attributed to any particular manufacturer.

If the vendor is a supplier, they will have access to the Supplier Inventory Management (SIM) views, which show ASIN-based inventory levels for each item sold by the vendor code designated in the vendor’s SIM profile. These views are enabled by default. Retailers can disable them if needed.

What is the Net PPM dashboard?

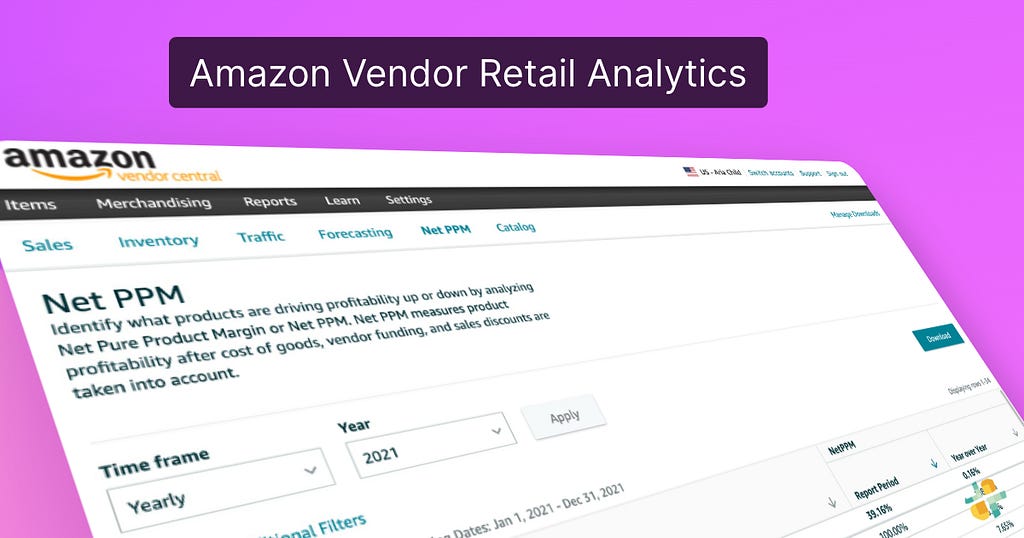
The Net PPM dashboard identifies which products drive profitability by analyzing net pure product margin (Net PPM). See Automating Amazon Vendor Central Net PPM Reporting

How is Net PPM calculated?

Net pure product margin (PPM) is calculated as shipped revenue minus shipped PCOGS + CCOGS (cost of goods) minus sales discounts, then divided by shipped revenue.

Why is the Net PPM dashboard not visible?

The Net PPM dashboard is commonly offered only to manufacturers.

Are warehouse deals excluded from the net PPM metric?

Your retailers’ internal systems may include “warehousing” deals. Because these deals aren’t included in Brand Analytics, they’re excluded from the metric. Since the vendor does not collect proceeds from Warehouse Deals sales, they do not account for these transactions.

What is the Vendor Sales dashboard?

The Sales Dashboards allow a Vendor to quickly identify opportunities by showing you how your team is doing against others and where they’re falling behind. The performance reports help companies improve their sales process and increase revenue. The data provides a single view of all data related to sales activities.

Do Vendors have access to Sales Dashboards?

Yes, Vendors can see their own offers’ sales reports, including the number of units sold, the total revenue generated by each offer, and the average price per unit.

Are warehouse deals are excluded from sales metrics?

Your retail partner’s internal warehouse deal reporting tool may include Warehouse Deals. However, ARAs do not report Warehouse Deals in their reported metrics.

Because the vendor does not collect revenue from warehouse deals sales, we don’t count them when calculating our gross profit margin.

If you need to know whether warehouse discounts are included in your internal metrics, contact your retailer or open a Contact Us case.

Will shoppers who return products and receive refunds are counted in shipped items and sales?

ARA accounts for customer returns and refunds in shipments and revenues. When a customer returns their product, the date they returned and canceled orders are attributed to them. Based on the original order dates, sales orders are adjusted for customer returns and cancellations.

What is the Vendor Traffic Dashboard?

The Traffic Dashboard allows you to see trends in traffic-related metrics. See How To Use Amazon’s Glance View As A Key Performance Metric.

Why can’t I see the traffic dashboard?

Suppose the vendor is an OEM (Original Equipment Manufacturer). In that case, they will have access to their ASIN-specific views, including ASIN-specific data, such as traffic and forecast, for any ASINs they manufacture. Contact retail partners to enable these views.

How does Amazon define a glance view?

GV measures customer traffic and is defined by the number of times someone has viewed the products’ details pages.

How can brands calculate “glance views” (or “looks”)?

When using Brand Analytics reports, GVs are calculated on the ASIN-featured-seller-retailer-product-detail-viewed-by-user-session basis. We expose raw GVs for each session so that retailers can see which sessions were converted by their products.

Because the brand analytics reports show impressions, but the brand analytics metrics don’t include any impression data.

Glance metrics can vary depending on the type of report being run. For example, advertising reports track impression and click data to determine whether an advertisement effectively drove shoppers to the shelf.

However, brand analytics reports measure conversion rates to see if a campaign successfully moved customers to a product detail screen. These two types of reports may differ significantly in calculating glance metrics.

Can you use glances to calculate conversions?

Conversion is the percentage of times a glance view was converted into a sale. It is a derived metric calculated by dividing ordered revenue by glance views.

What is the Vendor Catalog dashboard?

The Catalog Dashboards let you access the latest product details for your items.

How do you access the Catalog dashboard?

This Dashboards module is available to all vendors who have access to ARA regardless if they have additional permissions. Vendors can choose between two views: the manufacturing and sourcing views. Only manufacturers will see the manufacturing tab. Retailers will not see any tabs unless they are a retailer.

Some people don’t see the manufacturing view in the catalog dash­board, while others can’t.

All users will have full access to the Sourcing View if they have access to ARA.

Only administrators can view manufacturing reports for their accounts.

Admins will already be given all permissions by default. An administrator can only grant or remove permission to another user.

What is the Catalog dashboard update frequency?

The reports will automatically refresh every time an updated ASIN attribute becomes available. You cannot manually change the report’s refresh interval.

Do Vendors have access to Amazon Advertising performance reports and data?

Amazon Vendors have direct access to their digital marketing analytics data for each Amazon Marketplace they advertise. The data can be used for Amazon SEO efforts, campaign sales diagnostic, brand lift analytics, and other performance analysis. See Amazon Vendor Central Advertising.

What is Seller and Vendor Brand Analytics?

Brand Analytics reports in-depth cover sales, marketing, operations, customer behavior, and enhanced trends to enable you to make more informed business decisions, assess your market share, identify new opportunities, and monitor factors that affect sales. See Why Amazon Brand Analytics Fuels Growth

Data is generally available in Brand Analytics within 72 hours of the close of a given period.

The key features of Brand Analytics are:

  • Search: See how customers (in aggregate) find your products and other products on Amazon, including each product’s relative search popularity, click share, and conversion share.
  • Market basket analysis: Learn what other products are bought along with your products.
  • Repeat purchase behavior: This shows the number of orders received for each product or brand and the unique customers who placed the orders.

Brand Analytics is located under the Reports tab. This feature is only available if you own your brand and are responsible for selling the brand on Amazon. You must also be internal to the brand and not a third-party company supporting the brand.

If you don’t have access to Brand Analytics, you have not been identified as a vendor who meets the Amazon Brand Registry criteria. You must be a brand owner for an Amazon Vendor Central ( or Amazon Seller Central) account.

Should I use the Amazon Retail Analytics API or the legacy EDI?

APIs are the preferred integration solution compared to EDI and will offer more long-term functionality. APIs have lower infrastructure and development costs relative to EDI, are easier to use, do not require specialized knowledge, and enable efficient near-real-time processing.

Benefits of the SP-API vendor retail analytics report types include:

  • Source data for the API reports are from the same source used by Amazon retail category teams
  • Data parity across API reports and Amazon Retail Analytics dashboards in Vendor Central
  • Enabling integrators to specify and request data from different time range aggregations, such as daily, weekly, monthly, quarterly, yearly, and trailing four weeks
  • Easy-to-access data backfills for historical data

Openbridge is a cloud-based Amazon Vendor Central software tool designed specifically for Amazon Sellers and Vendors. It allows you to simultaneously automate API data feeds across multiple accounts, monitor sales performance across all channels, and automate inventory management and shipping processes.

Do you need a verified Amazon Vendor Central Partner? Looking for data automation?

Sign up for a 30-day free trial of our Vendor Central Software automation.


Amazon Vendor Central Frequently Asked Questions was originally published in Openbridge on Medium, where people are continuing the conversation by highlighting and responding to this story.


from Openbridge - Medium https://ift.tt/LxRgm7X
via IFTTT

Automating Amazon Vendor Central Net PPM Reporting

Amazon's Net Pure Profit Margin (Net PPM) is an essential key performance indicator (KPI) for Amazon Vendors.

What is Net PPM?

Net PPM reflects the product profitability after expenses like the cost of goods, vendor funding (co-op activities), and sales discounts. Per Amazon, the metric will;

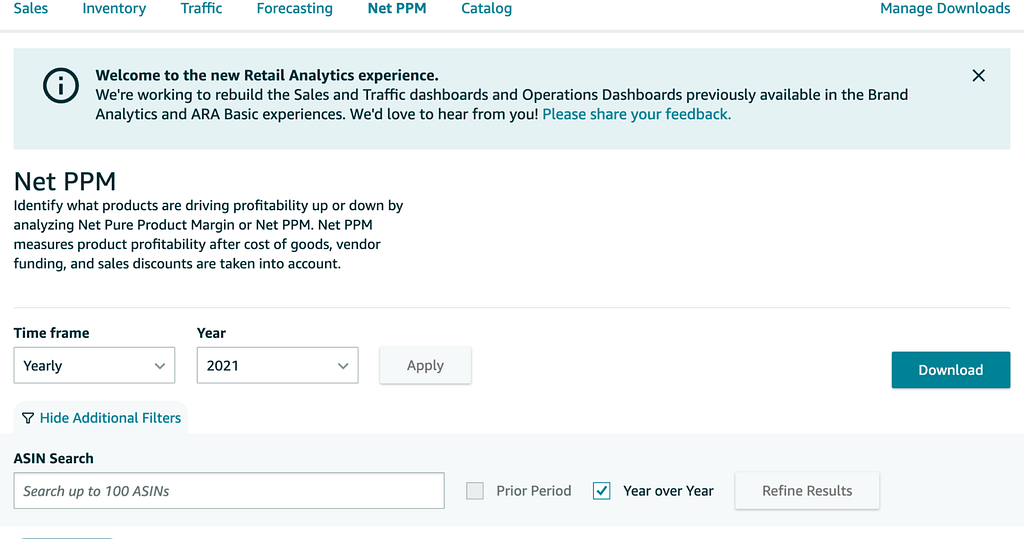
"identify what products are driving profitability up or down by analyzing Net Pure Product Margin or Net PPM. Net PPM measures product profitability after the cost of goods, vendor funding, and sales discounts are considered."

The good news? No need to worry about calculating your Vendor Net PPM; Amazon offers data to analyze this metric as part of a collection of Amazon Retail Analytics reports.

How about some more good news? The metric is part of a more extensive collection of ARA reports. The reports include data for glance views, margins, sales performance, and many others. The metrics in the ARA support deep dives into sales diagnostics, the financial health of your vendor account, trending product sales, and insight into products that can be optimized.

ARA reports are available for Vendors in North America, Europe, and APAC.

Why is Net PPM crucial for your business?

Amazon Net PPM provides insight into whether a product generates enough profit from its sales, providing clues that help ensure operating and overhead costs are contained.

While companies use Net PPM to assess operational profitability performance, the metric can also impact other aspects of an Amazon business. For example, poor performance can;

  • affect your ability to sell products through Amazon Advertising because you cannot continue supporting your marketing campaign with paid media.
  • impact future Amazon purchase orders due to "Amazon Can't Realize a Profit (CRaP)."
  • cause Amazon to concede the buy box to competitors.
  • trigger Amazon algorithms lower organic page rank.

Net PPM Formula Examples

Amazon automatically provides a Net PPM in reports. As a result, there is no need to invest the effort to calculate it yourself. However, it can be helpful to understand how it is calculated so you can make informed decisions to optimize your Vendor operations.

As we have stated previously, Net PPM measures the profitability (profit/cost) of an item sold through Amazon.com.

Amazon calculates ASIN level Net PPM based on the following formula:

Average Selling Price - Cost Price + Vendor Negotiated Contract Terms) / Average Selling Price 

Note that your Vendor terms, at the account level, will impact your performance, so ensure you negotiate favorable terms to maximize your opportunity for profit.

Below is a formula for an account-level Net PPM;

Shipped Revenue — PCOGS + Vendor Negotiated Contract Terms — Sales Discount

A sales discount is deducted from your margin when a customer receives a discount. A discount may be promo code redemptions, lightning deals, and similar. Amazon includes these sales discounts as part of the Net PPM in Vendor Central. Also, note that the Net PPM metric Amazon shares does not factor spending on Amazon Advertising, any chargebacks, or specific costs related to payment terms.

Where Can I Find Net PPM in Amazon Vendor Central?

Amazon offers two primary methods to access Net PPM data in Vendor Central. The first method is manual reporting downloads, and the second is Amazon API automation software.

  1. Manual Downloads: Log into your Vendor Central account and download the report.
  2. Automation: Ensures your team can skip the manual data wrangling and take control of your Inventory data and store it in a private data lake or cloud warehouses such as Snowflake, BigQuery, Amazon Athena, Redshift, and Azure Data Lake. Your team can then leverage best-in-class analytics and business tools like Tableau Looker, Power BI, and Google Data Studio to fuel Amazon analytics via custom reports, interactive graphs, and sales dashboards.

Manual Download Net PPM Reports

The first method we mentioned is a downloaded report file available on the account interface. Select "Reports" and "Retail Analytics. "There will be a report listed called "Net PPM" similar to the screen below:

What is the downside of manual report downloads? Someone logging in daily, downloading reports, and manually tracking 100s of report files needs to scale better. This approach can result in time-consuming and error-prone work, especially if you need consistent access.

Amazon Vendor Central Software Automation For Reports

Amazon Vendor Central software is an essential data automation tool. The Vendor Central API provides official, direct access to your data.

Suppose you are an individual Vendor, a large brand, an agency, or an FBA acquisition company. In that case, API automation provides various features, including the ability to perform code-free, fully automated Net PPM reporting data feeds to a data lake or cloud data warehouse.

Automation will automatically generate reports, process, route, and load to your private data destination so you can manage and optimize your sales and inventory. Automation also supports other Vendor Retail Analytic reports for which items are selling best, sales history, glance views, and other Amazon Vendor Central reports.

Vendors also have direct API access to Amazon Advertising (Sponsored Ads, DSP, Attribution) performance data.

Tools For Amazon Automation

No more manual data wrangling. With data unified and accessible, quickly optimize for poor conversion rates, identify gaps in operational performance, uncover the percentage of customers converting, or refine advertising efforts on and off Amazon.

Data automation unlocks the ability to use BI tools that can spot trends and adjust your business in response to changing market conditions.

Rather than a mess of file downloads, automation will unify your data to a leading data lake or cloud warehouses like Databricks, Redshift, Redshift Spectrum, Google BigQuery, Snowflake, Azure Data Lake, Ahana, and Amazon Athena for a unified, analytics-ready single source of truth to fuel informed decisions on product, media, and customer demand.

Unified data opens new opportunities for Vendor analytics. For example, for self-service reporting and insights, you can use your Google Data Studio, Tableau, Microsoft Power BI, Looker, Amazon Quicksight, or many others.

Get Started — For Free

Ditch manual report file downloads! Openbridge offers direct, code-free, and fully-automated access to Amazon Net PPM data. Our Amazon automation gets you the data you need to accelerate your Vendor Central business.

Sign up for a 30-day free trial of our fully-automated Net PPM data feed!

Frequency Asked Questions

Does Amazon’s Net Pure Profit Margin reflect the financial health of my Vendor business with Amazon?

Yes, it can. However, it should not be viewed in isolation from other product and account metrics.

Is there an API for Vendors?

Yes, the Amazon Selling Partner API and Amazon Advertising API provide direct, official access to Vendor sales performance, inventory, net pure profit margin, purchase order, and other report metrics. The API supports yearly, daily, and weekly reporting periods.

Amazon brand analytics, sales diagnostics, amazon search terms report, Glance Views, and other report automation is available, saving your team from manual file downloads.

Rather than manually dealing with a single report and export a comma-separated report each day, the API supports fast, code-free access via Openbridge Amazon Vendor Central software.

Does my brand need to enroll in Amazon Brand Registry?

Yes, your brand should be enrolled in the Amazon brand registry. Not only does this protect your brand, but your Vendor account will also be able to access Brand Analytics reporting.


Automating Amazon Vendor Central Net PPM Reporting was originally published in Openbridge on Medium, where people are continuing the conversation by highlighting and responding to this story.


from Openbridge - Medium https://ift.tt/M4VrQhq
via IFTTT

Looker Studio + Amazon Seller Central

How to use Looker Studio with code-free, ready-to-go data automation for Amazon Sellers

Google announced that it is rebranding its cloud BI product, Data Studio, into Looker Studio. This change will allow companies to quickly build custom dashboards and reports without having to learn a new tool. In addition, Google says that the look and feel of the dashboard will remain unchanged.

What is Looker Studio?

Looker Studio is a free web-based reporting tool that allows you to create data visualizations, dashboards, and reports. It’s easy to use and can be accessed from any device with an internet connection. You can insert charts, tables, maps, and more into your sales or marketing dashboard. Once you have created your report, you can share it with others or publish it on the web so that all of your team members can see the latest changes.

Looker Studio is the perfect option for people that want to graduate from using Excel or Google Sheets without the additional cost of other business intelligence tools.

Looker and Amazon, Better Together

We are excited to announce Looker Studio, like Google Data Studio, can leverage our Amazon Seller Central (SP-API) partner connectors. The SP-API, formerly known as Amazon MWS, delivers a new type of seller tool that gives business and marketing teams new analytics capabilities.

Looker Studio paired with Amazon Seller Central data is a powerful combination for sellers who want to create a simple dashboard or in-depth comprehensive reports and visualizations.

As a data source, Amazon Seller Central offers a default dashboard that allows you to manage your products, inventory, and orders. The Seller dashboard offers up key metrics on units ordered, total sales, and others.

What if you want to do a different type of analysis, report, or visualization? While the default Seller Central UI is sufficient, leveraging your own reporting tools, like Looker Studio, allows you to undertake an in-depth analysis of organic sales, wasteful ad spending, and search history.

You can connect to data directly from Amazon Seller Central via API and use this data directly within Looker Studio. With this connection, you can create more comprehensive reports for yourself quickly and easily.

What Is Possible With Looker Studio + Seller Central?

For data-driven Amazon merchants, the Amazon Selling Partner API (SP-API) connector will supply key business Insights so you can measure the impact of retail operations. The SP-API connector allows direct, code-free access to daily or real-time Seller Central data through Looker Studio.

Openbridge offers a type of connector for various Seller services;

  • Amazon Inventory: Get FBA Inventory Reports data for the listing, condition, disposition, and quantity to help with day-to-day inventory.
  • Amazon Fulfillment: Get comprehensive, product-level detail on inbound shipments, shipped FBA orders, quantity, tracking, and shipping with FBA Fulfillment Reports and Inbound Fulfillment API.
  • Amazon Orders: Order and item information for both FBA and seller-fulfilled orders including order status, fulfillment and sales channel information, and item details with Order API, and FBA Orders Reports.
  • Amazon Finance: Balances, payouts, estimated and actual selling, storage, and fulfillment fee data with FBA Settlement Reports, FBA Fees, and Finance API
  • Detail Sales & Traffic: Business-level Sales and Traffic reports offer performance metrics for product sales, revenue, units ordered, and page traffic metrics such as page views and buy box.
  • Vendor Central: Manage retail business operations with automated integration so vendors can improve and maintain performance at scale while growing business.
  • Retail Analytics: Vendor Retail Analytics delivers ordered revenue, glance views, conversion, replenishable out-of-stock, lost buy box, returns, replacements, and many more.
  • Brand Analytics: Brand Analytics offers sellers and vendors market basket analysis, search terms, repeat purchases, alternate purchases, item comparisons, and much more.

Amazon Advertising + Looker Studio

Looker Studio is a powerful tool for business users and marketers to fuse retail sales data with Amazon Advertising data from the Amazon Demand-side Platform (Amazon DSP) and Amazon Attribution services.

Connect Shopify to Looker Studio

Connecting Looker Studio and Shopify is available with pre-built, ready-to-go connectors. See the Shopify connector for more details.

Looker Studio + Google BigQuery

Looker Studio works best when paired with a native connector to Google BigQuery.

If you don’t already have a Google Cloud account for this tool (and if not, I highly recommend signing up), doing so only takes a couple of minutes. Plus, we can offer an additional $200 in free credits!

The Google Cloud Platform Free Trial + additional credits from our partners provide you with hundreds of dollars to try the Cloud Platform. Whether you are building software or automobiles, looking to create the next big thing, or wanting to put your company on the same infrastructure that powers Google, Google Cloud Platform has the technology and the partners to help grow your business on our Cloud.

The process of connecting Looker Studio to BigQuery is simple and ready-built by Google. Now, you can use BigQuery and Looker Studio to create your own dashboards for Amazon Seller Central. This is a great way to make a dashboard in Looker Studio that is more flexible and powerful than the reporting UI that Amazon provides.

Looker Studio pricing

Looker Studio is free, though there is a Looker Studio Pro version that Google charges for. For more information on pricing for the Pro version, Google requires you to talk to a Cloud sales specialist.

Looker Studio Alternatives

Not interested in Looker Studio? Explore, analyze, and visualize data to deliver faster innovation while avoiding vendor lock-in using tools like Tableau, Microsoft Power BI, Looker, Amazon QuickSight, SAP, Alteryx, dbt, Azure Data Factory, Qlik Sense, and many others.

Get Started Now

Openbridge has developed the automated API connector code, which means there is nothing for your to program. We are official connector providers for Amazon Selling Partner and Amazon Advertising API. Openbridge is an Amazon Advertising Partner tools provider and is an approved PII data supplier for Seller Central.

Fuel financial forecasting, marketing analysis, sales reporting, and marketing optimization. Create a new custom dashboard, enhance an existing dashboard, or perform a breakdown of sales with Looker Studio.


Looker Studio + Amazon Seller Central was originally published in Openbridge on Medium, where people are continuing the conversation by highlighting and responding to this story.


from Openbridge - Medium https://ift.tt/zrDLMkf
via IFTTT

Databricks Lakehouse: Why?

Databricks Lakehouse

When to use Databricks and what role should it play in a data lakehouse architecture

Not to oversimplify, but the “lakehouse” is marketing speak for the fusion of the data lake and cloud warehouse. The lakehouse concept is not new, though commercial labeling by companies like Databricks, Google, AWS, Microsoft, and others is.

In this post, we will cover the lakehouse model and how Databricks fits.

What is a lakehouse?

A data lakehouse should be defined as a modern data platform that draws on the best aspects of both a data lake and a data warehouse. The pairing of the storage of a data lake with the query services of a data warehouse is commonly referred to as a lakehouse.

A well-abstracted, standards-based data architecture, by design, depends on loosely coupled services at all levels of the modern data stack. For example, traditional data warehouses tightly couples compute (ie query processing) and storage ( database, tables, views…). However, the lakehouse separation of those compute and storage can deliver efficiency, scalability, and flexibility.

Ideally, one would find a common approach to the advocacy of a modern data strategy that embraces a vendor-agnostic, well-abstracted, standards-based data architecture. While it sounds simple enough, it is not uncommon to see the exact opposite; architectures that are vendor-driven, tool specific, and tightly coupled.

As such, it can be challenging to sift through all the noise. For example, in our post Sorry, Data Lakes Are Not “Legacy” an idea advocated by Fivetran was that you should pick Snowflake and declare victory.

Lauren Balik highlighted the phenomenon in How Fivetran + dbt actually fail. Lauren details how vendors advocate “modern data stacks” that play into a pricing/revenue model, not one based on sound architecture and open, well-abstracted, and open services.

What is lakehouse architecture?

It is important to define the core principles of architecture and technical values. While focused on Facebook Presto, the folks at Ahana discussed the topic of well-abstracted, open data stacks in their post The SQL Data Lakehouse. As discussed by the team Ahana Cloud, the arguments about a Databricks lakehouse vs Snowflake data mesh are unfortunately more marketing one-upmanship than one of the technical merits.

For example, Amazon Athena is a serverless query engine that has no local storage. Storage is the domain of the data lake, which Athena can query. This allows query and storage to scale horizontally.

While Athena, which is based on Facebook Presto, was designed to support this type of local de-coupling of processing and storage, it is by no means the only player. The pattern is quickly becoming a staple, including traditional data warehouse vendors attempting to extend their core offerings to support this model. Ahana, Databricks, Redshift Spectrum, Snowflake, BigQuery, and a host of others support some level of decoupled storage and compute.

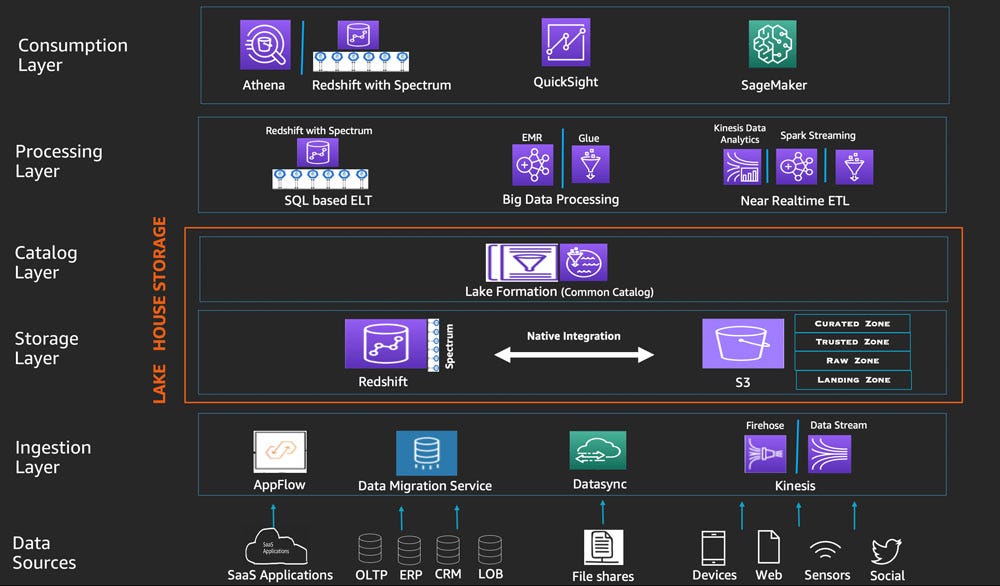
The lakehouse takes the scalable, persistent object storage of the data lake with the SQL, management features, data cataloging, and tools from data warehouses. As a result, the benefits of open, flexible standards in the face of constant technological advances offer welcomed agility and flexibility.

In a paper called Lakehouse: A New Generation of Open Platforms that Unify Data Warehousing and Advanced Analytics, the use of architecture offers low-cost storage in an open format accessible by a variety of processing engines for compute services is the foundation of the data lakehouse;

We define a Lakehouse as a data management system based on low-cost and directly-accessible storage that also provides traditional analytical DBMS management and performance features such as ACID transactions, data versioning, auditing, indexing, caching, and query optimization. Lakehouses thus combine the key benefits of data lakes and data warehouses: low-cost storage in an open format accessible by a variety of systems from the former, and powerful management and optimization features from the latter.

The paper concludes by advocating a modern data architecture that we have promoted (before it was dubbed a lakehouse). The lakehouse architecture that offers SQL and other processing compute services over a well-designed data lake, using open, standard-base file formats, provides flexibility, scale, and competitive price-performance concerns for query latency.

Optimizations, such as localized cache stores in tools like Tableau, can often alleviate query latency performance concerns due to the underlying storage model. As a matter of fact, most modern advanced analytics tools like Power BI, Looker, Tableau, and others embrace a relatively standard approach to optimizing performance via caching.

As we stated earlier, any modern data architecture, by design, must depend on a loosely coupled separation of compute and storage to deliver an efficient, scalable, and flexible solution.

Pentaho co-founder and CTO James Dixon, who coined the term “data lake”, said;

This situation is similar to the way that old school business intelligence and analytic applications were built. End users listed out the questions they want to ask of the data, the attributes necessary to answer those questions were skimmed from the data stream, and bulk loaded into a data mart. This method works fine until you have a new question to ask. The approach solves this problem. You store all of the data in a lake, populate data marts and your data warehouse to satisfy traditional needs, and enable ad-hoc query and reporting on the raw data in the lake for new questions.

A well-abstracted data lake architecture is an excellent foundation for any lakehouse. The benefits of open, flexible standards in the face of constant technological advances provide resistance to your data or analytics process. This includes extending your cloud data warehouses to query the content of your data lake. For example, you may have a use case where your data lake is extended for use by Snowflake or Databricks, or if Snowflake became cost-prohibitive, leverage Ahana or Athena.

As a result, a lakehouse Databricks, Ahana, Snowflake….solution must offer a unified approach for a data platform that can efficiently support business analysts’ analytics capabilities including the use of AWS Analytics with QuickSight, use of Power BI, Tableau, or other tools. So use one business intelligence tool, or any of them, data consumption is well-abstracted so each tool can perform queries against the same lakehouse.

AWS, Google, or Azure Databricks Cloud Data Lakehouse

A lakehouse is not limited to a single platform. Most major cloud platforms package lakehouse solutions. AWS, Google, and Azure all offer a variation of a lakehouse architecture based on their specific product offerings.

For example, the Amazon Web Services Lake House relies on Amazon Athena, Amazon S3, Kinesis, QuickSight, and many other services;

Microsoft also offers a lakehouse vision leveraging Azure services;

Google Cloud puts BigQuery at the core of its offering;

Google highlights the separation of compute and storage as central to its lakehouse data platform;

In the Google example and earlier example from AWS, they illustrate how Amazon Athena can just as easily consume data from a lake as Redshift, Databricks, or Presto.

In all the examples above the architecture rely on a well-abstracted data lake. We have written at length about the benefits of a data lake model as foundational elements of your overall data architecture. A data lake does not intrinsically carry any more technical debt than a warehouse. A data lake, done well, can help reduce the risk of incurring technical debt by properly abstracting aspects of your data architecture with best-in-class solutions. For example, a data lake can offer velocity and flexibility in employing different compute services, minimizing risks of vendor lock-in, and mitigating switching costs.

What is the Databricks Lakehouse?

The Databricks Lakehouse, done properly, should continue a pattern of a well-abstracted, unified approach we advocate for as a characteristic of a modern data platform.

The Databricks LakeHouse is typically offered as a cloud service that provides a platform for ingesting and analyzing data from multiple sources. This includes data ingestion of data objects residing in external locations Hadoop Distributed File System (HDFS), Apache Kafka, Amazon S3, Azure Data Lake Storage Gen2, Azure Blob Storage, and many others.

What is Databricks Lakehouse architecture?

The architecture of a Databricks lakehouse is similar to best practices and reference architectures we have detailed for Azure, Google, and AWS. For example, the AWS data lake uses serverless SQL query services like Amazon Athena and Amazon Redshift (Redshift Spectrum) to query the contents of your data lake.

As a result, a Databricks lakehouse should follow best practices, including embracing compute and storage abstractions and leveraging modern query engine designs resident in many tools.

Databrick or no Databricks, the key is that the core of your lakehouse architecture is not tightly coupled to any specific vendor implementation (unless you make a strategic decision to do so).

Is Delta Lake a Lakehouse?

Databricks refers to a “Delta Lake” in the same context as its “lakehouse.” Databricks says the following;

“Delta Lake provides ACID transactions, scalable metadata handling, and unifies streaming and batch data processing. Delta Lake runs on top of your existing data lake and is fully compatible with Apache Spark APIs. Delta Lake on Databricks allows you to configure Delta Lake based on your workload patterns.”

As such, Delta Lake is not a Lakehouse but may be part of one if you decide on the type of functionality needed for your use case.

The Databricks Unified Analytics Platform

As we have stated, an open, well-abstracted data platform means you can run queries from various tools like Domo, Tableau, Microsoft Power BI, Looker, Amazon Quicksight, and many others.

In addition to supporting a broad array of industry-leading analytic tools, it supports consumption by tools and software like Python, DBT, Tableau Prep, Azure Data Factory, AWS Glue, Azure Machine Learning, and hundreds of others.

So a “Databricks Unified Analytics Platform” should first and foremost, be a function of thoughtful and vendor-agnostic architecture.

Why?

We have touched on a number of points already, but another consideration to consider is that given the high rate of change in the analytics and data tools ecosystems, a data platform must avoid tight coupling with vendor solutions. Tight coupling may offer some benefits, but at the expense of increased technical debt, reduced flexibility, and reliance on niche technological know-how.

As such, data consumption tools should embrace this ethos of playing nicely in a well-abstracted data platform, given that the platform should always be agnostic to the tools that consume data from it. A properly designed Databricks lakehouse must meet that challenge.

Azure Databricks SQL Analytics

With SQL Analytics, you can connect to your data lake without having to install additional software. Many tools offer native connectivity to Databricks which ensures your broader data team can be productive and efficient.

For example, Tableau Databricks offers built-in connectors so a business user consuming a report or a data scientist performing a deep-dive analysis can easily connect to the enterprise Databricks data lakehouse and quickly be productive. Microsoft Power BI and Looker also support native connectivity to Databricks.

So Tableau, Power BI, Looker, DBT, and many others offer native support for Databricks which affords you choice in choosing the tools that offer your teams the greatest flexibility and productivity.

What is Databricks SQL?

Databricks SQL is a dedicated space within Databricks for SQL users. It provides a first-class environment for SQL users, allowing you to run SQL queries against large datasets without having to worry about managing infrastructure.

SQL Analytics workspace features a clean UI designed specifically for SQL users. This includes a powerful set of tools for exploring data, visualizing it, and analyzing it. In a pinch, you can even use SQL Analytics to build dashboards and reports. This might be useful for prototypes or data exploration in support of more formal work in Tableau or PowerBI.

Getting started with Databricks Lakehouse

Whether you are looking at a Lakehouse for Retail or a Lakehouse for Financial Services, Ecommerce, or something else entirely, the right architecture is critical.

Getting started can be intimidating. We always suggest that you start small and be agile in pilot projects. Even going through demos with sample datasets can be excellent next steps. Cloud providers will offer the resources needed to explore Databricks as a free trial. For example, AWS offers a Databricks 14-day free trial on AWS. There is free Databricks training as well.

Being a successful early adopter means taking a business value approach rather than a technology outcome.


Databricks Lakehouse: Why? was originally published in Openbridge on Medium, where people are continuing the conversation by highlighting and responding to this story.


from Openbridge - Medium https://ift.tt/SluO94z
via IFTTT