The Insider's Playbook to Mastering Amazon Marketing Cloud SQL

AMC SQL

Amazon Advertising AMC SQL Unveiled: Tips, Tricks, and Hidden Features

One of the barriers to getting started with Amazon Ads Marketing Cloud is understanding the data and how to write AMC SQL. The datasets are complex, and AMC SQL has a steep learning curve.

Ultimately, the goal of tapping into AMC data is to refine advertising strategy, have a deeper insight into AMC audiences and segments, and create a feedback loop where you have the capabilities to create actionable insights rapidly to optimize advertising campaigns.

Amazon Marketing Cloud AI Copilot

This post demonstrates various examples of AMC SQL queries and how to gain free access to an AMC SQL Data Analyst AI copilot.

Using An AMC AI Data Copilot!

Most people interested in AMC are not data scientists or software engineers with the skills to author structured query language (SQL) queries against complex AMC data.

To lower barriers and increase velocity with AMC, we released “Chatlytics,” a free Amazon Marketing Cloud data analyst AI copilot trained on all things Amazon Marketing Cloud SQL. Using the Chatlytics data analyst copilot is as simple as starting a conversation about your AMC query or dataset.

When you're stuck hunting down a SQL error or exploring new ways to create insights, ask the AMC AI Data Analyst Copilot*.

*This post's SQL, analysis, and visualizations were all developed in collaboration with the AMC SQL AI Copilot!

Sponsored Ads Traffic AMC SQL

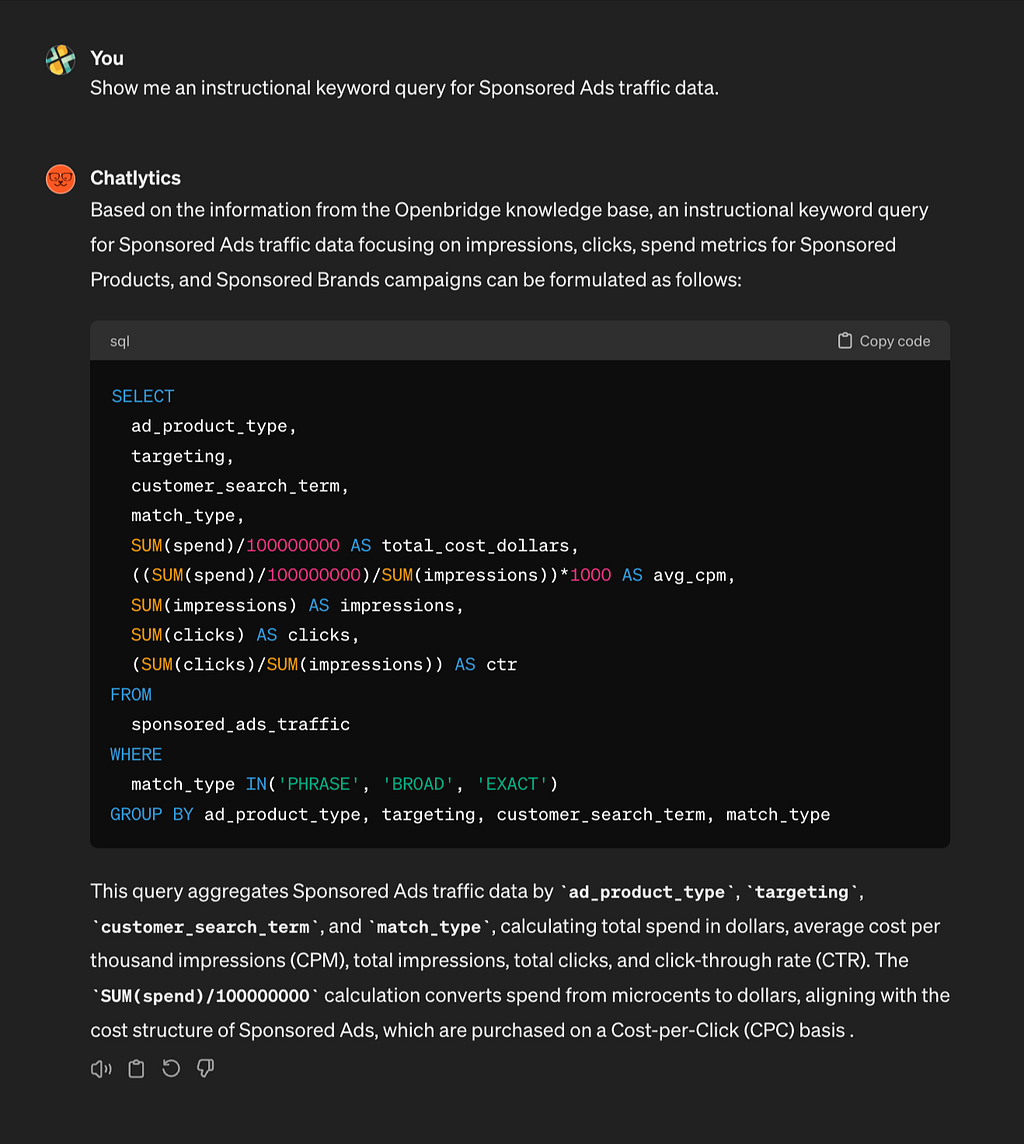
AMC covers Amazon DSP, Amazon Sponsored Ads (like Sponsored Products), Amazon Attribution, and other AMC data sets. In this example is a query for retrieving impressions, clicks, and spending metrics for Sponsored Products and Sponsored brand campaigns from the sponsored_ads_traffic table:

SELECT
ad_product_type,
targeting,
customer_search_term,
match_type,
SUM(spend)/100000000 AS total_cost_dollars,
((SUM(spend)/100000000)/SUM(impressions))*1000 AS avg_cpm,
SUM(impressions) AS impressions,
SUM(clicks) AS clicks,
(SUM(clicks)/SUM(impressions)) AS ctr
FROM
sponsored_ads_traffic
WHERE
match_type IN('PHRASE', 'BROAD', 'EXACT')
GROUP BY
ad_product_type, targeting, customer_search_term, match_type

This query calculates total spend in dollars, the average cost per thousand impressions (avg_cpm), total impressions, total clicks, and click-through rate (ctr) for Sponsored Products and Sponsored Brands campaigns. The query filters data for specific match types (PHRASE, BROAD, EXACT) and groups the results by ad_product_type, targeting, customer_search_term, and match_type .

Based on the Openbridge knowledge base, here are five instructional AMC SQL queries designed to cover a range of fundamental concepts and operations in AMC SQL. These queries offer a structured approach to learning AMC SQL, focusing on different aspects such as aggregation, join operations, conditional logic, and advanced analytics.

Aggregate Impressions and Clicks by Campaign:

SELECT
SUM(c.clicks) AS total_clicks,
COALESCE(SUM(a.conversions), 0) AS total_conversions
FROM dsp_clicks c
LEFT JOIN amazon_attributed_events_by_conversion_time a ON c.request_tag = a.request_tag

DSP Clicks advertiser performance, campaign details, and cost efficiency

Here's an instructional AMC SQL example query for analyzing DSP (Demand Side Platform) clicks data focusing on advertiser performance, campaign details, and cost efficiency. This query aims to aggregate click data by advertiser, campaign, and device type, offering insights into the effectiveness of different campaigns and the devices on which they perform best.

SELECT
advertiser,
campaign,
device_type,
COUNT(clicks) AS total_clicks, -- Aggregating the total number of clicks
SUM(click_cost)/100000 AS total_click_cost_dollars, -- Convert click cost from millicents to dollars
AVG(click_cost)/100 AS avg_click_cost_cents, -- Calculate average click cost in cents
MAX(click_cost)/100 AS max_click_cost_cents, -- Identify the maximum click cost in cents for benchmarking
MIN(click_cost)/100 AS min_click_cost_cents -- Find the minimum click cost in cents for optimization opportunities
FROM
dsp_clicks
GROUP BY
advertiser,
campaign,
device_type

This query performs the following operations:

  • Groups, the DSP clicks data by advertiser, campaign, and device type to analyze performance across these dimensions.
  • Counts the total number of clicks (total_clicks) for each group to measure engagement.
  • Calculate the total click cost in dollars (total_click_cost_dollars), converting from millicents to ensure the cost is easily interpretable.
  • Computes the average, maximum, and minimum click costs (avg_click_cost_cents, max_click_cost_cents, min_click_cost_cents), providing insights into cost variability and efficiency across campaigns.

DSP Impresssion and DSP Clicks

Here's an instructional AMC SQL example for an analysis that combines DSP impressions and clicks data to evaluate campaign performance, including impressions, clicks, and click-through rate (CTR). This query joins the dsp_impressions and dsp_clicks tables on campaign and advertiser IDs, providing a comprehensive view of campaign effectiveness across different devices and browsers.

WITH impressions AS (
SELECT
advertiser_id,
campaign_id,
device_type,
COUNT(impression_date) AS total_impressions -- Assuming 'impression_date' can represent each unique impression
FROM
dsp_impressions
GROUP BY
advertiser_id,
campaign_id,
device_type
),
clicks AS (
SELECT
advertiser_id,
campaign_id,
COUNT(click_date) AS total_clicks -- Assuming 'click_date' can represent each unique click
FROM
dsp_clicks
GROUP BY
advertiser_id,
campaign_id
),
combined_data AS (
SELECT
i.advertiser_id,
i.campaign_id,
i.device_type,
i.total_impressions,
COALESCE(c.total_clicks, 0) AS total_clicks
FROM
impressions i
LEFT JOIN
clicks c ON i.advertiser_id = c.advertiser_id AND i.campaign_id = c.campaign_id
)

SELECT
advertiser_id,
campaign_id,
device_type,
total_impressions,
total_clicks,
CASE
WHEN total_impressions > 0 THEN ROUND((total_clicks / total_impressions) * 100, 2)
ELSE 0
END AS ctr
FROM
combined_data

In this query, we:

  • Create separate CTEs (impressions and clicks) to aggregate total impressions and clicks by advertiser_id and campaign_id, counting occurrences based on the existence of impression_date and click_date, respectively.
  • Join these CTEs in combined_data to align clicks with their corresponding impressions.
  • Calculate the CTR as (total_clicks / total_impressions) * 100, rounding to two decimal places where applicable, with safeguards against division by zero.

This approach ensures compliance with AMC’s SQL requirements and provides an analysis framework for DSP campaign performance across different device types.

To extend the approach to include dsp_views dsp_impressions and dsp_clicks, creating a more comprehensive analysis of DSP data, we'll introduce another CTE for views. This will aggregate total views alongside impressions and clicks for each campaign and advertiser. This updated query will provide insights into how many impressions and clicks each campaign received and how many impressions were viewable.

WITH impressions AS (
SELECT
advertiser_id,
campaign_id,
device_type,
COUNT(impression_date) AS total_impressions -- Assuming 'impression_date' represents each unique impression
FROM
dsp_impressions
GROUP BY
advertiser_id,
campaign_id,
device_type
),
clicks AS (
SELECT
advertiser_id,
campaign_id,
COUNT(click_date) AS total_clicks -- Assuming 'click_date' represents each unique click
FROM
dsp_clicks
GROUP BY
advertiser_id,
campaign_id
),
views AS (
SELECT
advertiser_id,
campaign_id,
COUNT(event_date) AS total_views -- Assuming 'event_date' can represent each unique view
FROM
dsp_views
GROUP BY
advertiser_id,
campaign_id
),
combined_data AS (
SELECT
i.advertiser_id,
i.campaign_id,
i.device_type,
i.total_impressions,
COALESCE(c.total_clicks, 0) AS total_clicks,
COALESCE(v.total_views, 0) AS total_views
FROM
impressions i
LEFT JOIN
clicks c ON i.advertiser_id = c.advertiser_id AND i.campaign_id = c.campaign_id
LEFT JOIN
views v ON i.advertiser_id = v.advertiser_id AND i.campaign_id = v.campaign_id
)

SELECT
advertiser_id,
campaign_id,
device_type,
total_impressions,
total_clicks,
total_views,
CASE
WHEN total_impressions > 0 THEN ROUND((total_clicks / total_impressions) * 100, 2)
ELSE 0
END AS ctr,
CASE
WHEN total_impressions > 0 THEN ROUND((total_views / total_impressions) * 100, 2)
ELSE 0
END AS view_rate
FROM
combined_data

This query includes:

  • A CTE named views to count the total number of views (total_views) for each combination of advertiser_id and campaign_id.
  • An updated combined_data CTE that joins the views data with impressions and clicks to align views alongside clicks and impressions for the same campaign and advertiser.
  • Calculations for both CTR and view rate (view_rate), where view rate is defined as the percentage of viewable impressions using logic similar to CTR calculation.

The query offers a multi-dimensional view of DSP campaign performance, incorporating the engagement metrics (clicks) and the visibility of ads (views) across different devices. This enhanced analysis allows advertisers to understand which campaigns generate interactions and which are effectively reaching and being seen by the audience.

Calculating DSP Campaign and Sponsored Display Campaign Costs

Combining the principles from the DSP campaigns and Sponsored Display campaigns, the goal is to create a comprehensive query that calculates the costs for both types of campaigns in one unified view. This query will incorporate conversion from millicents and microcents to dollars for DSP ads and Sponsored Display ads, respectively, while accounting for the different billing strategies of CPC (Cost Per Click) and vCPM (Cost per thousand viewable impressions) for Sponsored Display.

-- DSP Campaigns Cost Calculation
WITH dsp_campaign_costs AS (
SELECT
CAST('DSP Campaign' AS VARCHAR(255)) AS campaign_type,
CAST(campaign_id AS VARCHAR(255)) AS campaign_id,
CAST(campaign AS VARCHAR(255)) AS campaign_name,
CAST(currency_name AS VARCHAR(255)) AS currency_name,
CAST(currency_iso_code AS VARCHAR(255)) AS currency_iso_code,
CAST(SUM(impression_cost) / 100000.0 AS DECIMAL(10, 2)) AS impression_cost_dollars,
CAST(SUM(total_cost) / 100000.0 AS DECIMAL(10, 2)) AS total_cost_dollars
FROM
dsp_impressions
GROUP BY
campaign_id, campaign, currency_name, currency_iso_code
),

-- Sponsored Display Campaigns Cost Calculation
sponsored_display_costs AS (
SELECT
CAST('Sponsored Display Campaign' AS VARCHAR(255)) AS campaign_type,
CAST(NULL AS VARCHAR(255)) AS campaign_id, -- Explicitly casting NULL for campaign_id
CAST(campaign AS VARCHAR(255)) AS campaign,
CAST(NULL AS VARCHAR(255)) AS currency_name, -- Assuming uniform currency, explicitly casting NULL
CAST(NULL AS VARCHAR(255)) AS currency_iso_code, -- Assuming uniform currency, explicitly casting NULL
CAST(0.0 AS DECIMAL(10,2)) AS impression_cost_dollars, -- Placeholder for consistent column structure
CAST(SUM(spend) / 100000000.0 AS DECIMAL(10, 2)) AS spend_dollars
FROM
sponsored_ads_traffic
WHERE
ad_product_type = 'sponsored_display'
GROUP BY
campaign
)

-- Final Selection with explicit casts to ensure data type consistency across UNION ALL
SELECT
campaign_type,
campaign_id,
campaign_name,
currency_name,
currency_iso_code,
impression_cost_dollars,
total_cost_dollars
FROM
dsp_campaign_costs

UNION ALL

SELECT
campaign_type,
campaign_id,
campaign,
currency_name,
currency_iso_code,
impression_cost_dollars,
spend_dollars AS total_cost_dollars -- Matching the column name and data type in the SELECT above
FROM
sponsored_display_costs
ORDER BY
campaign_type, campaign_name;
  1. Explicit Data Type Specifications: All literals and NULL values are cast to VARCHAR(255) to ensure consistency across the UNION ALL operation. This includes campaign types, campaign IDs (where applicable), and currency fields.
  2. Decimal Calculations: Monetary values converted from microcents/millicents to dollars are explicitly cast as DECIMAL(10, 2) to ensure precise financial reporting and to match data types across the unioned parts.
  3. Placeholder Values for Sponsored Display: For columns in the Sponsored Display section that don’t have a direct counterpart in DSP campaigns (like currency_name, currency_iso_code, and impression_cost_dollars), placeholders are used with explicit casting to ensure column data type alignment.

Ad-attributed Branded Searches

Calculating the branded search rate and cost per branded search streamlines the analysis of ad-attributed branded searches. The objective is to create a comprehensive view that captures the branded search activity and offers insights into its efficiency and cost-effectiveness. The optimization simplifies data handling and ensures all calculations are done within a cohesive query structure.

WITH branded_searches AS (
SELECT
ae.campaign_id,
ae.campaign,
SUBSTRING(ae.tracked_item FROM 9) AS keyword, -- Extracting the keyword explicitly
COUNT(ae.conversions) AS number_of_branded_searches -- Counting conversions explicitly
FROM
amazon_attributed_events_by_conversion_time ae
WHERE
ae.tracked_item LIKE 'keyword%' -- Ensuring LIKE is used for pattern matching
GROUP BY
ae.campaign_id,
ae.campaign,
SUBSTRING(ae.tracked_item FROM 9)
),
campaign_costs AS (
SELECT
di.campaign_id,
di.campaign,
SUM(di.impressions) AS total_impressions,
SUM(di.impression_cost) / 100000.0 AS total_impression_cost_dollars -- Converting millicents to dollars
FROM
dsp_impressions di
GROUP BY
di.campaign_id,
di.campaign
),
-- Merging branded searches with campaign costs for analysis
campaign_analysis AS (
SELECT
cc.campaign_id AS campaign_id,
cc.campaign AS campaign_name,
bs.keyword AS branded_keyword,
cc.total_impressions AS impressions,
cc.total_impression_cost_dollars AS impression_cost_dollars,
COALESCE(bs.number_of_branded_searches, 0) AS branded_searches_count
FROM
campaign_costs cc
LEFT JOIN
branded_searches bs ON cc.campaign_id = bs.campaign_id
)
SELECT
campaign_id,
campaign_name,
branded_keyword,
impressions,
impression_cost_dollars,
branded_searches_count,
CASE
WHEN impressions > 0 THEN
CAST(branded_searches_count AS FLOAT) / CAST(impressions AS FLOAT)
ELSE 0.0
END AS branded_search_rate,
CASE
WHEN branded_searches_count > 0 THEN
impression_cost_dollars / CAST(branded_searches_count AS FLOAT)
ELSE 0.0
END AS cost_per_branded_search
FROM
campaign_analysis
  • Integration of Branded Searches and Campaign Metrics: The branded_searches CTE isolates branded search events while campaign_metrics aggregating campaign-level metrics like impressions and cost. The combined_data CTE then merges these datasets to provide a comprehensive view.
  • Efficient Calculation of Metrics: By combining data incombined_data, we enable direct calculation of the branded search rate and cost per branded search within a single SELECT statement, improving query efficiency and readability.
  • Conditional Aggregations: The use of CASE statements ensure safe division, avoiding division by zero and ensuring the calculations only proceed when valid data is available.
  • Explicit Data Handling: Converting impression costs from millicents to dollars in the campaign_metrics CTE ensures clarity and consistency in cost reporting across different data sources.

This approach streamlines the analysis process and ensures that the insights derived from the DSP campaign performance regarding branded searches are accurate, comprehensive, and actionable, aligning with the intended use case of optimizing analysis for brand search.

From AMC SQL to AMC Insights

What can you do with the results of AMC SQL queries? A lot! Here are just a few examples of the types of analysis you can undertake data analysis and visualization to optimize advertising strategies on the same result set.

CTR Performance by Device Type

The AMC SQL results allow us to calculate the average CTR for each device type across all campaigns to identify which devices yield higher engagement. This could help focus advertising efforts on the most effective devices.

A bar chart comparing the average CTR across different device types (e.g., Connected Device, PC, Phone, SetTopBox, TV) would visually highlight the devices with higher engagement.

The analysis reveals each device type's average Click-Through Rate (CTR), indicating significant variations across different devices. Here’s a summary of the findings, sorted from highest to lowest average CTR:

  • PC: 360.75
  • TV: 359.21
  • SetTopBox: 359.08
  • Tablet: 179.18
  • Connected Device: 119.73
  • Phone: 89.69

These results suggest that advertising on PCs, TVs, and SetTopBoxes yields the highest engagement in terms of CTR, while Phones and Connected Devices have the lowest. Advertising strategies might be optimized by allocating more resources to the higher-performing device types or by exploring ways to improve engagement on the underperforming ones.

Next, let’s visualize these findings with a bar chart to better illustrate the differences in CTR across device types.
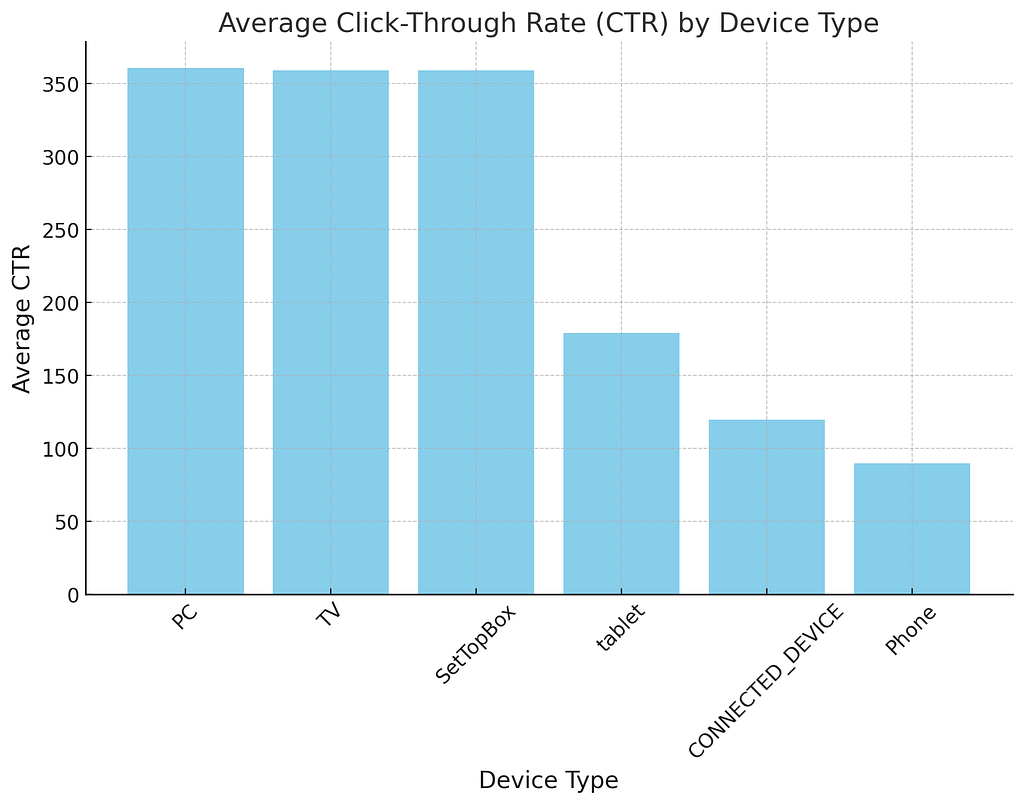
The bar chart visually represents the average Click-Through Rate (CTR) by device type, highlighting the significant variance in CTR across different devices. PCs, TVs, and SetTopBoxes show the highest average CTR, suggesting these platforms are more effective for engaging users with advertisements. Conversely, Phones and Connected Devices exhibit lower CTRs, indicating potential areas for optimization or strategy adjustment.

This analysis suggests focusing advertising efforts on the higher-performing devices or investigating strategies to enhance engagement on platforms with lower CTRs. Adjusting creative content, ad placement, or targeting criteria could improve performance on underperforming devices.

Impressions and Clicks Relationship

The outputs of the AMC SQL allow us to investigate the relationship between the number of impressions and clicks across different device types. This could identify if more impressions always lead to more clicks or if there’s a saturation point beyond which additional impressions don’t translate into proportionally more clicks.

Scatter plots for each device type, with total impressions on the X-axis and total clicks on the Y-axis, could help visualize this relationship. Adding a trend line would make it easier to see if the relationship is linear or if diminishing returns are evident.
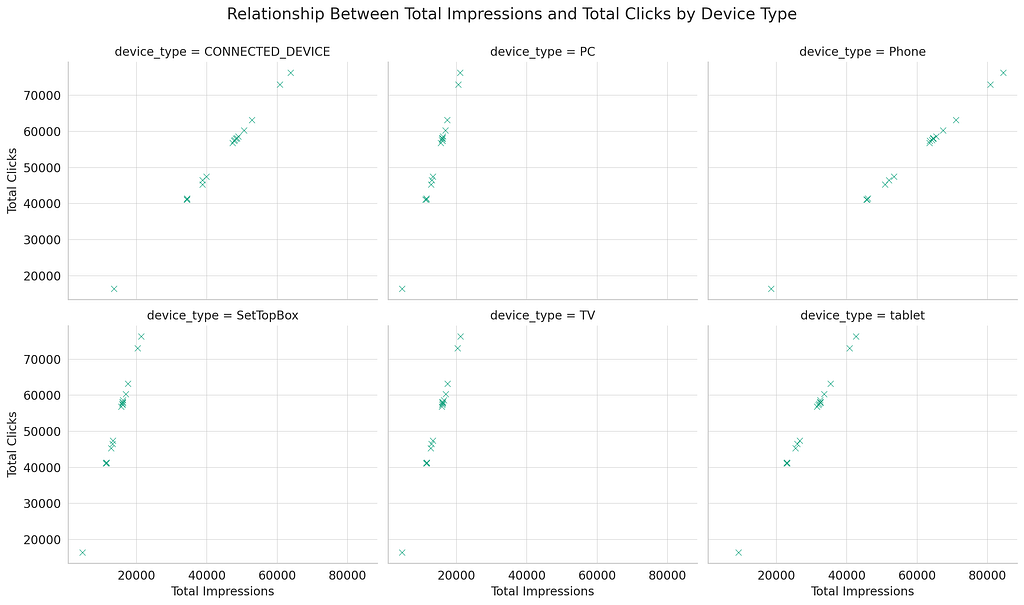
The scatter plots illustrate the relationship between total impressions and clicks for each device type. Here are some observations:

  • For most device types, there appears to be a positive relationship between the number of impressions and the number of clicks, indicating that, generally, more impressions lead to more clicks.
  • The density and distribution of points vary across device types, suggesting differences in how users engage with ads on these platforms.
  • Certain device types might show signs of saturation or diminishing returns, where beyond a certain point, increases in impressions do not lead to proportional increases in clicks. This effect would be easier to identify with a larger dataset or by applying trend lines.

These insights can help inform advertising strategies by identifying optimal levels of ad exposure across different devices and adjusting campaign efforts to maximize engagement without overspending on impressions that do not convert to clicks.

Campaign Performance Analysis

Calculate each campaign's key performance indicators, such as impressions, clicks, and average CTR. This can help identify high-performing campaigns and understand the characteristics that contribute to their success.

The dashboard-like visualization presents the performance metrics of the top 10 campaigns, focusing on Total Impressions, Total Clicks, and Average Click-Through Rate (CTR). This comparative view allows for a more straightforward analysis of what makes these campaigns successful and offers insights into optimizing future advertising strategies:
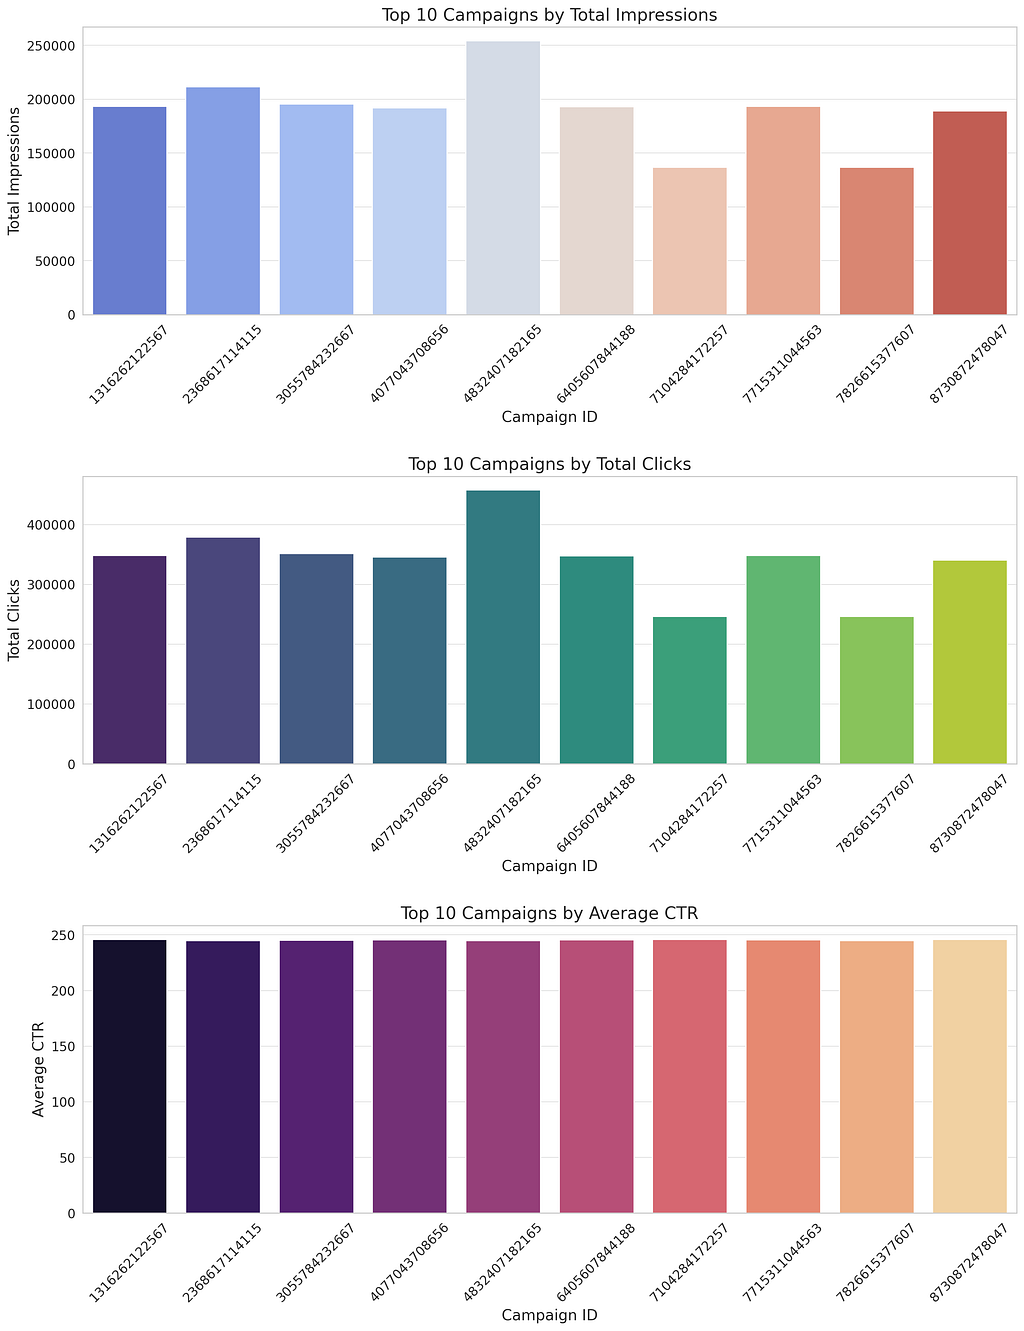
  • The Total Impressions chart shows each campaign's reach. Campaigns with higher impressions have the potential for broader visibility.
  • The Total Clicks chart reflects the engagement level, indicating how often users interacted with the ads.
  • The Average CTR chart highlights each campaign's efficiency in converting impressions into clicks, a key measure of ad effectiveness.

Analyzing these metrics together provides a comprehensive view of campaign performance, helping identify strengths to replicate and areas for improvement. For example, campaigns with high impressions but lower CTRs may need to refine targeting or creative content, while those with high CTRs demonstrate successful engagement strategies worth emulating.

References

Building An Amazon Marketing Cloud Clean Room


The Insider's Playbook to Mastering Amazon Marketing Cloud SQL was originally published in Openbridge on Medium, where people are continuing the conversation by highlighting and responding to this story.


from Openbridge - Medium https://ift.tt/MHgiN7V
via Openbridge

Chatlytics: Amazon Marketing Cloud AI Copilot

The Chatlytics Amazon Marketing Cloud AI Copilot is your data analysis partner, simplifying the traditionally complex process of authoring AMC SQL.

One of the barriers to getting started with Amazon Marketing Cloud is understanding the data and how to write AMC SQL. The datasets are complex, and AMC SQL has a steep learning curve.

We released a free Amazon Marketing Cloud Copilot called “Chatlytics.” If you are hunting down an SQL error or exploring new ways to create insights, start a conversation about your AMC query or dataset. When you’re stuck, ask the Chatlytics Copilot.

Generate AMC SQL

The Chatlytics Copilot empowers non-technical users with a straightforward approach to understanding AMC’s operation.

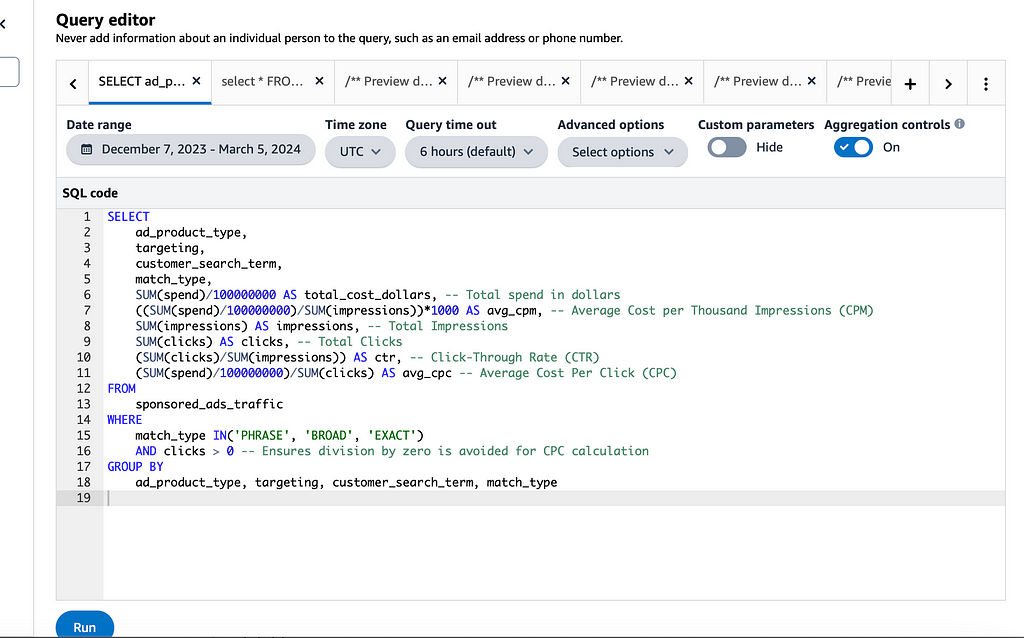
Paste SQL into the AMC Query Editor

It’s interactive, iterative, and conversational, making learning enjoyable and relatable. This saves time, reduces frustration, and instills a sense of capability in navigating a complex tool like AMC.

  • Ask for ideas on how to query DSP Impressions, Clicks, Conversions, Sponsored Ads…
  • Let it help uncover new strategies to explore insight opportunities.
  • Trace and troubleshoot errors in AMC SQL. If AMC throws an SQL error, Chatlytics can help you solve it.
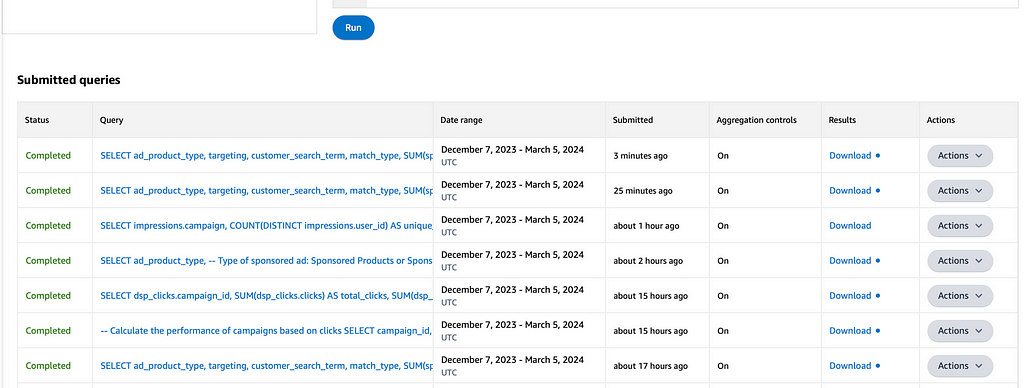
Download your AMC Query Results

The Chatlytics service is free. However, to access the Chatlytics AMC Copilot, you must have an OpenAI ChatGPT Plus plan.

Start using the Amazon Marketing Cloud Copilot “Chatlytics” today!


Chatlytics: Amazon Marketing Cloud AI Copilot was originally published in Openbridge on Medium, where people are continuing the conversation by highlighting and responding to this story.


from Openbridge - Medium https://ift.tt/Qmwbd9a
via IFTTT

Chatlytics: Amazon Marketing Cloud AI Copilot

The Chatlytics Amazon Marketing Cloud AI Copilot is your data analysis partner, simplifying the traditionally complex process of authoring AMC SQL.

One of the barriers to getting started with Amazon Marketing Cloud is understanding the data and how to write AMC SQL. The datasets are complex, and AMC SQL has a steep learning curve.

We released a free Amazon Marketing Cloud Copilot called “Chatlytics.” If you are hunting down an SQL error or exploring new ways to create insights, start a conversation about your AMC query or dataset. When you’re stuck, ask the Chatlytics Copilot.

Generate AMC SQL

The Chatlytics Copilot empowers non-technical users with a straightforward approach to understanding AMC’s operation.

Paste SQL into the AMC Query Editor

It’s interactive, iterative, and conversational, making learning enjoyable and relatable. This saves time, reduces frustration, and instills a sense of capability in navigating a complex tool like AMC.

  • Ask for ideas on how to query DSP Impressions, Clicks, Conversions, Sponsored Ads…
  • Let it help uncover new strategies to explore insight opportunities.
  • Trace and troubleshoot errors in AMC SQL. If AMC throws an SQL error, Chatlytics can help you solve it.
Download your AMC Query Results

The Chatlytics service is free. However, to access the Chatlytics AMC Copilot, you must have an OpenAI ChatGPT Plus plan.

Start using the Amazon Marketing Cloud Copilot “Chatlytics” today!


Chatlytics: Amazon Marketing Cloud AI Copilot was originally published in Openbridge on Medium, where people are continuing the conversation by highlighting and responding to this story.


from Openbridge - Medium https://ift.tt/zV0M1pr
via Openbridge

Verified Amazon Connector for Google Sheets

Connect Amazon and Google Sheets to keep data synced with scale, efficiency, and simplicity.

Do you want to use Google Sheets for Amazon Sponsored Brands, Products, Display, or TV analysis? Would you like to use Google Sheets to automate Amazon DSP, Amazon Marketing Stream, Vendor Central, and Seller Central data analysis?

Rather than manually downloading Excel or CSV reports and importing them into Google Sheets, you can automate Amazon data flow to Google BigQuery via verified Amazon APIs.

Google BigQuery is an official Google Sheets Add-on that allows you to connect and import data directly from your Amazon Seller Central, Vendor Central, and Amazon Ads accounts.

Why Automate Using An Amazon Connector for Google Sheets?

Direct access to Amazon API reporting data means no messy, time-consuming manual report downloads. Just simple, straightforward data access in Google Sheets powered by BigQuery.

BigQuery allows you to scale beyond Google Sheets limits. Here are just a few ways it helps you scale:

  1. Handling Larger Datasets: BigQuery can process and analyze datasets much larger than the maximum allowed in Google Sheets (which limits the number of cells), enabling users to work with vast amounts of data without performance hits.
  2. Increased Query Performance: For datasets that exceed Google Sheets’ capacity, BigQuery’s infrastructure allows for faster query execution times, even on very large datasets. Supports more dynamic and complex data exploration.
  3. Designed To Scale With Your Business. BigQuery’s architecture is designed to handle petabytes of data, offering users virtually no data limits. This ensures that as a user’s data needs to grow, BigQuery can easily handle the workloads of a growing agency, seller, or vendor across 100s of clients, accounts, or advertisers.

Supercharged Amazon Connector for Google Sheets Powered By BigQuery

With the flow of data automated from Amazon to BigQuery, you access, analyze, visualize, and share billions of rows of data in Google Sheets using official Google-approved connectors.

The Sheets + BigQuery connector offers fast, automated, and simple data automation so you can focus on using data in Google Sheets to get the insight jobs done.

  • Collaborate with partners, analysts, or other stakeholders in a familiar Google Sheets interface.
  • Eliminate many data limits for Google Sheets by using BigQuery to store all your data, including years of historical data no longer available via the Amazon APIs.
  • Cost-effectively scale the volume of data you can use in Sheets with the power of Google BigQuery.
  • Ditch the messy, manual report downloads. Ensure a single source of truth for data analysis without constant downloads and file management.
  • Streamline your reporting and dashboard workflows with fast, efficient data analysis on Google Sheets.
  • The flexibility to use other tools like Looker, Power BI, or Tableau using the same data stored in BigQuery.

Connected Google Sheets runs queries on BigQuery for you. The results of those queries are saved in your spreadsheet for analysis and sharing. You get the power of a scalable cloud data warehouse like BigQuery with the familiarity of a tool like Google Sheets.

Google BigQuery to Google Sheets Examples

You can create a Google Sheets Amazon price tracker or have Google Sheets live update Amazon price updates to BigQuery. Not only can you have Amazon Seller Central to Google Sheets, but you can also have Amazon Vendor Central and Amazon Ads.

You can use Google Sheets to analyze hundreds of other automated data sources to do more than an Amazon Seller Google Sheets report.

  • Create an Amazon FBA spreadsheet that streamlines the tracking of fulfillment metrics, enhancing logistics and inventory management efficiency.
  • Utilizing data automation for an Amazon seller spreadsheet significantly improves sales and expense tracking accuracy and speed, aiding in better financial decision-making.
  • Implementing data automation in an Amazon FBA inventory spreadsheet optimizes inventory levels, reducing the risk of stockouts or overstocking, thereby maximizing profitability.
  • Rather than manually track Amazon sales data in Excel, Google Sheets + BigQuery Sellers and Vendors can quickly analyze sales trends and performance, enabling more informed strategic planning and marketing decisions.
  • Data automation for an Amazon inventory spreadsheet ensures real-time inventory tracking, facilitating more effective stock management and replenishment strategies.
  • Employing data automation in an Amazon profit Excel spreadsheet provides a clear, instantaneous view of profit margins, helping to identify areas for cost reduction and revenue enhancement.
  • While you can manually create an Amazon product listing template in Excel, Google Sheets automation streamlines the listing process, improving accuracy and saving time, which can be redirected toward other growth activities.

To see how easy it is to connect sheets to BigQuery, check out this video guide:

Amazon API + Google Sheets

This is not Amazon price scraping to Google Sheets; this is using official Amazon APIs to load data into Google BigQuery!

Amazon offers Seller, Vendor, and Ads data feeds for a broad cross-section of data to be used in Google Sheets via BigQuery.

Openbridge fully automates the data flow from Amazon to a private, trusted BigQuery destination you own. Here are just some of the Amazon data you can access;

Get Started Automating Amazon Data To Google Sheets— For Free.

Amazon Seller, Vendor, and Amazon Ads to Google Sheets powered by BigQuery can be set up in minutes with Amazon automation.

Openbridge delivers code-free data automation to BigQuery across Amazon Advertising Sponsored Ads, Amazon DSP, Amazon Marketing Stream, and Amazon Attribution. We also fully support Amazon Seller and Vendor Central data automation.

If you are a Brand, Digital Agency, or something in between, we offer a free 30-day trial so that you can connect Google Sheets and Amazon data together via BigQuery.

>> Get a 30-day free trial to try the Amazon Connector for Google Sheets for yourself.

References


Verified Amazon Connector for Google Sheets was originally published in Openbridge on Medium, where people are continuing the conversation by highlighting and responding to this story.


from Openbridge - Medium https://ift.tt/D3Wd8Cv
via IFTTT

Verified Amazon Connector for Google Sheets

Connect Amazon and Google Sheets to keep data synced with scale, efficiency, and simplicity.

Do you want to use Google Sheets for Amazon Sponsored Brands, Products, Display, or TV analysis? Would you like to use Google Sheets to automate Amazon DSP, Amazon Marketing Stream, Vendor Central, and Seller Central data analysis?

Rather than manually downloading Excel or CSV reports and importing them into Google Sheets, you can automate Amazon data flow to Google BigQuery via verified Amazon APIs.

Google BigQuery is an official Google Sheets Add-on that allows you to connect and import data directly from your Amazon Seller Central, Vendor Central, and Amazon Ads accounts.

Why Automate Using An Amazon Connector for Google Sheets?

Direct access to Amazon API reporting data means no messy, time-consuming manual report downloads. Just simple, straightforward data access in Google Sheets powered by BigQuery.

BigQuery allows you to scale beyond Google Sheets limits. Here are just a few ways it helps you scale:

  1. Handling Larger Datasets: BigQuery can process and analyze datasets much larger than the maximum allowed in Google Sheets (which limits the number of cells), enabling users to work with vast amounts of data without performance hits.
  2. Increased Query Performance: For datasets that exceed Google Sheets’ capacity, BigQuery’s infrastructure allows for faster query execution times, even on very large datasets. Supports more dynamic and complex data exploration.
  3. Designed To Scale With Your Business. BigQuery’s architecture is designed to handle petabytes of data, offering users virtually no data limits. This ensures that as a user’s data needs to grow, BigQuery can easily handle the workloads of a growing agency, seller, or vendor across 100s of clients, accounts, or advertisers.

Supercharged Amazon Connector for Google Sheets Powered By BigQuery

With the flow of data automated from Amazon to BigQuery, you access, analyze, visualize, and share billions of rows of data in Google Sheets using official Google-approved connectors.

The Sheets + BigQuery connector offers fast, automated, and simple data automation so you can focus on using data in Google Sheets to get the insight jobs done.

  • Collaborate with partners, analysts, or other stakeholders in a familiar Google Sheets interface.
  • Eliminate many data limits for Google Sheets by using BigQuery to store all your data, including years of historical data no longer available via the Amazon APIs.
  • Cost-effectively scale the volume of data you can use in Sheets with the power of Google BigQuery.
  • Ditch the messy, manual report downloads. Ensure a single source of truth for data analysis without constant downloads and file management.
  • Streamline your reporting and dashboard workflows with fast, efficient data analysis on Google Sheets.
  • The flexibility to use other tools like Looker, Power BI, or Tableau using the same data stored in BigQuery.

Connected Google Sheets runs queries on BigQuery for you. The results of those queries are saved in your spreadsheet for analysis and sharing. You get the power of a scalable cloud data warehouse like BigQuery with the familiarity of a tool like Google Sheets.

Google BigQuery to Google Sheets Examples

You can create a Google Sheets Amazon price tracker or have Google Sheets live update Amazon price updates to BigQuery. Not only can you have Amazon Seller Central to Google Sheets, but you can also have Amazon Vendor Central and Amazon Ads.

You can use Google Sheets to analyze hundreds of other automated data sources to do more than an Amazon Seller Google Sheets report.

  • Create an Amazon FBA spreadsheet that streamlines the tracking of fulfillment metrics, enhancing logistics and inventory management efficiency.
  • Utilizing data automation for an Amazon seller spreadsheet significantly improves sales and expense tracking accuracy and speed, aiding in better financial decision-making.
  • Implementing data automation in an Amazon FBA inventory spreadsheet optimizes inventory levels, reducing the risk of stockouts or overstocking, thereby maximizing profitability.
  • Rather than manually track Amazon sales data in Excel, Google Sheets + BigQuery Sellers and Vendors can quickly analyze sales trends and performance, enabling more informed strategic planning and marketing decisions.
  • Data automation for an Amazon inventory spreadsheet ensures real-time inventory tracking, facilitating more effective stock management and replenishment strategies.
  • Employing data automation in an Amazon profit Excel spreadsheet provides a clear, instantaneous view of profit margins, helping to identify areas for cost reduction and revenue enhancement.
  • While you can manually create an Amazon product listing template in Excel, Google Sheets automation streamlines the listing process, improving accuracy and saving time, which can be redirected toward other growth activities.

To see how easy it is to connect sheets to BigQuery, check out this video guide:

Amazon API + Google Sheets

This is not Amazon price scraping to Google Sheets; this is using official Amazon APIs to load data into Google BigQuery!

Amazon offers Seller, Vendor, and Ads data feeds for a broad cross-section of data to be used in Google Sheets via BigQuery.

Openbridge fully automates the data flow from Amazon to a private, trusted BigQuery destination you own. Here are just some of the Amazon data you can access;

Get Started Automating Amazon Data To Google Sheets— For Free.

Amazon Seller, Vendor, and Amazon Ads to Google Sheets powered by BigQuery can be set up in minutes with Amazon automation.

Openbridge delivers code-free data automation to BigQuery across Amazon Advertising Sponsored Ads, Amazon DSP, Amazon Marketing Stream, and Amazon Attribution. We also fully support Amazon Seller and Vendor Central data automation.

If you are a Brand, Digital Agency, or something in between, we offer a free 30-day trial so that you can connect Google Sheets and Amazon data together via BigQuery.

>> Get a 30-day free trial to try the Amazon Connector for Google Sheets for yourself.

References


Verified Amazon Connector for Google Sheets was originally published in Openbridge on Medium, where people are continuing the conversation by highlighting and responding to this story.


from Openbridge - Medium https://ift.tt/FH6AQ4Y
via Openbridge

Optimizing Amazon Brand Store Performance

Using insights to fuel Amazon Brand Store best practices, growth, and scale

Amazon now offers extensive performance insights for brand stores that provide metrics on your customer experience and products and recommendations on improving visibility.

These brand store insights are now available via Amazon APIs, which allows fast, automated access to data that allows your team new pathways to analyze, visualize, and optimize your customer experience investments.

Why Amazon Brand Stores? Enhancing Brand Visibility On Amazon

Amazon Stores allow you to showcase your brand and products in a multipage, immersive shopping experience. Amazon Brand Store enhances brand visibility and differentiation in a crowded marketplace, allowing sellers and vendors to showcase their products, tell their brand story, and engage customers with rich media content such as images and videos. This helps build brand loyalty and awareness and drives sales by providing a centralized location for customers to browse and purchase products directly from the brand.

Building Brand Affinity: Amazon Brand Stores Deliver Results

No matter the size of your brand, Amazon Stores gives you an immersive place to introduce audiences to your story, mission, and products.

Per Amazon, Brand stores have a direct impact on performance:

+83% higher dwell time. Stores with 3+ pages have 83% higher shopper dwell time and 32% higher attributed sales per visitor.
+35% higher attributed sales per visitor. On average, Stores updated within the past 90 days have 21% more repeat visitors and 35% higher attributed sales per visitor.

Brand Stores offer valuable insights into customer behavior and preferences through analytics, enabling brands to optimize their marketing strategies and product offerings.

Amazon Brand Store Examples: Analytics Insights

So, what type of data is available via API? There are three primary groups of store performance metrics;

  • Brand Performance
  • Product-level ASIN Performance
  • Quality and Recommendations

Brand Performance Metrics

All the available insight metrics for evaluating Brand Store performance on Amazon:

  • VIEWS: Number of page views.
  • ORDERS: Estimated total orders placed by Store visitors within 14 days of their visit. Orders contain one or more units sold.
  • UNITS: Estimated units purchased by Store visitors within 14 days of their last visit.
  • SALES: Estimated total sales generated by Store visitors within 14 days of their last visit.
  • VISITS: Total visits to a page within a single day. Each visitor can visit more than one page and your Store from multiple traffic sources.
  • VISITORS: Total visitors to your Store within the selected date range, calculated based on daily unique users or devices.
  • SCORE_LEVEL: Store Quality rating calculated on various factors defining the quality of a store. It can be HIGH, MEDIUM, or LOW.
  • RECOMMENDATIONS: An array of objects containing two fields: recommended action (e.g., “Add a video”) and observed average well time increase (the improvement it would bring in the overall store quality).
  • CONTRIBUTORS: An array of recommendations applied by the Store Owner improves overall store quality.
  • DWELL: Average time a customer spends in the store, specifically for store quality measurement.
  • PEER_DWELL: Average time a customer spends on other similar (peer) stores.
  • DWELL_TIME: Average time a customer spends in the store, providing insights into user engagement by calculating the average duration of visits.
  • BOUNCE_RATE: Ratio of total bounce visits (customers who landed at the store and left quickly without engaging) to total landing visits, providing insights into visitor engagement.
  • NEW_TO_STORE: Total count of unique visitors new to the store, providing valuable insights into the number of first-time shoppers.

Product-level ASIN Performance Metrics

Beyond store-wide metrics, Amazon also offers ASIN-specific data, allowing brands to drill down into the performance of individual products within their store. These metrics include views, orders, units, add-to-carts, and others, providing a granular view of how products perform and interact with potential customers.

  • VIEWS: Number of times a customer viewed an ASIN. It can happen once per page visit.
  • ORDERS: Estimated total orders placed by Store visitors on the day of the ASIN view. Orders can have one or more total units.
  • UNITS: Estimated units purchased by Store visitors during attributed orders for the ASIN.
  • ADDTOCARTS: Total number of times an ASIN was added to a cart by a customer on a store page.
  • IN_STOCK_VIEWS: Total views of an ASIN on a store page while the ASIN was in stock. For ASINs with variations, the customer must have selected a variation in stock to be counted.
  • AVERAGE_IN_STOCK_PRICE: Average price in local currency the ASIN was viewed at by customers while it was in stock.
  • IN_STOCK_RATE: Rate at which customers viewed an ASIN while it was in stock.
  • AVERAGE_SALE_PRICE: Average price in local currency for which the ASIN is sold during the order.
  • CONVERSION_RATE: Rate at which customers ordered a unit of the item over how many times customers clicked the item.
  • CLICKS: Count how often a customer clicks an ASIN-related widget on the store page.
  • CLICK_RATE: Rate at which the ASIN was clicked per view. This ratio can be above one if the widget interacts with a widget with engaging features.
  • RENDERS: Number of times the ASIN is rendered on a store page. Note — this does not guarantee that the customer saw the ASIN.
  • TOTAL_VIEWS: Total number of times customers viewed ASINs on the store’s pages. A view can happen once per store page visit.
  • TOTAL_CLICKS: Total count of times a customer clicked an ASIN-related widget on the store’s pages.

Quality and Recommendations Metrics

Amazon’s quality and recommendations metrics are particularly noteworthy. They focus on your Brand Store’s average dwell time, compare your performance to peer groups, and rate your store’s quality.

High ratings indicate effective engagement strategies, and Amazon uses these ratings to suggest specific actions further to improve your store’s performance and customer dwell time.

For example, Amazon will provide a score and ranking for your store

  • SCORE_LEVEL: High
  • DWELL: 77.93

The SCORE_LEVEL is a qualitative metric that assesses your store’s quality based on various factors, categorized as HIGH, MEDIUM, or LOW. It directly reflects the overall appeal and effectiveness of your store’s design and content. DWELL measures customers' average time in your store, offering insights into engagement and interest.

Amazon will also provide a collection of other recommendations to improve the score;

  • Add best selling products or recommended products tile to a subpage can improve the score by 0.4473
  • Add a background video to reinforce your brand message or showcase a product can improve the score by 0.4011

Get Started Automating Amazon Brand Store Performance Data — For Free.

The Amazon Brand Store Insights data offers a goldmine of opportunities for data analysis, which can be leveraged by Amazon Sellers and Vendors to refine their strategies, enhance product visibility, and ultimately drive sales.

Sign up for a 30-day free trial and request access to our Amazon Brand Store Performance Data beta.


Optimizing Amazon Brand Store Performance was originally published in Openbridge on Medium, where people are continuing the conversation by highlighting and responding to this story.


from Openbridge - Medium https://ift.tt/AalCcro
via IFTTT

Optimizing Amazon Brand Store Performance

Using insights to fuel Amazon Brand Store best practices, growth, and scale

Amazon now offers extensive performance insights for brand stores that provide metrics on your customer experience and products and recommendations on improving visibility.

These brand store insights are now available via Amazon APIs, which allows fast, automated access to data that allows your team new pathways to analyze, visualize, and optimize your customer experience investments.

Why Amazon Brand Stores? Enhancing Brand Visibility On Amazon

Amazon Stores allow you to showcase your brand and products in a multipage, immersive shopping experience. Amazon Brand Store enhances brand visibility and differentiation in a crowded marketplace, allowing sellers and vendors to showcase their products, tell their brand story, and engage customers with rich media content such as images and videos. This helps build brand loyalty and awareness and drives sales by providing a centralized location for customers to browse and purchase products directly from the brand.

Building Brand Affinity: Amazon Brand Stores Deliver Results

No matter the size of your brand, Amazon Stores gives you an immersive place to introduce audiences to your story, mission, and products.

Per Amazon, Brand stores have a direct impact on performance:

+83% higher dwell time. Stores with 3+ pages have 83% higher shopper dwell time and 32% higher attributed sales per visitor.
+35% higher attributed sales per visitor. On average, Stores updated within the past 90 days have 21% more repeat visitors and 35% higher attributed sales per visitor.

Brand Stores offer valuable insights into customer behavior and preferences through analytics, enabling brands to optimize their marketing strategies and product offerings.

Amazon Brand Store Examples: Analytics Insights

So, what type of data is available via API? There are three primary groups of store performance metrics;

  • Brand Performance
  • Product-level ASIN Performance
  • Quality and Recommendations

Brand Performance Metrics

All the available insight metrics for evaluating Brand Store performance on Amazon:

  • VIEWS: Number of page views.
  • ORDERS: Estimated total orders placed by Store visitors within 14 days of their visit. Orders contain one or more units sold.
  • UNITS: Estimated units purchased by Store visitors within 14 days of their last visit.
  • SALES: Estimated total sales generated by Store visitors within 14 days of their last visit.
  • VISITS: Total visits to a page within a single day. Each visitor can visit more than one page and your Store from multiple traffic sources.
  • VISITORS: Total visitors to your Store within the selected date range, calculated based on daily unique users or devices.
  • SCORE_LEVEL: Store Quality rating calculated on various factors defining the quality of a store. It can be HIGH, MEDIUM, or LOW.
  • RECOMMENDATIONS: An array of objects containing two fields: recommended action (e.g., “Add a video”) and observed average well time increase (the improvement it would bring in the overall store quality).
  • CONTRIBUTORS: An array of recommendations applied by the Store Owner improves overall store quality.
  • DWELL: Average time a customer spends in the store, specifically for store quality measurement.
  • PEER_DWELL: Average time a customer spends on other similar (peer) stores.
  • DWELL_TIME: Average time a customer spends in the store, providing insights into user engagement by calculating the average duration of visits.
  • BOUNCE_RATE: Ratio of total bounce visits (customers who landed at the store and left quickly without engaging) to total landing visits, providing insights into visitor engagement.
  • NEW_TO_STORE: Total count of unique visitors new to the store, providing valuable insights into the number of first-time shoppers.

Product-level ASIN Performance Metrics

Beyond store-wide metrics, Amazon also offers ASIN-specific data, allowing brands to drill down into the performance of individual products within their store. These metrics include views, orders, units, add-to-carts, and others, providing a granular view of how products perform and interact with potential customers.

  • VIEWS: Number of times a customer viewed an ASIN. It can happen once per page visit.
  • ORDERS: Estimated total orders placed by Store visitors on the day of the ASIN view. Orders can have one or more total units.
  • UNITS: Estimated units purchased by Store visitors during attributed orders for the ASIN.
  • ADDTOCARTS: Total number of times an ASIN was added to a cart by a customer on a store page.
  • IN_STOCK_VIEWS: Total views of an ASIN on a store page while the ASIN was in stock. For ASINs with variations, the customer must have selected a variation in stock to be counted.
  • AVERAGE_IN_STOCK_PRICE: Average price in local currency the ASIN was viewed at by customers while it was in stock.
  • IN_STOCK_RATE: Rate at which customers viewed an ASIN while it was in stock.
  • AVERAGE_SALE_PRICE: Average price in local currency for which the ASIN is sold during the order.
  • CONVERSION_RATE: Rate at which customers ordered a unit of the item over how many times customers clicked the item.
  • CLICKS: Count how often a customer clicks an ASIN-related widget on the store page.
  • CLICK_RATE: Rate at which the ASIN was clicked per view. This ratio can be above one if the widget interacts with a widget with engaging features.
  • RENDERS: Number of times the ASIN is rendered on a store page. Note — this does not guarantee that the customer saw the ASIN.
  • TOTAL_VIEWS: Total number of times customers viewed ASINs on the store’s pages. A view can happen once per store page visit.
  • TOTAL_CLICKS: Total count of times a customer clicked an ASIN-related widget on the store’s pages.

Quality and Recommendations Metrics

Amazon’s quality and recommendations metrics are particularly noteworthy. They focus on your Brand Store’s average dwell time, compare your performance to peer groups, and rate your store’s quality.

High ratings indicate effective engagement strategies, and Amazon uses these ratings to suggest specific actions further to improve your store’s performance and customer dwell time.

For example, Amazon will provide a score and ranking for your store

  • SCORE_LEVEL: High
  • DWELL: 77.93

The SCORE_LEVEL is a qualitative metric that assesses your store’s quality based on various factors, categorized as HIGH, MEDIUM, or LOW. It directly reflects the overall appeal and effectiveness of your store’s design and content. DWELL measures customers' average time in your store, offering insights into engagement and interest.

Amazon will also provide a collection of other recommendations to improve the score;

  • Add best selling products or recommended products tile to a subpage can improve the score by 0.4473
  • Add a background video to reinforce your brand message or showcase a product can improve the score by 0.4011

Get Started Automating Amazon Brand Store Performance Data — For Free.

The Amazon Brand Store Insights data offers a goldmine of opportunities for data analysis, which can be leveraged by Amazon Sellers and Vendors to refine their strategies, enhance product visibility, and ultimately drive sales.

Sign up for a 30-day free trial and request access to our Amazon Brand Store Performance Data beta.


Optimizing Amazon Brand Store Performance was originally published in Openbridge on Medium, where people are continuing the conversation by highlighting and responding to this story.


from Openbridge - Medium https://ift.tt/J3ko025
via Openbridge

Private Amazon Catalog Keyword Tracker

The best Amazon keyword tracker is the one you own, fueled by data from Amazon’s API

You can now access keyword-level catalog data directly from Amazon APIs delivered to a private, trusted cloud warehouse or data lake you own. Choose industry leaders like Amazon Redshift, Google BigQuery, Snowflake, Databricks, Azure Data Lake, and Amazon Athena to store your data privately.

How Does The Amazon Catalog Keyword Tracker Work?

Unlike most keyword trackers, the data is direct from Amazon’s API. This means Amazon will tell you how it aligns the keyword you supplied to its catalog. This is Amazon saying, “This is how our system maps our catalog of products to a keyword.”

As a result, the keyword-to-product catalog offers authoritative linkages directly from Amazon about how a keyword aligns with its systems.

Amazon Catalog API vs Screenscraping

When comparing data sourced directly from Amazon APIs to data obtained through paths, typically screen scraping bots, several key differences emerge, impacting trustworthiness, usability, and strategic value.

Here’s a breakdown of these differences:

  • Authoritative: Data sourced directly from Amazon’s APIs is typically more accurate and reliable because it is provided by the platform. The APIs are designed to give developers, sellers, and vendors access to the most current and precise information about products, sales, and customer interactions.
  • Documented: The data provided through APIs is structured, well-documented, and designed for integration with existing systems and applications. Sellers and vendors have clear guidelines for interpreting and using the data. There is no mystery about how the data is sourced or the context of how it can be used.

For sellers and vendors prioritizing strategic decision-making based on reliable, compliant, and actionable insights, data from Amazon’s APIs represents a superior choice. It ensures adherence to legal and platform guidelines and provides a foundation for making informed decisions that can enhance competitive positioning and operational efficiency, given you know how the data is sourced and packaged.

Types Of Amazon Catalog Keyword Data Analysis

With data in hand, here are three types of data analysis that can be particularly impactful, along with reasons why sellers and vendors should care:

1. Keyword Optimization and Product Visibility Analysis

  • Description: By examining the relationship between products and their associated keywords, especially in the summaries and sales rank files, sellers can identify which keywords drive visibility and sales. Analysis can include identifying high-performing keywords, understanding keyword search frequency, and correlating specific keywords with sales performance.
  • Why It Matters: Keywords are the bridge between customers and products. Optimizing product listings with the right keywords can significantly enhance visibility, making products more likely to be discovered by potential buyers. This analysis can reveal gaps in keyword strategies, highlight opportunities to target less competitive keywords, and refine product titles, descriptions, and backend search terms for better search alignment.

2. Competitive Analysis and Market Positioning

  • Description: Utilizing vendor details, sales ranks, and product type data, vendors can conduct a thorough competitive analysis. This involves assessing which products (and, by extension, which sellers/vendors) dominate specific keyword categories, understanding the competitive landscape for various product types, and evaluating how competitors’ products are ranked and reviewed.
  • Why It Matters: In a marketplace as crowded as Amazon, understanding your competition is key to carving out a niche or maintaining a competitive edge. This analysis can inform sellers and vendors about where they stand with their competitors, identify high-demand but low-competition niches, and help strategize pricing, promotions, and product development to capture more market share.

3. Customer Preference and Trend Analysis

  • Description: By analyzing product summaries, including average ratings, review counts, and dimensions, along with sales rank data, sellers can gauge customer preferences and emerging trends. This analysis can reveal what product features or attributes (e.g., size, type, utility) customers favor and how these preferences change over time.
  • Why It Matters: Staying ahead or quickly adapting to customer preferences and trends is crucial for long-term success. Sellers and vendors can use this analysis to make informed decisions about product assortment adjustments, design improvements, and inventory management. Understanding customer preferences can also guide marketing strategies, allowing sellers to highlight product features most appealing to their target market.

For Amazon Sellers and Vendors, leveraging Amazon Product Catalog Keyword Tracker data for these analyses can provide insights to optimize listings, understand competitive dynamics, and align products with customer preferences.

This strategic approach enhances product discoverability and sales potential and helps make informed decisions regarding product development, marketing strategies, and inventory planning.

Get Started Automating Amazon Catalog Keyword Tracker Data — For Free.

The Amazon Catalog Keyword Tracker data offers a goldmine of opportunities for data analysis, which can be leveraged by Amazon Sellers and Vendors to refine their strategies, enhance product visibility, and ultimately drive sales.

Take control and own your keyword data. Ditch the bots and screen scrapers for code-free automation access to Amazon API product keyword data. Openbridge integration is a code-free, fully automated API integration.

Sign up for a 30-day free trial of our Amazon Catalog Keyword Tracker code-free automation.

References

Amazon Catalog Keyword Tracker | Openbridge Help Center


Private Amazon Catalog Keyword Tracker was originally published in Openbridge on Medium, where people are continuing the conversation by highlighting and responding to this story.


from Openbridge - Medium https://ift.tt/7YgNC15
via IFTTT

Private Amazon Catalog Keyword Tracker

The best Amazon keyword tracker is the one you own, fueled by data from Amazon’s API

You can now access keyword-level catalog data directly from Amazon APIs delivered to a private, trusted cloud warehouse or data lake you own. Choose industry leaders like Amazon Redshift, Google BigQuery, Snowflake, Databricks, Azure Data Lake, and Amazon Athena to store your data privately.

How Does The Amazon Catalog Keyword Tracker Work?

Unlike most keyword trackers, the data is direct from Amazon’s API. This means Amazon will tell you how it aligns the keyword you supplied to its catalog. This is Amazon saying, “This is how our system maps our catalog of products to a keyword.”

As a result, the keyword-to-product catalog offers authoritative linkages directly from Amazon about how a keyword aligns with its systems.

Amazon Catalog API vs Screenscraping

When comparing data sourced directly from Amazon APIs to data obtained through paths, typically screen scraping bots, several key differences emerge, impacting trustworthiness, usability, and strategic value.

Here’s a breakdown of these differences:

  • Authoritative: Data sourced directly from Amazon’s APIs is typically more accurate and reliable because it is provided by the platform. The APIs are designed to give developers, sellers, and vendors access to the most current and precise information about products, sales, and customer interactions.
  • Documented: The data provided through APIs is structured, well-documented, and designed for integration with existing systems and applications. Sellers and vendors have clear guidelines for interpreting and using the data. There is no mystery about how the data is sourced or the context of how it can be used.

For sellers and vendors prioritizing strategic decision-making based on reliable, compliant, and actionable insights, data from Amazon’s APIs represents a superior choice. It ensures adherence to legal and platform guidelines and provides a foundation for making informed decisions that can enhance competitive positioning and operational efficiency, given you know how the data is sourced and packaged.

Types Of Amazon Catalog Keyword Data Analysis

With data in hand, here are three types of data analysis that can be particularly impactful, along with reasons why sellers and vendors should care:

1. Keyword Optimization and Product Visibility Analysis

  • Description: By examining the relationship between products and their associated keywords, especially in the summaries and sales rank files, sellers can identify which keywords drive visibility and sales. Analysis can include identifying high-performing keywords, understanding keyword search frequency, and correlating specific keywords with sales performance.
  • Why It Matters: Keywords are the bridge between customers and products. Optimizing product listings with the right keywords can significantly enhance visibility, making products more likely to be discovered by potential buyers. This analysis can reveal gaps in keyword strategies, highlight opportunities to target less competitive keywords, and refine product titles, descriptions, and backend search terms for better search alignment.

2. Competitive Analysis and Market Positioning

  • Description: Utilizing vendor details, sales ranks, and product type data, vendors can conduct a thorough competitive analysis. This involves assessing which products (and, by extension, which sellers/vendors) dominate specific keyword categories, understanding the competitive landscape for various product types, and evaluating how competitors’ products are ranked and reviewed.
  • Why It Matters: In a marketplace as crowded as Amazon, understanding your competition is key to carving out a niche or maintaining a competitive edge. This analysis can inform sellers and vendors about where they stand with their competitors, identify high-demand but low-competition niches, and help strategize pricing, promotions, and product development to capture more market share.

3. Customer Preference and Trend Analysis

  • Description: By analyzing product summaries, including average ratings, review counts, and dimensions, along with sales rank data, sellers can gauge customer preferences and emerging trends. This analysis can reveal what product features or attributes (e.g., size, type, utility) customers favor and how these preferences change over time.
  • Why It Matters: Staying ahead or quickly adapting to customer preferences and trends is crucial for long-term success. Sellers and vendors can use this analysis to make informed decisions about product assortment adjustments, design improvements, and inventory management. Understanding customer preferences can also guide marketing strategies, allowing sellers to highlight product features most appealing to their target market.

For Amazon Sellers and Vendors, leveraging Amazon Product Catalog Keyword Tracker data for these analyses can provide insights to optimize listings, understand competitive dynamics, and align products with customer preferences.

This strategic approach enhances product discoverability and sales potential and helps make informed decisions regarding product development, marketing strategies, and inventory planning.

Get Started Automating Amazon Catalog Keyword Tracker Data — For Free.

The Amazon Catalog Keyword Tracker data offers a goldmine of opportunities for data analysis, which can be leveraged by Amazon Sellers and Vendors to refine their strategies, enhance product visibility, and ultimately drive sales.

Take control and own your keyword data. Ditch the bots and screen scrapers for code-free automation access to Amazon API product keyword data. Openbridge integration is a code-free, fully automated API integration.

Sign up for a 30-day free trial of our Amazon Catalog Keyword Tracker code-free automation.

References

Amazon Catalog Keyword Tracker | Openbridge Help Center


Private Amazon Catalog Keyword Tracker was originally published in Openbridge on Medium, where people are continuing the conversation by highlighting and responding to this story.


from Openbridge - Medium https://ift.tt/JEIseMj
via Openbridge

Own Your Amazon Price Tracker Data

The best Amazon price tracker is the one you own

You can now directly access ASIN-level product tracker data directly from Amazon APIs. Unlike other product pricing tracking tools, Openbridge delivers product pricing data directly to a private cloud warehouse or data lake like Amazon Redshift, Google BigQuery, Snowflake, Databricks, Azure Data Lake, and Amazon Athena. You own the data.

There are no bots or screen scraping. Direct from Amazon’s API, pricing data unlocks new opportunities for your efforts with competitive intelligence, sales rank tracking, buy box insights, and more.

Direct, Authoritative Amazon Product Pricing Data

This rich, extensive ASIN-level product data comes directly from Amazon to your private cloud warehouse or data lake every hour. Here is a collection of key data elements included in the feeds:

  1. ASIN & Seller ID: Identifies the product and the seller.
  2. Lowest Prices: Includes details about the lowest prices for different conditions and fulfillment channels.
  3. Sales Rank: Provides the sales ranking of the product in specific categories.
  4. Price Details: Includes listing price, shipping cost, and points value.
  5. Item Condition: Indicates the condition of the items (e.g., New, Used, Collectible).
  6. Total Offer Count: The number of total offers available for the ASIN.
  7. Number of Offers by Condition and Fulfillment Channel: Breakdown of offers based on their condition (e.g., New, Used) and fulfillment channel.
  8. Buy Box Winner & Featured Merchant: Indicates if the seller is a Buy Box winner or a featured merchant.
  9. Buy Box Prices: Details of prices for Buy Box eligible offers.
  10. Buy Box Eligible Offers: Information about offers eligible for the Buy Box is critical as the Buy Box winner is often the default choice for customers.
  11. Ships From: Location details from where the product is shipped.
  12. Fulfillment by Amazon (FBA): Indicates whether Amazon fulfills the order.
  13. Prime Information: Whether the offer is prime eligible and its type.
  14. Seller Feedback Rating and Counts: This represents the percentage of positive feedback and the total number of feedback entries received by the seller.

Custom, Owned Amazon Product Pricing Tracker

Our code-free, automated, and unified delivery of product pricing data enables teams to utilize their preferred analytical tools, such as Google Data Studio, Tableau, Microsoft Power BI, Looker, or Amazon Quicksight, for various purposes, including machine learning, business intelligence, data modeling, and online analytical processing.

Power BI Amazon product pricing tracking chart

Here are all the different types of analysis you can undertake with direct access to product pricing data:

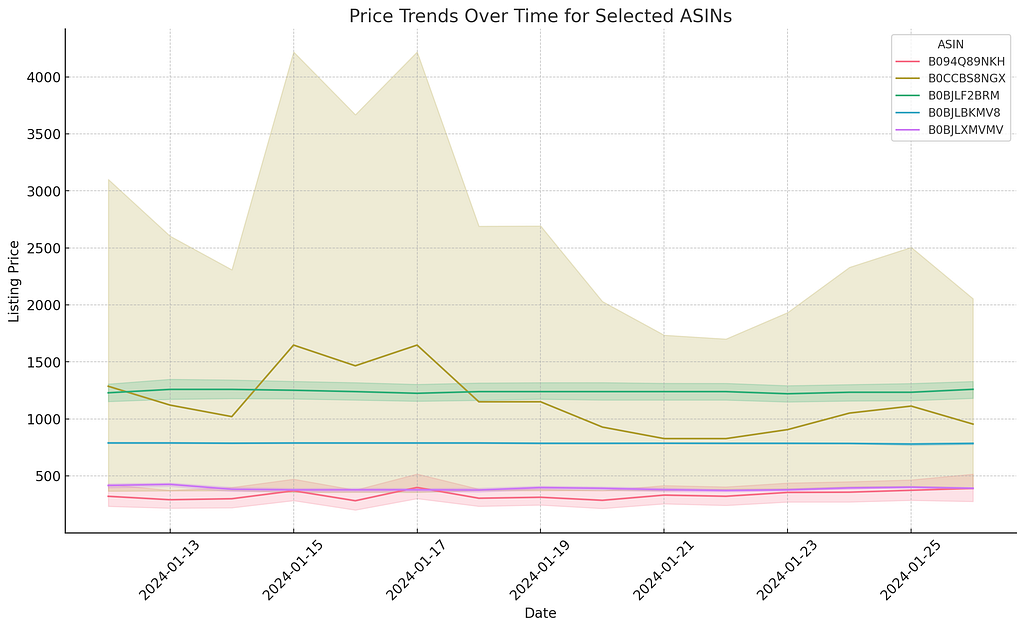
  1. Price Analysis Over Time: Analyze how prices of products change over time. This can be done by tracking the price history of specific ASINs (Amazon Standard Identification Numbers) and identifying patterns or trends.
  2. Competitive Analysis: Compare prices and conditions (new, used, etc.) different sellers offer for the same products. This helps in understanding Amazon's competitive landscape for various products.
  3. Seller Performance Analysis: Evaluate sellers’ performance based on metrics like number of sales, the buying box winner frequency, and fulfillment method (Fulfilled by Amazon or not). This can help identify top-performing sellers in each category.
  4. Product Condition Impact: Investigate how the condition of a product (new, used, refurbished, etc.) affects its price and saleability.
  5. Fulfillment Method Analysis: Compare the performance of products fulfilled by Amazon versus those fulfilled by sellers directly in terms of sales volume, customer preference (Prime eligibility), and pricing.
  6. Time Series Forecasting: Use historical data to forecast future price trends, sales, or demand for certain products or categories.
  7. Geographical Analysis: If location data is available, analyze geographical trends in pricing and sales. Understand which products are popular in specific regions.
  8. Customer Review Impact: If linked with customer review data, analyze how ratings and reviews impact the sales and pricing of products.
  9. Inventory Management Insights: For sellers, understanding how inventory levels relate to prices and sales can help in efficient inventory management.
  10. Market Gap Analysis: Identify potential market gaps by analyzing products with high demand but low competition or where current offerings are not meeting customer satisfaction.

Get Started Automating Amazon Product Pricing API Data— For Free.

Take control and own your data. Ditch the bots and screen scrapers for code-free automation access to Amazon API product pricing data. Openbridge integration is a code-free, fully automated API integration.

Sign up for a 30-day free trial of our Amazon Product Pricing Data code-free automation.


Own Your Amazon Price Tracker Data was originally published in Openbridge on Medium, where people are continuing the conversation by highlighting and responding to this story.


from Openbridge - Medium https://ift.tt/KN6fXcD
via IFTTT

Own Your Amazon Price Tracker Data

The best Amazon price tracker is the one you own

You can now directly access ASIN-level product tracker data directly from Amazon APIs. Unlike other product pricing tracking tools, Openbridge delivers product pricing data directly to a private cloud warehouse or data lake like Amazon Redshift, Google BigQuery, Snowflake, Databricks, Azure Data Lake, and Amazon Athena. You own the data.

There are no bots or screen scraping. Direct from Amazon’s API, pricing data unlocks new opportunities for your efforts with competitive intelligence, sales rank tracking, buy box insights, and more.

Direct, Authoritative Amazon Product Pricing Data

This rich, extensive ASIN-level product data comes directly from Amazon to your private cloud warehouse or data lake every hour. Here is a collection of key data elements included in the feeds:

  1. ASIN & Seller ID: Identifies the product and the seller.
  2. Lowest Prices: Includes details about the lowest prices for different conditions and fulfillment channels.
  3. Sales Rank: Provides the sales ranking of the product in specific categories.
  4. Price Details: Includes listing price, shipping cost, and points value.
  5. Item Condition: Indicates the condition of the items (e.g., New, Used, Collectible).
  6. Total Offer Count: The number of total offers available for the ASIN.
  7. Number of Offers by Condition and Fulfillment Channel: Breakdown of offers based on their condition (e.g., New, Used) and fulfillment channel.
  8. Buy Box Winner & Featured Merchant: Indicates if the seller is a Buy Box winner or a featured merchant.
  9. Buy Box Prices: Details of prices for Buy Box eligible offers.
  10. Buy Box Eligible Offers: Information about offers eligible for the Buy Box is critical as the Buy Box winner is often the default choice for customers.
  11. Ships From: Location details from where the product is shipped.
  12. Fulfillment by Amazon (FBA): Indicates whether Amazon fulfills the order.
  13. Prime Information: Whether the offer is prime eligible and its type.
  14. Seller Feedback Rating and Counts: This represents the percentage of positive feedback and the total number of feedback entries received by the seller.

Custom, Owned Amazon Product Pricing Tracker

Our code-free, automated, and unified delivery of product pricing data enables teams to utilize their preferred analytical tools, such as Google Data Studio, Tableau, Microsoft Power BI, Looker, or Amazon Quicksight, for various purposes, including machine learning, business intelligence, data modeling, and online analytical processing.

Power BI Amazon product pricing tracking chart

Here are all the different types of analysis you can undertake with direct access to product pricing data:

  1. Price Analysis Over Time: Analyze how prices of products change over time. This can be done by tracking the price history of specific ASINs (Amazon Standard Identification Numbers) and identifying patterns or trends.
  2. Competitive Analysis: Compare prices and conditions (new, used, etc.) different sellers offer for the same products. This helps in understanding Amazon's competitive landscape for various products.
  3. Seller Performance Analysis: Evaluate sellers’ performance based on metrics like number of sales, the buying box winner frequency, and fulfillment method (Fulfilled by Amazon or not). This can help identify top-performing sellers in each category.
  4. Product Condition Impact: Investigate how the condition of a product (new, used, refurbished, etc.) affects its price and saleability.
  5. Fulfillment Method Analysis: Compare the performance of products fulfilled by Amazon versus those fulfilled by sellers directly in terms of sales volume, customer preference (Prime eligibility), and pricing.
  6. Time Series Forecasting: Use historical data to forecast future price trends, sales, or demand for certain products or categories.
  7. Geographical Analysis: If location data is available, analyze geographical trends in pricing and sales. Understand which products are popular in specific regions.
  8. Customer Review Impact: If linked with customer review data, analyze how ratings and reviews impact the sales and pricing of products.
  9. Inventory Management Insights: For sellers, understanding how inventory levels relate to prices and sales can help in efficient inventory management.
  10. Market Gap Analysis: Identify potential market gaps by analyzing products with high demand but low competition or where current offerings are not meeting customer satisfaction.

Get Started Automating Amazon Product Pricing API Data— For Free.

Take control and own your data. Ditch the bots and screen scrapers for code-free automation access to Amazon API product pricing data. Openbridge integration is a code-free, fully automated API integration.

Sign up for a 30-day free trial of our Amazon Product Pricing Data code-free automation.


Own Your Amazon Price Tracker Data was originally published in Openbridge on Medium, where people are continuing the conversation by highlighting and responding to this story.


from Openbridge - Medium https://ift.tt/TPEYMvg
via Openbridge

Amazon Vendor Central Traffic Report Insights

Data-driven customer engagement and sales growth with Vendor Central Traffic analysis

Traffic reports for Amazon Vendor Central contain valuable information for understanding customer interest and demand for various products.

Here is how Amazon describes the Vendor Central Traffic Report;

Quickly identify changes in relevant traffic-related metrics

That description does not do the report justice! Let’s dig in and help Amazon out. ðŸ˜Š

What Is The Vendor Central Traffic Report?

The Traffic Report analyses the views your ASINs get on Amazon. The key metric in the report is “Glance Views,” which are the number of views the product detail page receives from our customers on the Amazon website.

The report allows vendors to analyze trends, which allows you to identify high and low-traffic products. You can then optimize activities such as running Amazon Ads, supporting marketing activities like targeted emails to increase traffic, or setting up promotions to convert high views to more sales.

Vendor Central Real-Time Traffic Data? Yes!

Unlike traditional Traffic Reports, Amazon released Rapid Retail Analytics, an hourly stream of real-time traffic, sales, and inventory data. The real-time data offers unparalleled access to ASIN-level to generate insights into customer activity on Amazon.

Amazon Rapid Retail Analytics: New API for Real-time Metrics

What are the benefits of the Amazon Vendor Central Traffic Reports?

The data is focused on providing insights into customer traffic (measured through glance views) for a specific set of products under the brand in the specific Amazon marketplaces. The data can be used for product visibility analysis, customer interest, and potential areas for marketing and sales strategy optimization.

Since the Traffic Report focuses on trends at an ASIN level, it allows vendors to assess traffic levels, seasonal variations, and brand/product performance. Vendors can link the Traffic Report data to other ASIN-specific data sets like Vendor Sales, Inventory, or Amazon Advertising reports like the Sponsored Products Advertised product report or Sponsored Brands Attributed Purchases report.

The following are typical analytics use cases:

  • Traffic Measurement: These reports track customer traffic to product pages (glance views or GVs).
  • Performance Analysis: They help in understanding how different factors contribute to traffic and, subsequently, to sales performance.
  • Identifying Opportunities: By analyzing traffic data, vendors can identify trends, opportunities for improvement, and strategies that are working.
  • Strategic Insights: Vendors can refine their marketing and sales strategies by analyzing traffic data.
  • Operational Adjustments: The insights can lead to adjustments in inventory, pricing, and promotions.
  • Benchmarking and Trend Analysis: Vendors can benchmark their performance against past data or industry standards and spot trends.

What Data Is Included In The Vendor Central Forecasting Report?

The Traffic Report you’ve provided contains the following columns, based on the first few rows:

  1. Distributor View: This column lists the ASIN (Amazon Standard Identification Number), which uniquely identifies each product listed on Amazon.
  2. View By [ASIN]: This column provides the product title, clearly identifying each product associated with the ASIN.
  3. Countries: This indicates the country for which the traffic data is applicable.
  4. Businesses: This column represents the business unit or the specific brand under which the products are listed.
  5. Locale: Account locale.
  6. Glance Views: This is a crucial metric, showing the number of views each product detail page received. It’s vital for analyzing customer interest and traffic.

Using Traffic Reports With Amazon Advertising Reports

As a stand-alone data set, Traffic reports offer vital insights to vendors. However, pairing Traffic reports with other ASIN-level data sets starts to expand insights opportunities.

For example, you can join your Traffic Report with the Amazon Ads Sponsored Products Advertised product report. You can use the ‘Advertised ASIN’ from the Advertising Report and the ‘ASIN’ from the Traffic Report as the keys to join.

You can enhance your visibility in performance drivers with these two data sets. Here are a few examples;

  • Effectiveness of Advertising Campaigns: Assess how advertising impacts glance views and sales.
  • Conversion Analysis: Compare impressions and clicks from the Advertising Report with glance views and sales data to calculate and understand conversion rates.
  • Cost-Benefit Analysis: Analyze the ACOS and ROAS about traffic and sales to understand the financial efficiency of advertising campaigns.
  • Product-Level Insights: Determine which products perform well in organic and paid channels.
  • Temporal Trends: Evaluate how advertising campaigns affect traffic and sales over specific periods.:
  • Correlation Analysis: Examine the relationship between advertising metrics (like clicks and impressions) and traffic/sales metrics.
  • ROI Analysis: Compare advertising spending against the increase in sales or glance views.
  • Segmentation and Pattern Recognition: Identify which types of products, campaigns, channels, or periods are most effective.

While our example focused on traffic reports + sponsored products and advertised product reports, you can extend this further to include other ad reports for sponsored display, sponsored brand, or sponsored product reports. Why stop there? Extend the analysis further with off-Amazon data sets like ASIN-level promotional emails, social media posts, or third-party ad platforms like Google Ads or Facebook.

For a deep dive into more examples, see our post about how to harness the power of your Amazon data:

Unleashing Business Insights With Amazon Rapid Retail Analytics

How To Access Vendor Central Traffic Reports?

Vendors have two primary paths to access reports: manual downloads or API automation.

Manual downloading occurs in your Vendor Central account interface. Automation taps into the Amazon Selling Partner API (Amazon SP-API) to automate report processing and storage in a cloud warehouse or data lake (see the Amazon docs here).

Manual Access via Vendor Central:

  1. Login: First, sellers must log into their Amazon Vendor Central account.
  2. Navigate to Reports: Usually found in the main navigation bar, this section contains various sales, inventory, and performance reports.
  3. Locate the ‘Traffic’ Within the Reports section.
  4. Select Date Range: Amazon allows sellers to pull reports based on specific dates. Choose the desired range.
  5. Download: Once the report has been generated, there will typically be an option to download it. The report is often available in different formats .csv or .xls.

Note: Manual downloads are more time-consuming and may not be ideal for frequent and up-to-date data analytics.

Automating Vendor Central Data:

The Amazon Selling Partner API (SP-API) allows for direct, automated access to Amazon forecasting data, making it easier for businesses to integrate it into their systems. Openbridge allows Amazon Vendors to save time manually downloading reports, increasing data velocity and reducing errors in messy merging and tracking downloaded reports.

Unlock Effortless Traffic Insights With Our Code-Free Amazon Integration

Are you struggling with complex, messy traffic report data management for Vendor Central? Say goodbye to the hassle. Openbridge offers a seamless, automated solution that unifies your data into a private, trusted data warehouse or data lake like Amazon Redshift, Databricks, Google BigQuery, and more — all without a single line of code.

Openbridge automation extends beyond inventory to a broad collection of Amazon and non-Amazon data sources;

Automate And Unify Your Vendor Central Data — Free For 30 Days

Start your journey towards data-driven growth and profit with Openbridge. Our code-free, fully automated Selling Partner API integration simplifies your Amazon Vendor Central operations.

Ready to harness the power of your Amazon traffic data?

Sign Up Now for Your Free 30-day Trial For Vendor Central Traffic Report Automation.


Amazon Vendor Central Traffic Report Insights was originally published in Openbridge on Medium, where people are continuing the conversation by highlighting and responding to this story.


from Openbridge - Medium https://ift.tt/KG0CLSF
via IFTTT