How to use Looker Studio with code-free, ready-to-go data automation for Amazon Sellers
Google announced that it is rebranding its cloud BI product, Data Studio, into Looker Studio. This change will allow companies to quickly build custom dashboards and reports without having to learn a new tool. In addition, Google says that the look and feel of the dashboard will remain unchanged.
What is Looker Studio?
Looker Studio is a free web-based reporting tool that allows you to create data visualizations, dashboards, and reports. It’s easy to use and can be accessed from any device with an internet connection. You can insert charts, tables, maps, and more into your sales or marketing dashboard. Once you have created your report, you can share it with others or publish it on the web so that all of your team members can see the latest changes.
Looker Studio is the perfect option for people that want to graduate from using Excel or Google Sheets without the additional cost of other business intelligence tools.
Looker and Amazon, Better Together
We are excited to announce Looker Studio, like Google Data Studio, can leverage our Amazon Seller Central (SP-API) partner connectors. The SP-API, formerly known as Amazon MWS, delivers a new type of seller tool that gives business and marketing teams new analytics capabilities.
Looker Studio paired with Amazon Seller Central data is a powerful combination for sellers who want to create a simple dashboard or in-depth comprehensive reports and visualizations.
As a data source, Amazon Seller Central offers a default dashboard that allows you to manage your products, inventory, and orders. The Seller dashboard offers up key metrics on units ordered, total sales, and others.
What if you want to do a different type of analysis, report, or visualization? While the default Seller Central UI is sufficient, leveraging your own reporting tools, like Looker Studio, allows you to undertake an in-depth analysis of organic sales, wasteful ad spending, and search history.
You can connect to data directly from Amazon Seller Central via API and use this data directly within Looker Studio. With this connection, you can create more comprehensive reports for yourself quickly and easily.
What Is Possible With Looker Studio + Seller Central?
For data-driven Amazon merchants, the Amazon Selling Partner API (SP-API) connector will supply key business Insights so you can measure the impact of retail operations. The SP-API connector allows direct, code-free access to daily or real-time Seller Central data through Looker Studio.
Openbridge offers a type of connector for various Seller services;
Amazon Inventory: Get FBA Inventory Reports data for the listing, condition, disposition, and quantity to help with day-to-day inventory.
Amazon Fulfillment: Get comprehensive, product-level detail on inbound shipments, shipped FBA orders, quantity, tracking, and shipping with FBA Fulfillment Reports and Inbound Fulfillment API.
Amazon Orders: Order and item information for both FBA and seller-fulfilled orders including order status, fulfillment and sales channel information, and item details with Order API, and FBA Orders Reports.
Detail Sales & Traffic: Business-level Sales and Traffic reports offer performance metrics for product sales, revenue, units ordered, and page traffic metrics such as page views and buy box.
Vendor Central: Manage retail business operations with automated integration so vendors can improve and maintain performance at scale while growing business.
Retail Analytics:Vendor Retail Analytics delivers ordered revenue, glance views, conversion, replenishable out-of-stock, lost buy box, returns, replacements, and many more.
Brand Analytics:Brand Analytics offers sellers and vendors market basket analysis, search terms, repeat purchases, alternate purchases, item comparisons, and much more.
Amazon Advertising + Looker Studio
Looker Studio is a powerful tool for business users and marketers to fuse retail sales data with Amazon Advertising data from the Amazon Demand-side Platform (Amazon DSP) and Amazon Attribution services.
Connect Shopify to Looker Studio
Connecting Looker Studio and Shopify is available with pre-built, ready-to-go connectors. See the Shopify connector for more details.
Looker Studio + Google BigQuery
Looker Studio works best when paired with a native connector to Google BigQuery.
If you don’t already have a Google Cloud account for this tool (and if not, I highly recommend signing up), doing so only takes a couple of minutes. Plus, we can offer an additional $200 in free credits!
The Google Cloud Platform Free Trial + additional credits from our partners provide you with hundreds of dollars to try the Cloud Platform. Whether you are building software or automobiles, looking to create the next big thing, or wanting to put your company on the same infrastructure that powers Google, Google Cloud Platform has the technology and the partners to help grow your business on our Cloud.
The process of connecting Looker Studio to BigQuery is simple and ready-built by Google. Now, you can use BigQuery and Looker Studio to create your own dashboards for Amazon Seller Central. This is a great way to make a dashboard in Looker Studio that is more flexible and powerful than the reporting UI that Amazon provides.
Looker Studio pricing
Looker Studio is free, though there is a Looker Studio Pro version that Google charges for. For more information on pricing for the Pro version, Google requires you to talk to a Cloud sales specialist.
Openbridge has developed the automated API connector code, which means there is nothing for your to program. We are official connector providers for Amazon Selling Partner and Amazon Advertising API. Openbridge is an Amazon Advertising Partner tools provider and is an approved PII data supplier for Seller Central.
Fuel financial forecasting, marketing analysis, sales reporting, and marketing optimization. Create a new custom dashboard, enhance an existing dashboard, or perform a breakdown of sales with Looker Studio.
When to use Databricks and what role should it play in a data lakehouse architecture
Not to oversimplify, but the “lakehouse” is marketing speak for the fusion of the data lake and cloud warehouse. The lakehouse concept is not new, though commercial labeling by companies like Databricks, Google, AWS, Microsoft, and others is.
In this post, we will cover the lakehouse model and how Databricks fits.
What is a lakehouse?
A data lakehouse should be defined as a modern data platform that draws on the best aspects of both a data lake and a data warehouse. The pairing of the storage of a data lake with the query services of a data warehouse is commonly referred to as a lakehouse.
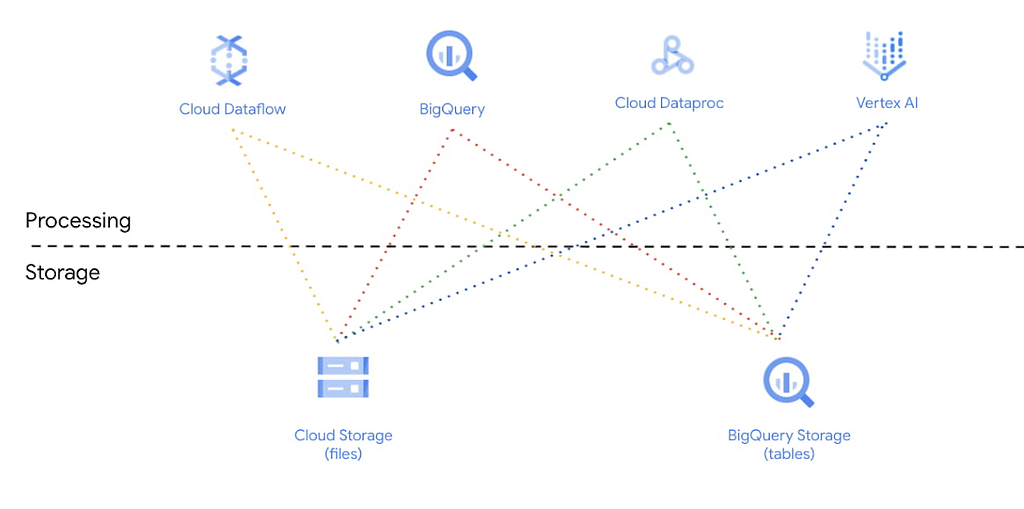
A well-abstracted, standards-based data architecture, by design, depends on loosely coupled services at all levels of the modern data stack. For example, traditional data warehouses tightly couples compute (ie query processing) and storage ( database, tables, views…). However, the lakehouse separation of those compute and storage can deliver efficiency, scalability, and flexibility.
Ideally, one would find a common approach to the advocacy of a modern data strategy that embraces a vendor-agnostic, well-abstracted, standards-based data architecture. While it sounds simple enough, it is not uncommon to see the exact opposite; architectures that are vendor-driven, tool specific, and tightly coupled.
As such, it can be challenging to sift through all the noise. For example, in our post Sorry, Data Lakes Are Not “Legacy” an idea advocated by Fivetran was that you should pick Snowflake and declare victory.
Lauren Balik highlighted the phenomenon in How Fivetran + dbt actually fail. Lauren details how vendors advocate “modern data stacks” that play into a pricing/revenue model, not one based on sound architecture and open, well-abstracted, and open services.
What is lakehouse architecture?
It is important to define the core principles of architecture and technical values. While focused on Facebook Presto, the folks at Ahana discussed the topic of well-abstracted, open data stacks in their post The SQL Data Lakehouse. As discussed by the team Ahana Cloud, the arguments about a Databricks lakehouse vs Snowflake data mesh are unfortunately more marketing one-upmanship than one of the technical merits.
For example, Amazon Athena is a serverless query engine that has no local storage. Storage is the domain of the data lake, which Athena can query. This allows query and storage to scale horizontally.
While Athena, which is based on Facebook Presto, was designed to support this type of local de-coupling of processing and storage, it is by no means the only player. The pattern is quickly becoming a staple, including traditional data warehouse vendors attempting to extend their core offerings to support this model. Ahana, Databricks, Redshift Spectrum, Snowflake, BigQuery, and a host of others support some level of decoupled storage and compute.
The lakehouse takes the scalable, persistent object storage of the data lake with the SQL, management features, data cataloging, and tools from data warehouses. As a result, the benefits of open, flexible standards in the face of constant technological advances offer welcomed agility and flexibility.
We define a Lakehouse as a data management system based on low-cost and directly-accessible storage that also provides traditional analytical DBMS management and performance features such as ACID transactions, data versioning, auditing, indexing, caching, and query optimization. Lakehouses thus combine the key benefits of data lakes and data warehouses: low-cost storage in an open format accessible by a variety of systems from the former, and powerful management and optimization features from the latter.
The paper concludes by advocating a modern data architecture that we have promoted (before it was dubbed a lakehouse). The lakehouse architecture that offers SQL and other processing compute services over a well-designed data lake, using open, standard-base file formats, provides flexibility, scale, and competitive price-performance concerns for query latency.
Optimizations, such as localized cache stores in tools like Tableau, can often alleviate query latency performance concerns due to the underlying storage model. As a matter of fact, most modern advanced analytics tools like Power BI, Looker, Tableau, and others embrace a relatively standard approach to optimizing performance via caching.
As we stated earlier, any modern data architecture, by design, must depend on a loosely coupled separation of compute and storage to deliver an efficient, scalable, and flexible solution.
Pentaho co-founder and CTO James Dixon, who coined the term “data lake”, said;
This situation is similar to the way that old school business intelligence and analytic applications were built. End users listed out the questions they want to ask of the data, the attributes necessary to answer those questions were skimmed from the data stream, and bulk loaded into a data mart. This method works fine until you have a new question to ask. The approach solves this problem. You store all of the data in a lake, populate data marts and your data warehouse to satisfy traditional needs, and enable ad-hoc query and reporting on the raw data in the lake for new questions.
A well-abstracted data lake architecture is an excellent foundation for any lakehouse. The benefits of open, flexible standards in the face of constant technological advances provide resistance to your data or analytics process. This includes extending your cloud data warehouses to query the content of your data lake. For example, you may have a use case where your data lake is extended for use by Snowflake or Databricks, or if Snowflake became cost-prohibitive, leverage Ahana or Athena.
As a result, a lakehouse Databricks, Ahana, Snowflake….solution must offer a unified approach for a data platform that can efficiently support business analysts’ analytics capabilities including the use of AWS Analytics with QuickSight, use of Power BI, Tableau, or other tools. So use one business intelligence tool, or any of them, data consumption is well-abstracted so each tool can perform queries against the same lakehouse.
AWS, Google, or Azure Databricks Cloud Data Lakehouse
A lakehouse is not limited to a single platform. Most major cloud platforms package lakehouse solutions. AWS, Google, and Azure all offer a variation of a lakehouse architecture based on their specific product offerings.
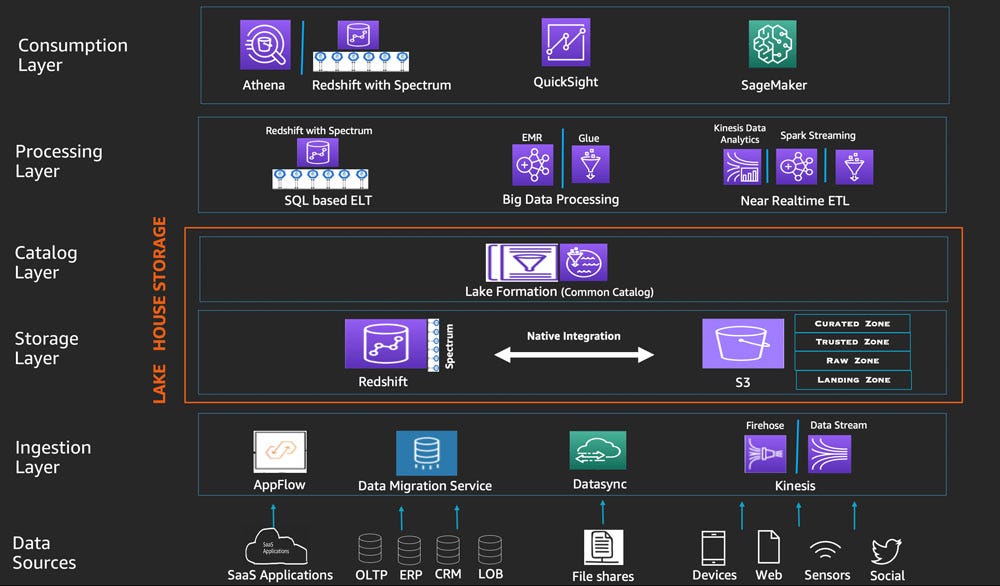
For example, the Amazon Web Services Lake House relies on Amazon Athena, Amazon S3, Kinesis, QuickSight, and many other services;
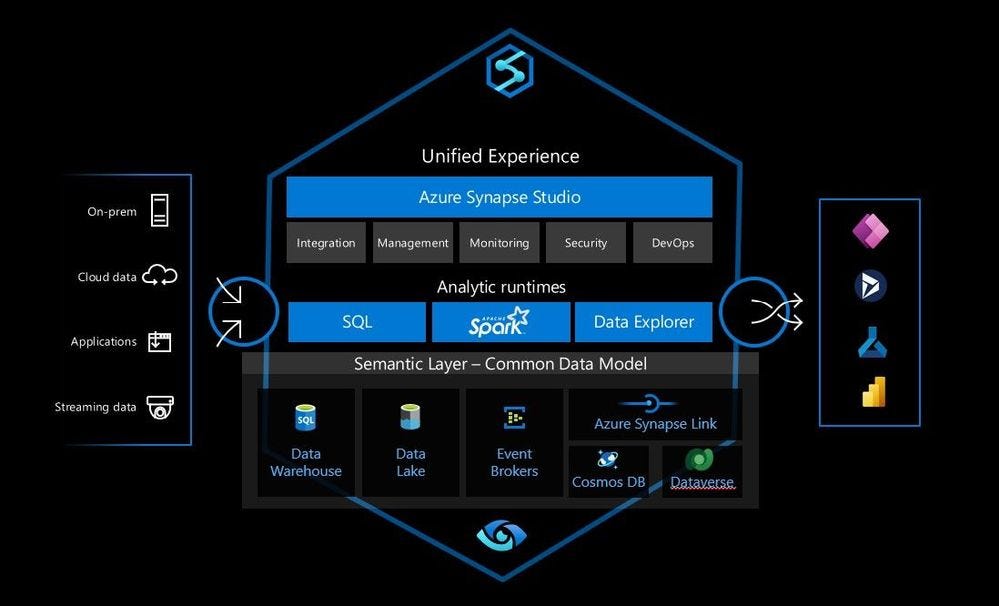
Microsoft also offers a lakehouse vision leveraging Azure services;
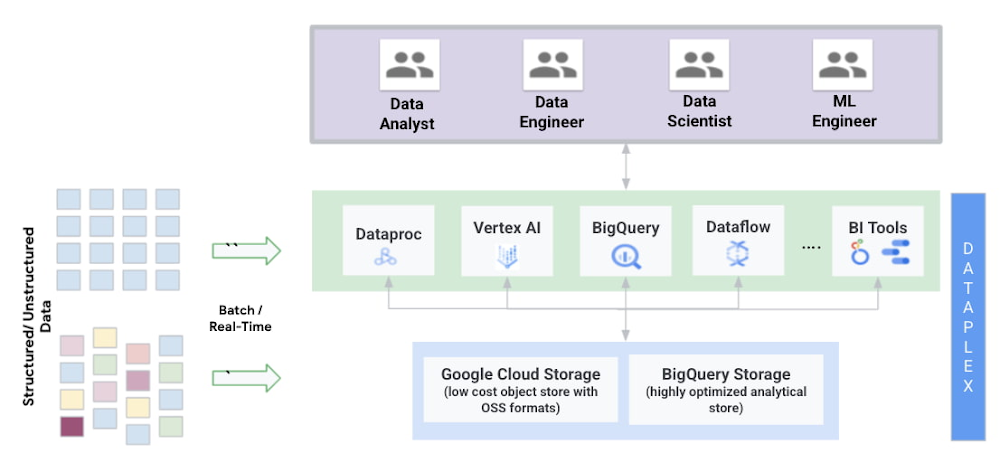
Google Cloud puts BigQuery at the core of its offering;
Google highlights the separation of compute and storage as central to its lakehouse data platform;
In the Google example and earlier example from AWS, they illustrate how Amazon Athena can just as easily consume data from a lake as Redshift, Databricks, or Presto.
In all the examples above the architecture rely on a well-abstracted data lake. We have written at length about the benefits of a data lake model as foundational elements of your overall data architecture. A data lake does not intrinsically carry any more technical debt than a warehouse. A data lake, done well, can help reduce the risk of incurring technical debt by properly abstracting aspects of your data architecture with best-in-class solutions. For example, a data lake can offer velocity and flexibility in employing different compute services, minimizing risks of vendor lock-in, and mitigating switching costs.
What is the Databricks Lakehouse?
The Databricks Lakehouse, done properly, should continue a pattern of a well-abstracted, unified approach we advocate for as a characteristic of a modern data platform.
The Databricks LakeHouse is typically offered as a cloud service that provides a platform for ingesting and analyzing data from multiple sources. This includes data ingestion of data objects residing in external locations Hadoop Distributed File System (HDFS), Apache Kafka, Amazon S3, Azure Data Lake Storage Gen2, Azure Blob Storage, and many others.
What is Databricks Lakehouse architecture?
The architecture of a Databricks lakehouse is similar to best practices and reference architectures we have detailed for Azure, Google, and AWS. For example, the AWS data lake uses serverless SQL query services like Amazon Athena and Amazon Redshift (Redshift Spectrum) to query the contents of your data lake.
As a result, a Databricks lakehouse should follow best practices, including embracing compute and storage abstractions and leveraging modern query engine designs resident in many tools.
Databrick or no Databricks, the key is that the core of your lakehouse architecture is not tightly coupled to any specific vendor implementation (unless you make a strategic decision to do so).
Is Delta Lake a Lakehouse?
Databricks refers to a “Delta Lake” in the same context as its “lakehouse.” Databricks says the following;
“Delta Lake provides ACID transactions, scalable metadata handling, and unifies streaming and batch data processing. Delta Lake runs on top of your existing data lake and is fully compatible with Apache Spark APIs. Delta Lake on Databricks allows you to configure Delta Lake based on your workload patterns.”
As such, Delta Lake is not a Lakehouse but may be part of one if you decide on the type of functionality needed for your use case.
The Databricks Unified Analytics Platform
As we have stated, an open, well-abstracted data platform means you can run queries from various tools like Domo, Tableau, Microsoft Power BI, Looker, Amazon Quicksight, and many others.
In addition to supporting a broad array of industry-leading analytic tools, it supports consumption by tools and software like Python, DBT, Tableau Prep, Azure Data Factory, AWS Glue, Azure Machine Learning, and hundreds of others.
So a “Databricks Unified Analytics Platform” should first and foremost, be a function of thoughtful and vendor-agnostic architecture.
Why?
We have touched on a number of points already, but another consideration to consider is that given the high rate of change in the analytics and data tools ecosystems, a data platform must avoid tight coupling with vendor solutions. Tight coupling may offer some benefits, but at the expense of increased technical debt, reduced flexibility, and reliance on niche technological know-how.
As such, data consumption tools should embrace this ethos of playing nicely in a well-abstracted data platform, given that the platform should always be agnostic to the tools that consume data from it. A properly designed Databricks lakehouse must meet that challenge.
Azure Databricks SQL Analytics
With SQL Analytics, you can connect to your data lake without having to install additional software. Many tools offer native connectivity to Databricks which ensures your broader data team can be productive and efficient.
For example, Tableau Databricks offers built-in connectors so a business user consuming a report or a data scientist performing a deep-dive analysis can easily connect to the enterprise Databricks data lakehouse and quickly be productive. Microsoft Power BI and Looker also support native connectivity to Databricks.
So Tableau, Power BI, Looker, DBT, and many others offer native support for Databricks which affords you choice in choosing the tools that offer your teams the greatest flexibility and productivity.
What is Databricks SQL?
Databricks SQL is a dedicated space within Databricks for SQL users. It provides a first-class environment for SQL users, allowing you to run SQL queries against large datasets without having to worry about managing infrastructure.
SQL Analytics workspace features a clean UI designed specifically for SQL users. This includes a powerful set of tools for exploring data, visualizing it, and analyzing it. In a pinch, you can even use SQL Analytics to build dashboards and reports. This might be useful for prototypes or data exploration in support of more formal work in Tableau or PowerBI.
Getting started with Databricks Lakehouse
Whether you are looking at a Lakehouse for Retail or a Lakehouse for Financial Services, Ecommerce, or something else entirely, the right architecture is critical.
Getting started can be intimidating. We always suggest that you start small and be agile in pilot projects. Even going through demos with sample datasets can be excellent next steps. Cloud providers will offer the resources needed to explore Databricks as a free trial. For example, AWS offers a Databricks 14-day free trial on AWS. There is free Databricks training as well.
Being a successful early adopter means taking a business value approach rather than a technology outcome.
Databricks Lakehouse: Why? was originally published in Openbridge on Medium, where people are continuing the conversation by highlighting and responding to this story.
from Openbridge - Medium https://ift.tt/SluO94z
via IFTTT
Amazon Vendors have many choices when it comes to advertising online. Even though Vendors can take advantage of Facebook Ads, Google Ads, or other platforms, one of the most effective marketing strategies is to leverage Amazon Ads.
The difference between Amazon Vendor Central and Seller Central is that Vendors do not sell directly to customers, they sell to Amazon and then sell to consumers. As a result, Vendors are not directly transacting with customers, rather they are indirectly interacting with Amazon which is the merchant/retailer.
Why Amazon Vendor Advertising?
Vendors have several opportunities to ensure Amazon keeps returning and issuing those purchase orders for your products. One of the most prominent is Amazon Ads.
While Amazon Ads supports both Vendor Central and Seller Central merchants, it offers exceptional value to Vendors.
To help Vendors execute marketing strategies and fuel sales growth, Amazon provides various services that make it easy to market on the platform.
Vendors who sell their merchandise through Amazon can use native ads on the platform to promote their products and grow their audience. They can utilize the Amazon advertising console toolset, third-party applications, or an agency or consultant.
Amazon Ads allows Vendors to experiment, optimize, and scale according to business priorities. Specifically;
Vendors decide the level of investment. Set a daily budget that meets your needs. Amazon recommends ensuring you have enough budget to get impressions, clicks, and sales.
Vendors can change a budget at any time. Increase or decrease your daily budget in seconds — even when your campaigns are running — to meet your evolving needs.
Vendors can see the impact on sales. A sale is attributed to a campaign when a shopper clicks an ad and purchases your brand’s products on Amazon within 14 days. There is reporting and the Amazon Advertising API, which lets you chart your ad-attributed sales.
Vendors can control their message. Our solutions allow you to reinforce your brand’s value proposition, helping you tell an authentic and engaging story to Amazon shoppers.
How can Ads help your Amazon Vendor Marketing Strategy?
Before getting started with Amazon Ads and creating your first campaign, as a Vendor, it is helpful to establish your business goals. Knowing what you hope to achieve helps you decide which ads to run, how to organize them, and whether they work.
Do you want to drive sales of a new item?
Get people to visit your store?
Make your inventory move faster?
Boost brand awareness?
Determine if an ad is effective before spending money on it?
Help to create demand for new items or give your essential products an extra lift?
Amazon Advertising: What services are available to Vendors?
Several Amazon Ads services are available to vendors: Stores, Sponsored Brands, Sponsored Products, Display Ads, and Video Ads. Each type offers different benefits and restrictions.
Sponsored Brands — Formerly called Headline Search ads, Sponsored Brands ads are customized advertisements that feature your company’s logo, a custom title, and multiple products. They appear in prominent locations within shopping results and on individual product details, helping to increase the likelihood that potential buyers discover your business through these channels.
Sponsored Products: These are the most common form of Amazon Ads. They allow Merchants to list their product for sale on Amazon and display it alongside other sellers’ listings. Merchants can include a description, price, image, and link to their storefront in the listing.
Sponsored Display Ads: Display ads are similar to Sponsored Products, except that they do not require a merchant to list their product for purchase. Instead, they appear as text ads on the left side of the screen.
Video Ads: A video ad allows you to upload a short promotional video to Amazon. You can add a thumbnail, logo, and description to your video.
Amazon Stores — Described as “creating your brand foundation in Amazon.”, your store help shoppers explore your entire range of products with your own branded URL on Amazon.
What can you do to get the most impact and see more results? Using all advertising channels gives you the best chances of reaching more people, amplifying your message, and generating more sales.
According to Amazon’s internal data, advertisers who launched Sponsored Brands after Sponsored Products saw a 12.2% average increase in advertising ROAS. The uplift reaches 16.5% after running Sponsored Brands campaigns for 3–6 months.
Why should Vendors use Sponsored Products?
A Sponsored Product ad is an advertisement that appears when someone searches for something related to your product categories and listings. It may be displayed at the top of the page, next to organic ads, or even below the fold.
Amazon Sponsored Products
It helps customers discover and purchase products you sell on Amazon, with ads appearing in shopping results and product pages. Sponsored product ads can help you reach out to potential customers who might be interested in buying your product.
Sponsored products control your ads’ targeting, spending, and more. They allow you to promote individual product listings to buyers as they browse and search for things to buy. These promoted posts appear above and within search result pages and product details pages across desktop and smartphone devices.
That’s why it’s essential to remember that the quality of your product information, as detail pages, can directly impact your ad performance and sales.
Sponsored products offer several targeting capabilities: automatic, manual (product and keyword), and an optional targeting option for both automatic and manual targeting — negative targeting. Amazon suggests running multiple ad groups at once so you can see which ones perform better than others.
Why should Vendors use Sponsored Brands?
You can use Sponsored Brands to help shoppers discover your brand while they browse items on Amazon and keep your brand at the top of their minds so they can come back and shop your brand in the future.
Amazon Sponsored Brands
Amazon’s internal data showed that from September 2020 to February 2021, on average, campaigns that use a custom image in Sponsored Brands ads on mobile see a 2.2x higher clickthrough rate than campaigns that use only a brand logo and headline with no products.
Ads are keyword and product-targeted, cost-per-click, and are eligible to appear in highly visible placements on top of and within shopping results and product detail pages.
Ads can direct shoppers to an individual product detail page, a custom landing page displaying a selection of your products, or your Store.
You can help encourage repeat purchases by linking your Sponsored Brands ad to your Store, providing opportunities for shoppers to find additional products in your catalog that they may be interested in.
Sponsored Brands video ad format displays auto-playing video in shopping results. Your 6–45 seconds video ads are displayed on mobile and desktop and shown for select keywords relevant to your product. When shoppers click on the video, they’re taken to the product detail page, where they can learn more and purchase the product.
Amazon Sponsored Brands Video
Why should a Vendors create an Amazon Brand Store?
Promote your brand with your multi-paged amazon store for free! As the home for your brand on Amazon, Stores are accessible, always-on destinations available to sellers and vendors enrolled in Amazon Brand Registry.
You can quickly build a free, customizable multipage customer experience with Stores. These experiences can feature Amazon creative assets that reflect your brand and product catalogs.
Per Amazon, of the customers who browse a brand’s Store once, 45% continue using Stores to shop on an ongoing basis.
The easy-to-use Store Builder lets you quickly create an amazon storefront with code or knowing HTML. Design templates and pre-made widgets make it easy to personalize your pages and showcase your products.
You can also promote yourself by using sponsored brands or promoting your business through non-Amazon.com marketing activities.
Now, you can use Sponsored Brands to help you promote your products by taking advantage of your Store and featuring Store pages in your creative. You can show up to three Store sub‑pages in your Sponsored Brand campaign and customize the headline and images for each one.
You can use Spotlight Promotions to promote any collection of products from your store. However, if you want to get approved for this feature, you need at least 3 different pages with unique products on them.
You can select any three of the four pages on your store page to show sponsored content from brands.
You’ll also be capable of entering a customized title, selecting a brand logo, and changing the labels and images representing each of the sub-pages within the ad group.
Note:To be eligible for Stores, you must be enrolled in Amazon Brand Registry. Vendors and sellers already selling on Amazon in the country they wish to advertise can create a Store at no additional cost.
Types of Amazon Vendor Central Amazon Ads Reports
There are a number of opportunities for Vendor advertising, especially on Amazon. The Amazon Ads team created a guide called Advertising solutions for vendors which provides a tutorial and insights on how to get started on their platform.
Below are a few of the key report types that will be of interest to Vendors;
Search term reports can give an idea of which keywords convert best for your business.
Targeting reports offer insights into which campaigns performed best and why. They help you understand how well your targeting works, so you can decide if you need to change your bidding strategy or expand your target audience.
Advertised Product reports provide information on the performance of your advertised products in all your ad groups. It helps you understand whether your ads are working by showing you how well they perform compared to other products in similar categories. If you notice that one particular ASIN performs better than others in its category, then you may want to consider changing up your advertising campaign for that ASIN.
Placement reports provide insights into the performance of your ads on top-of-the-page placements compared to other placement types.
Performance over time report shows you the number of impressions, clickthroughs, conversions, and revenue generated by each campaign. It also shows you the average cost per click (CPC) for each campaign, plus your overall total spent.
Purchase history reports provide details on all purchases made by your visitors. These reports can identify new advertising opportunities and gain insights into what people buy.
There are several options these days for Amazon Advertising analytics for Vendors. For example, you can use your tools for e-commerce insights like business intelligence, data visualization, SQL, or data science tools. Examples are Google Data Studio, Tableau, Microsoft Power BI, Looker, and Amazon Quicksight.
Using tools like these for performance insights is possible because you can now unify your data to a leading data lake or cloud warehouses like Redshift, Redshift Spectrum, Google BigQuery, Snowflake, Azure Data Lake, Ahana, and Amazon Athena for a unified, analytics-ready single source of truth to fuel informed decisions on product, media, and customer demand.
Are you using an Amazon Vendor Central consultant or agency?
If you use an Amazon Vendor Central consultant or Amazon Agency, they will likely manage your campaigns in a vendor or agency account within the advertising platform. Also, it is not uncommon for an agency to leverage services like Amazon DSP or other third-party tools to manage Vendor specific sponsored brand ads and sponsored display ads. This may also include tools for managing creative assets, products, descriptions, product reviews, or so forth in your Amazon storefront.
So if you use an Amazon vendor central agency or consultant, check to see how they manage your campaigns, including requiring direct access to performance data.
Are you enrolled in the Amazon Brand Registry?
Asa Vendor, make sure you are enrolled in Amazon Brand Registry to unlock a suite of tools designed to help you build and protect your brand, creating a better customer experience.
Brand Registry helps you protect your intellectual property and create an authentic and trusted experience for customers on Amazon. Amazon automated protections proactively use information about your brand to remove suspected infringing or inaccurate content.
Take control over product pages that use your brand name with Brand Registry, so customers are more likely to see correct information associated with your brand.
Enrolling in Brand Registry gives you access to Amazon self-service solutions like Stores and Sponsored Products, which can help you reach more shoppers and build brand awareness and equity.
To be eligible to enroll in Amazon Brand Registry, you must have a registered trademark in each country where you want to register or a pending trademark application filed through Amazon IP Accelerator.
Get Started Automating Amazon Vendor Central Advertising Data — For Free
Ditch the manual Amazon Vendor Central Advertising report downloads. Openbridge is an Amazon Advertising verified partner and offers code-free ads data automation, one of the most powerful tools Vendors can tap into. Automation accelerates performance and the speed at which your team can gain valuable insights to deliver data-driven growth and profit.
How to analyze Ecommerce data with Tableau Software, including example reports
Business intelligence tools are powerful analytical tools that help businesses make better decisions and improve performance. They provide insights into data such as sales trends, customer behavior, product usage patterns, and much more. Later in this post, we show examples of how Tableau Retail + Ecommerce dashboards bring those points to life.
While a diverse collection of Business Intelligence tools such as Google Data Studio, Power BI, SAP, or Looker allow teams to build dashboards, we are focusing on Tableau Software in this post. However, the outputs and approaches detailed in this post can easily apply to those tools!
Tableau is one of the most popular tools used for data visualization. It allows you to make quick visualizations and dashboards. You can use it to analyze data quickly and easily.
The following are some of the core value propositions of the software:
Easy To Use: Tableau is easy to learn and use. You don’t need programming languages to understand how to work with Tableau. Also, there are no technical skills required to use Tableau, though a basic understanding of data and how to construct reports is important. If you know Excel, you can use Tableau.
Data Preparation: Tableau works best when you can transform data on the fly. They provide the tools to prepare the data before starting to work with Tableau.
User-Friendly Interface: When you start using Tableau, you feel comfortable immediately because of its simple interface.
Customizable Dashboard: If you want to customize your dashboard according to your needs, you can do it quickly.
Interactive Charts: With Tableau, you can interact with charts. For example, you can zoom in/out, change colors, add annotations, etc.
Powerful Filters: You can filter your data based on multiple criteria. This feature helps you to find out what exactly you want to see.
Value Of A Tableau Ecommerce Dashboard
An Ecommerce dashboard should display Key Performance Indicators (KPIs) that the business decides are critical for driving sales performance. These KPIs allow you to see how your business is performing and where it needs improvement. As a result, a well-designed Tableau ecommerce dashboard helps your team better understand trends and patterns in your product/service offerings.
A typical dashboard would include:
Product Performance
Customer Experience & Journey
Sales Analytics
Marketing Campaign Analysis
You can often find prebuilt or customized dashboards that make the process easier. Agencies, consultants, and freelance teams have them ready to go. However, there are dashboard solutions they build that are based on customer requirements.
Tableau Ecommerce Dashboard Examples
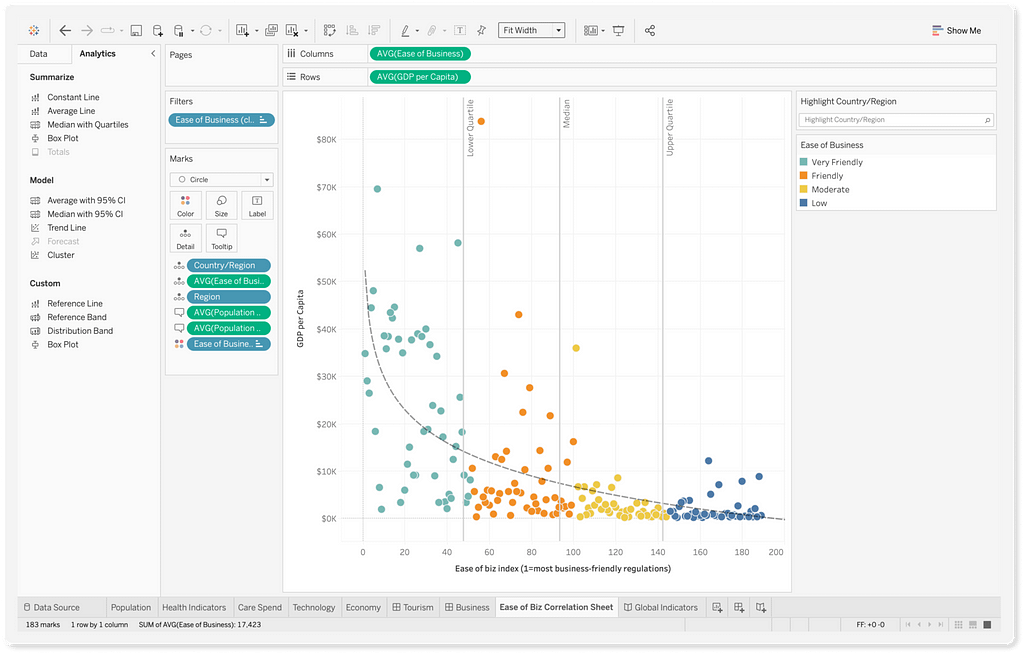
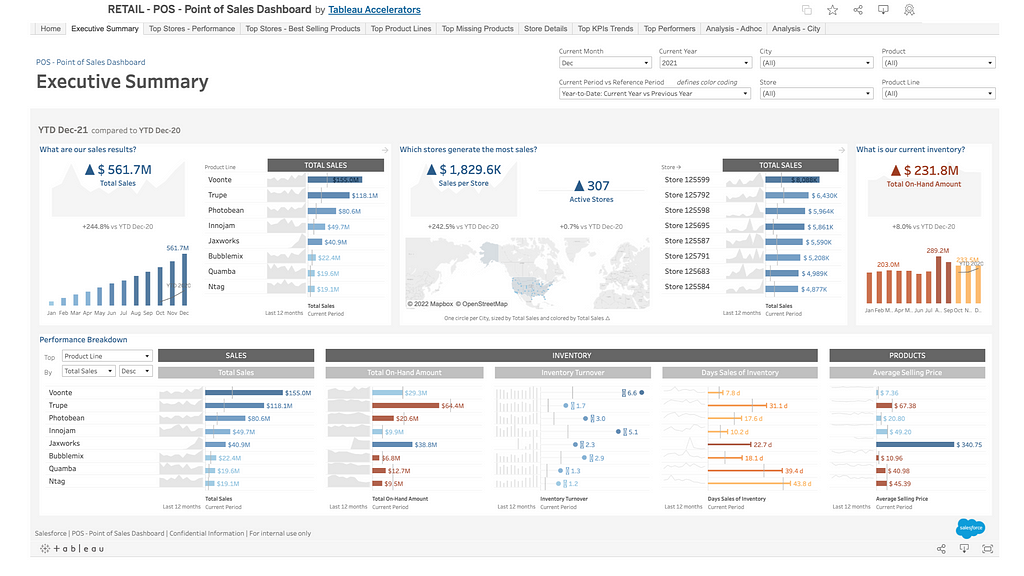
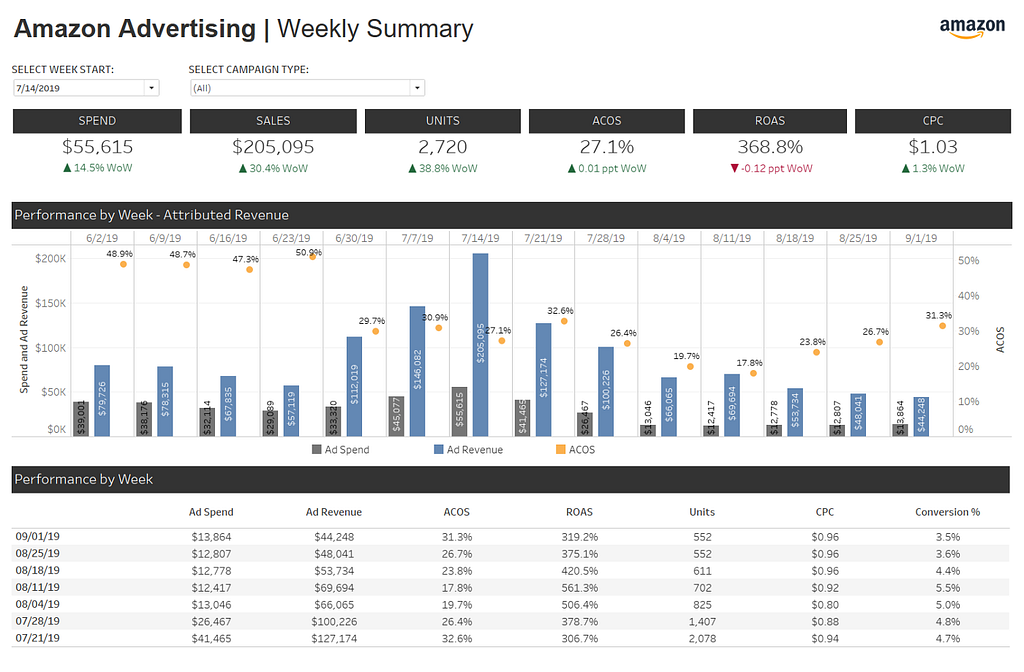
A Tableau dashboard provides a visual representation of key metrics across multiple elements of your digital marketing and retail business. In this example you can see product performance, ACOS, Ad Spend, Revenue, and other KPIs:
tableau retail dashboard examples
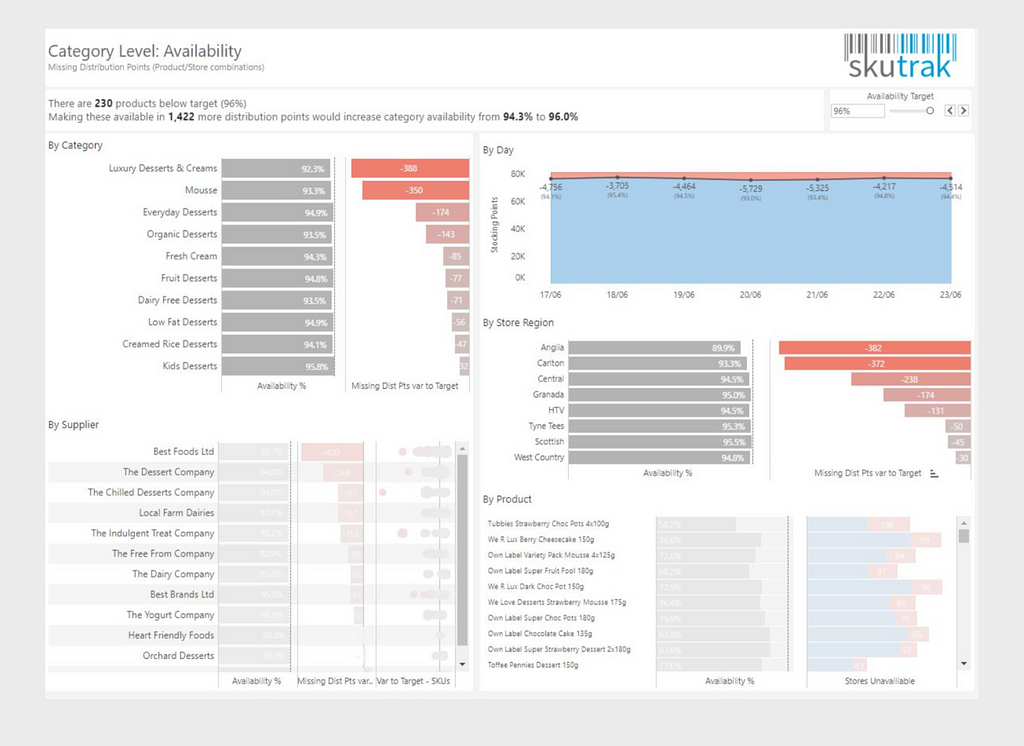
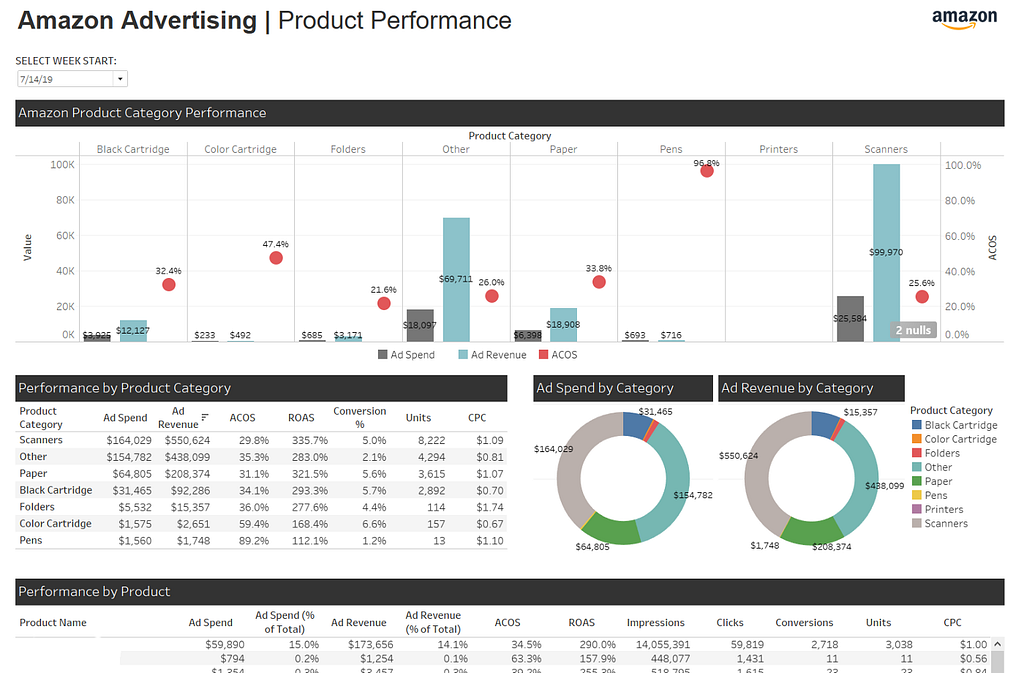
This is another dashboard that shows attributed revenue, ROAS, CPC, total sales, spending, units, and much more:
tableau retail dashboard examples
The couple of examples areof a Retail dashboard available as part of the Tableau accelerators;
Tableau dashboards like these are great tools to monitor sales and inventory levels, identify trends, and spot potential problems. They’re also great communication tools for employees, customers, and suppliers.
Extending Your Ecommerce Tableau Dashboard
As you build confidence in your reports, you can look to extend data pipelines to your data lake or cloud data warehouse. For example, you can start to layer other data sources in your Tableau data analysis;
Unify your data in Amazon Redshift, AWS Athena, Google BigQuery, Snowflake, or Azure Data Lake, so your marketing team, agency, or on-site business analyst can quickly get what they need in Tableau.
Employ integration solution ready for Amazon Selling Partner, Amazon Advertising, Shopify, and Amazon Vendor Central to accelerate ecommerce dashboards in Tableau.
With a data lake or data warehouse, consolidate marketing data from Google Ads, Facebook, Amazon Advertising, and others. This includes advertising and marketing campaigns, as well as associated marketing spend
Create lifetime value models, customer journey analysis, or RFM reports; you can map the business objectives to the type of analysis needed.
Extend the examples we shared above to create a robust supply chain dashboard Tableau visualizes for you or include Tableau retail dashboards that show data from a physical store.
Fueling Your Tableau Ecommerce Dashboard With Automated Data Pipelines
From basic integrations to complex integrations, the key to analytics agility, efficiency, and performance is to store data in a scalable, flexible data lake or cloud data warehouse for Tableau to consume.
Having data well-abstracted allows teams to undertake data science, machine learning, or other types of data analytics. Unifying your data across a combination of integrations, including native connectors built into Tableau, will ensure fast, flexible, and future-proof integrations as you become a data-driven retailer.
Not only do you realize the business benefits of improved insights and growth, but it also allows for actionable insight supporting business future planning and strategy efforts. Any valuable insight gained from data analytics can blunt the negative business impact of competitors and market changes.
Here are a few examples of automated data pipelines that can fuel your insights efforts:
Tableau Shopify Integration
Tableau Amazon Seller Central
Tableau Amazon Advertising
Tableau Amazon Vendor Central
Not using Tableau? Pick Another Data Science, Modeling, Or Visualization Tool!
Customizable interfaces, informative visualizations, interactive dashboards, mobile-ready reports, and a robust Tableau user community make Tableau a great BI tool for e-commerce analytics. However, while the article focuses on Tableau, you can use tools like Power BI, Google Data Studio, Looker, and others to build equally compelling e-commerce dashboards, reports, and visualizations.
For example, our early report examples could be easily translated to a Power BI Ecommerce dashboard. The point here is an Ecommerce dashboard Power BI, or Google Data Studio, specific can be created in a similar context.
Get Started Fueling Tableau Ecommerce Dashboards With Data — For Free
Openbridge offers code-free data automation, one of the most potent tools Tableau users can tap into for Ecommerce dashboards and analysis. Automation accelerates performance and the speed at which your team can gain valuable insights to deliver data-driven growth and profit.
Getting started with Ecommerce performance analytics using your tools for insight and optimization
Data analytics in Ecommerce can seem daunting, but it can be simplified with the right tools that support a consistent and flexible focus on performance.
There are several options these days for e-commerce analytics. For example, you can now use your tools for e-commerce insights like business intelligence, data visualization, SQL, or data science tools. Examples are Google Data Studio, Tableau, Microsoft Power BI, Looker, and Amazon Quicksight. Using tools like these for Ecommerce insights is possible because you can now unify your data to a leading data lake or cloud warehouses like Redshift, Redshift Spectrum, Google BigQuery, Snowflake, Azure Data Lake, Ahana, and Amazon Athena for a unified, analytics-ready single source of truth to fuel informed decisions on product, media, and customer demand.
As a result, there are tremendous opportunities for undertaking data-driven insights efforts.
What is Ecommerce Analytics?
Ecommerce analytics covers a broad spectrum of different types of data that reflect your customer and digital strategy. These include data on the entire customer journey, from email marketing and paid Google Ads to the actual purchase event on your preferred ecommerce platforms like Amazon or Shopify.
Ecommerce analytics aims to provide actionable insights that allow you to improve your customer experience, increase conversion rates, and ultimately grow your bottom line.
In an earlier post called Unlocking The Power Of Digital Shelf Analytics, we discussed a holistic view of this process. That post highlighted how to use data to discover new opportunities to optimize retail operations, media, and user experiences to drive sales performance.
The bottom line? Ecommerce analytics helps retailers figure out what works and doesn’t work about their user experience, operations, and marketing campaigns. As a result, Ecommerce sales analytics provides the insights needed to understand product performance so you decide on future product development and marketing strategies.
Why Undertake Data Analysis For eCommerce?
Analyzing your Ecommerce efforts helps you create better products, services, content, and user experience. The analysis leads to insights into how customers behave, including gaps and issues with the customer journeys or the user flow in purchasing products/services so they can make data-driven optimizations.
Here are a few core benefits to harnessing your data for analysis;
Measuring the effectiveness of your marketing campaign. Analytics can help ecommerce companies measure their online sales, improve customer service, gain more omnichannel traffic, and inform holistic business decisions.
Analyze the trends or patterns in the data so you can predict accurately. Ecommerce analytics help you to know better how your business is doing now and how it will perform in the future. This knowledge allows you to set up your business for success by ensuring that the right things are available when needed.
You are optimizing your pricing, up-selling, and sell-through strategies. With Ecommerce analytics, you can gain insights into which products drive sales and which don’t. You can then adjust prices accordingly.
You are personalizing individual experiences by using customer data. It’s essential to understand how customers behave when they visit your site so you can optimize your product pages and improve the buying experience for everyone.
Use data-based insights to inform your strategy. One additional advantage of Ecommerce analytic tools is that they provide insights into what’s going on in your business and the industry at large, which gives you an idea of what might happen next and whether there are any potential risks you need to take into account.
This list is not exhaustive but reflects a few primary areas teams look to explore.
What Do You Measure In Ecommerce Analytics?
Several areas of Ecommerce analysis allow you to understand your business and its markets better.
Audience
Have you identified your target market? Who do you want to reach? What demographic groups do you want to attract? Once you’ve identified your target market, you must analyze your audience. How old are they? Where do they come from? Which social media platforms do they use? Do they read blogs? Are they interested in specific types of news stories?
These questions will help you identify who your ideal customer is.
Next, you’ll want to find out what kind of person they are. What do they value? What motivates them? What problems do they face? What issues do they care about?
By answering these questions, you’ll be able to align your product positioning that matches their needs.
Finally, you’ll want to consider the competition. Analyze your competitor’s strengths and weaknesses. What are they doing? Why are they successful? What strategies do they employ? How do you position yourself against competitors? How does your potential customer view you?
Acquisition
You can also track customer acquisition using data related to the acquisition of customers, which helps you understand where you’re losing potential customers. It’s important because you’ll learn about how your people became aware of your products and where that occurred.
Do most of your traffic comes from social media posts? Instagram, Twitter, Facebook?
How many website visits do you generate through email marketing?
What does the average post convert ratio look like for your blog?
Does paying for Google Ads, Facebook Ads, or other paid media bring in most of the people who visit your site?
This data will help you determine which marketing channel is best for your business and where to spend your time and money.
Behavior
It would be best if you also considered looking into consumer behavior data.
Which product lines do customers buy?
How many people visit your site but close their browsers without clicking through any pages?
Which page do visitors usually click on first?
Which types of marketing content get people to take action?
What kinds of product ideas get lots of attention from people but don’t sell well?
On average, how long do visitors stay on your site?
Are your products easy to navigate? Do your customers know where to go after viewing an item? If users leave your site without finding what they’re looking for, you might have a problem with page design, content, positioning, or images. If your customers cannot figure out what they’re looking for after visiting your site, you’ll need to make changes to improve your conversion rate.
Conversions
We’ve talked about conversions but haven’t defined exactly what they mean. These are vital questions you’re asking about conversion analytics.
How long does it typically take for someone to become a paying customer?
Which type of customer converts most often?
Customers usually purchase items after just one visit to your online shop. However, they may return later if they don’t see something they want.
Repeat purchases from customers?
How many customers abandon shopping carts before they’re converted into paying customers?
This data is vital because it allows you to determine which discounts and deals will appeal to your current customer base. Knowing the specifics helps to inform your marketing strategy so you can decide which message to send out and how to communicate it to people best.
Paid Marketing Activities
Another critical aspect to consider when evaluating your analytics is your paid advertising efforts. This will allow you to calculate your ROI for different types of paid ads.
How much has your business generated from its social media ads? Does Instagram drive more revenue than Twitter?
Did you earn more income from the ad campaign than you spent on creative and ad spend?
How much has your business grown as a result of your PPC campaigns?
What about your email campaigns?
Other paid media efforts? Influencers?
If you don’t evaluate your current paid advertising efforts, you’ll only be able to invest in ads that aren’t working for your business.
For example, Amazon Advertising is the go-to for Amazon Sellers. You have direct access to campaigns, keywords, targets, ads, and many other data points for your paid media investment on Amazon.
Business metrics like average order value, revenue, and unique visitor count are important indicators of how well you’re doing. But many different types of metrics measure success across multiple channels. For example, acquisition channels are places where people find products and services online. These include social media sites, review platforms, blogs, ecommerce stores, and more.
Several KPIs exist, including transaction, revenue, customer satisfaction, and conversion.
Transaction metrics will often include:
Average basket size.
The number of products sold daily.
Total sales volume over a given period.
Revenue metrics have a
net profit margin
gross profit margin and
gross profit percentage
Customer satisfaction metrics include things like
customer retention rate
return rate, and
customer lifetime value
Conversion metrics have
cart abandonment rate
purchase frequency, and
checkout conversion rate
Marketing Channel Analysis
Marketing analytics help companies know what works and which marketing tactics are effective. This knowledge can improve product development, advertising strategies, and brand management.
A marketing channel is a way to reach customers. For example, a customer could use social media, email, text messages, billboards, TV ads, radio spots, etc., to contact you. Each channel has a different purpose and offers another type of audience.
Marketing channel analysis aims to identify where your best prospects are coming from. You do this by analyzing the data from each channel. If you find that a specific channel isn’t working for you, you’ll know exactly why. Then, you can make adjustments to improve performance.
For instance, if you find people clicking on your Facebook ad but not converting, you might adjust budgets, creative, or target audience. Or maybe you notice people sign up for your newsletter but are not engaging. In this case, you’d probably change the frequency of your emails or add additional value to your newsletter.
Each channel has metrics, including conversion, bounce, and abandonment rates. Conversion rates show a marketing campaign’s success at getting leads into the funnel. Bounce rates indicate whether someone left the site without buying anything. Abandonment rates tell how likely someone will abandon a purchase once they reach checkout.
Ecommerce Funnel Analysis
A funnel analysis gives insights into how visitors arrive in your purchase funnel, where they go, and what happens next. This exercise aims to identify opportunities to optimize your marketing and customer journey efforts. This effort will help ensure you get the maximum number of potential customers to convert.
First things first, you should identify your business’ overall objective. Once you’ve done that, go through each part of the journey and figure out how people can get from one point to another. Make sure they know what path leads where. You may discover that one area isn’t getting much traffic, so you could create an easy link to draw people towards it.
Once you’ve identified your goals, it’s time to build a funnel. Start by defining the steps involved in reaching each goal. Each step represents one stage in your funnel. In addition to the name of the action, including the URL that leads to it. Then, write down the conversions associated with each step. Finally, label each step according to whether it’s leading toward success or failure.
After completing the funnel diagram, dig into the data and analyze it. How do visitors behave once they reach your store? Are they staying on the site long enough to complete a transaction? Do they bounce away immediately? Is there a clear path from the homepage to the checkout process? Once you understand your visitors’ behavior, you can decide how to change things.
For instance, if you found that most visitors never complete their transactions, you might consider adding additional information on the home page to help them. Or, if you noticed that most of your visitors bounced away without even looking at your offers, you might try changing the layout of your offers, refining the copy, or creative to make them more compelling.
If you aren’t making it easy for your visitors to navigate through your funnel, you’ll lose a lot of potential customers.
Ecommerce Analytics Best Practices
With an understanding of how beneficial ecommerce analytics is for your business, you will now need to implement the core KPIs and tools correctly so they can help you achieve success.
Benchmarks
A benchmark is a specific target that helps you understand how well you are doing against competitors. You can use measures to establish goals, track performance, identify areas for improvement, and compare yourself to others.
Benchmarks can help you determine whether you’re meeting your objectives and provide valuable data for measuring progress. For example, you might want to know how many leads you’ve generated per month or how much revenue you’ve earned over a quarter. Benchmarking gives you a way to quantify your success and make sure you’re making good decisions.
Collect all of your marketing data from all of your different sources and channels
You may start with some messiness, but you must organize everything into one place to easily access it.
If you have been working with data manually, you are likely feeling overwhelmed. That’s okay! Make a list of where all of your data resides. Here are some examples:
Email providers
Customer relationship management platforms
ERPs
Google Ads
Facebook Ads
Amazon
Shopify
The good news is that this information can be easily pulled together and exported in one place. With a pre-made connection, you can get your data from any source without much work. This saves you time and effort to focus on what matters most — growing your business.
Ecommerce Analytics Tools
Thankfully, Ecommerce analytics tools provide the software to discover new opportunities while surfacing a wealth of information about your operations, visitors, and sales.
Using these tools for analyzing data, you can see how customers interact with your products and services and determine whether certain features or actions drive sales.
The best ecommerce analytics software helps your teams gain velocity in decision-making efficiently and flexibly.
An analytics tool provides insights into your current campaign performance. It lets you compare your metrics against industry benchmarks, monitor the impact of changes to your campaigns, and generate reports tailored to your needs. By analyzing your data, you can make better decisions about your marketing activities and optimize your return on investment.
Analytics tools help you analyze your data and make intelligent decisions based on those findings.
Self-Service Ecommerce and data analytics Tools
Ecommerce data analytics help businesses understand what customers want and what drives sales. There are many different ways of measuring ecommerce performance, including transaction volume, basket size, product views, and revenue per visitor. These tools collect data from the entire site and offer insight into customer behavior and conversions.
You can increase your chances of selling more products online by making better decisions.
Here is an example of paid media analysis using Tableau:
In addition to media performance, you can construct a deep dive on product performance as well:
While these examples show the power and flexibility of Tableau, they demonstrate more broadly what is possible with tools like Tableau. The following is a collection of some of the best ecommerce analytics tools for self-service insights efforts;
Google Data Studio
Tableau
Power Bi
Looker
Sisense
The tools reflect industry leaders and the best analytics software for ecommerce for those who want to own their insights efforts. Combine these tools with your data unified in a cloud data warehouse or data lake; you create a powerhouse ecommerce analytics platform tailored to your needs.
Examples of prepackaged ecommerce analytics software
Unlike self-service tools, packaged Ecommerce analytics tools provide pre-built visualizations and reports. While less flexible, they can offer a wealth of information about your visitors and sales quickly.
These tools will often prebuild ecommerce analytics dashboards that can package KPIs and offer insight into customer behavior and conversions. They will provide different ways of measuring ecommerce performance, including transaction volume, basket size, product views, and revenue per visitor.
Here are a couple of examples of this category of tools:
Analytics in ecommerce should provide insight into your current performance and actionable recommendations that inform actionable strategies. In addition to providing valuable insights about your key metrics in campaign performance, it will show you where there are gaps, which areas need improvement, and how you optimize for ecommerce metrics that increase your ROI.
As an ecommerce business using analytics, you can make better-informed decisions that will help your business grow and succeed. From adjusting advertising investment to refining content for popular products, analytics delivers data-driven insights so you can see where your business is thriving and where it needs improvement.
You have several options when choosing an ecommerce analytics tool. However, the key is getting started. You cannot know if something is working unless you measure it.
Getting Started With Ecommerce Analytics
Unifying and owning your data allows you to build a view of sales over time, and understand buyer behavior more deeply. Data-driven insights mean your sales funnel will be full, your content strategy aligned, and traffic potential optimized.
If you are looking for data pipelines for your eCommerce data, Openbridge offers no-code, fully automated data pipelines.
Unify your eCommerce data and start your analysis journey today.
Discover the potential of a unified non-Amazon and Amazon digital shelf with an automated, private data shelf
The digital shelf is one of the most talked about topics in retail today. And it’s easy to see why. Digital shelves are where consumers go to find products and make purchases. They are becoming increasingly important as shoppers shift away from traditional brick-and-mortar stores. Retailers want to capitalize on this trend by creating a seamless experience across channels.
But most companies aren’t taking full advantage of their “data shelf” for performance insights. A survey by Shopify stated that only one in five retailers use a digital shelf strategy and digital shelf analytics. And many of those who do, admit they don’t fully capitalize on the opportunity.
So why are some businesses still missing out on an opportunity? Because they haven’t taken advantage of the data at their fingertips to fuel their digital shelf analytics.
What Is a Digital Shelf?
The broadest of the digital shelf is that it reflects the shopper’s journey. As a result, a digital shelf demonstrates a collection of product images, emails, videos, reviews, ratings, price information, social media posts, etc., displayed prominently in a shopping experience aligned with your channels.
These elements help customers discover products and learn more about them. For example, Amazon displays product images, customer reviews, and prices on its site. Walmart uses similar tactics to display product information and photos.
How Does a Strong Digital Shelf Help Increase Sales?
A strong digital shelf often reflects a robust shopper experience strategy. This includes a comprehensive digital marketing model that reflects the broader customer journey, from an advertising strategy, social, merchandising, and targeting the right keywords in your SEO strategy.
A robust digital shelf improves consideration, and brand awareness helps reduce abandonment rates and increases conversion rates. Here are a few core benefits of an insights-driven digital shelf;
Improves your cross-channel marketing efforts and connects them to the user and company goals. Don’t rely solely on upper-funnels metrics for your different marketing campaigns. Get a full-funnel perspective of how your marketing strategies benefit your users and company regardless of which campaign they’re part of.
Delivers digital self insights, you’ll discover new ways to engage with shoppers on and off Amazon to increase product consideration, sales volume, and conversion rates.
Whether your campaigns are paid or organic, you can make in-flight optimizations, informed by Amazon conversion reporting, to ensure your strategies effectively and efficiently drive sales.
Understand which parts of your business are driving sales performance so you can optimize future products and campaigns with the insights needed to be successful.
How Do You Understand The Digital Shelf on Amazon (and off Amazon)?
The Amazon digital shelf is a collection of product detail pages, reviews, images, videos, ads, and other information about products that are displayed on Amazon.
Marketing, social, and shopper engagement off Amazon also drives to your listings so this is a critical part of your shelf. These items help shoppers become aware of your products and make better decisions about what to buy and when to buy, including repeat purchases.
Brands should understand the importance of the Amazon digital shelf because it provides a way to connect with consumers where they’re looking. Amazon provides brands with opportunities to interact with consumers in ways that go beyond traditional advertising. For example, Amazon Attribution provides insight into how brands’ non-Amazon marketing channels (social, organic, direct, and email marketing…) impact digital shelf performance on Amazon.
The following are various aspects of the Amazon digital shelf that contain key metrics for different aspects of the shopper journey;
Amazon Sponsored Advertising
Amazon Advertising offers Sponsored Products, Sponsored Brands, Sponsored Display, Stores, and Video Ads. The services cover a gamut of Ad related activities like relevant keywords, search ads, product display ads, sponsored product ads, and many others.
Allows advertisers to buy high-quality Amazon search, display advertising, video ads, brand awareness, and audio ads on and off Amazon at scale to target a relevant audience in real time.
Extends the reach of your digital shelf marketing efforts to non-Amazon channels. It allows you to understand better purchase rates and customer journeys to optimize digital marketing strategies and advertising channel effectiveness.
Amazon offers an incredibly robust array of data on retail product performance. They get you the data you need to go deep from orders, returns, inventory, and fulfillment.
Amazon Inventory: Get FBA Inventory Reports data for the listing, condition, disposition, and quantity to help with day-to-day inventory.
Amazon Fulfillment: Get complete, product-level detail on inbound shipments, shipped FBA orders, quantity, tracking, and shipping with FBA Fulfillment Reports and Inbound Fulfillment API.
Amazon Orders: Online orders and item information for both FBA and seller-fulfilled orders, including order status, fulfillment and sales channel information, and item details with Order API and FBA Orders Reports.
Retail Analytics:Vendor Retail Analytics delivers ordered revenue, glance views, conversion, replenishable out-of-stock, lost buy box, returns, replacements, and many more.
The reports provide valuable insights into customer behavior, ranking position, and unit sales in search results which can help you understand product visibility and develop more effective marketing strategies and strategic decisions that drive product sales.
Discover performance-focused keyword ideas, and identify key search terms that meet business objectives. Uncover product details and top keywords your competitors are targeting, and many more so you can trend activity over time.
Business level Sales and Traffic reports offer performance metrics for product sales, revenue, units ordered, and page traffic metrics such as page views and buy box. Amazon now offers these reports via their API for complete automation; see automation of Amazon Detail Page Sales and Traffic Business Reports.
Amazon Brand Stores
Amazon brand stores give third-party sellers access to a tool to package, present, and sell products directly through the e-commerce giant. Brands can choose whether to use a branded product listing or a custom listing. They can also add images, videos, reviews, and pricing information to their listings.
What Is Digital Shelf Monitoring?
Digital shelf monitoring allows retailers to track performance and product trends over time. This information can help retailers determine whether certain items are selling well online or offline and provide insight into promotional effectiveness.
For example, you can use Google Data Studio + Amazon Seller Central data to create dashboards, reports, and visualizations that provide a rich, tailored view of your private data shelf.
Why Monitor Your Digital Shelf
Here are a couple of benefits of keeping tabs on your digital shelf in your efforts to capture the next sale;
Uncover where you are missing out on potential sales opportunities and double down on marketing tactics that drive performance.
Optimize product tiles, product descriptions, product page design, or other elements of your product content in listings, ads, or social posts.
Minimize any blind spot trying to understand the impact Google Ads (formerly Google AdWords), Facebook, and Microsoft Ads…have in driving potential customers’ shopping activity on Amazon.
Understand sales attribution, audience strategies, and opportunities for optimizing additional products into a conversion funnel.
Make multi-channel campaign recommendations and optimizations using on-demand insights to accelerate e-commerce marketing efforts.
Explore competitor threats with trending, first-party search data directly from Amazon, including market share for keywords and products.
Leveraging conversion insights can inform automated bid and budget optimizations to provide valuable insight to improve your campaign ROI.
Use data to drive changes and optimize an account or campaign-level marketing plan.
What Is Digital Shelf Analytics?
Digital shelf analytics allows merchants the ability to analyze consumer interactions with products on the shelf. This includes everything from product reviews to social media mentions.
Even if you are only focused on Amazon as your sales channel, understanding the efficiency and effectiveness of your digital shelf concerning who and when people buy your products is essential to any detailed sales impact analysis your team may undertake.
Private, Digital Shelf Analytics Software Owned By You
Your digital shelf analytics suite can be as simple as the tools you may already be using for reporting and analytics!
Brands can now automate Amazon Digital Shelf data collection into a private, trusted data shelf. Rather than leveraging proprietary digital shelf analytics providers, you can take control and own your data.
Direct, automated access to your digital shelf data allows you to use your favorite business intelligence, data visualization, SQL, or data science tools like Google Data Studio, Tableau, Microsoft Power BI, Looker, or Amazon Quicksight to perform digital shelf analytics. Create customized traffic dashboards, track spending on advertising campaigns, or additional reports that allow you to build competitive shelf intelligence.
Data Impact: Unify And Own Your Data To Fuel Your Digital Shelf Optimization Efforts
With direct access to the digital shelf data, you can undertake an in-depth or comparative analysis across brands, define actionable insights, or use direct access to campaign reporting to optimize marketing efforts.
With digital shelf data unified and accessible, quickly optimize for poor conversion rates, identify gaps in operational performance, uncover the percentage of customers converting, refining advertising efforts on and off Amazon, or discover key customer metrics that impact purchase decisions.
Get Started Now With Digital Shelf Analytics
Harnessing your data shelf reflects true impact data, or data that can fuel insights driven growth.
In a fast-paced e-commerce environment, an online retailer’s digital strategy can not succeed by relying on manual, error-prone, and inaccurate data. Supercharge omnichannel analytics solutions like Tableau, Power Bi, Google Data Studio, Looker, and many others with direct, automated digital shelf data. Digital shelf insights with these tools are convenient, fast, and always owned by you.
Your competition is using a private, first-party digital shelf analytics platform as a competitive advantage, and so should you.
Unify your shelf and start your data impact analysis journey today.
Unlock Amazon Sales Volume data for automated performance reporting
As an online business, Amazon sellers face the constant challenge of competing against millions of other products in its marketplace.
Do you want to know what products sell well on Amazon? How can you find out which items sell best on Amazon? Are you looking to profit from selling your favorite products on Amazon? Do you want to understand your detailed reports for product sales by ASIN, search volumes for product categories, new product niches, and comprehensive sales reports?
Understanding Amazon sales volume is essential for sellers to calculate performance. Thankfully, Amazon provides a broad range of resources, sometimes confusing, for sellers to understand sales volume.
We will cover three core report types for sales volume:
To access your sale data, click on the “Reports” tab in your Seller Central account. Then select “Fulfillment->Sales-> All Order Reports.” You can choose to download a .csv file from this page.
Sign in to your Amazon Seller Central account.
Click the Reports menu, and then click Fulfillment
Next, select Sales and All Orders
The Order by Order data and Order by Last Update tab will show a view of your sales.
Amazon uses several different report types and metrics to measure how much inventory sells during a day, week, or month. These metrics are vital to understanding how fast or slow your Business is growing, but they aren’t equally helpful in tracking trends and managing growth. Here are a just few metrics available in various reports:
Sales rank
Seller rank
Units sold
Sales estimate (pending orders vs. shipped orders)
Product rank
Typically, you can get the sales data via the UI, manual CSV or Excel report downloads, or via API.
You can use these exports to explore detailed sales history, sales trends, sales per day, sales over 12 months, and other views.
Here are a few approaches to parsing the data so you can understand actual sales volume.
Daily Sales Volume Metrics
Daily sales volume is one of the most commonly reported and tracked metrics related to Amazon product listings. By reporting daily sales volume, Amazon indicates how quickly your listings sell out.
Weekly Sales Volume Metrics
Weekly sales volume is another widely-used metric, particularly among small businesses. To calculate weekly sales volume, multiply the number of days in a week by the unit price per listing. After accounting for shipping costs, fees, etc., you’ll receive a figure representing the total amount of money made.
Monthly Sales Volume Metrics
Monthly sales volume is similar to weekly sales volume, except it reports how much income was generated over a monthly period instead of a weekly period. To calculate monthly sales volume, multiply daily sales volume by 7. Because we’ve assumed seven days make up one month, dividing the result by 365 gives you the total number of units sold that month.
Other Sources Of Amazon Sales Volume
If you are using Amazon Advertising, they will provide sales volume by a campaign, keyword, and other report types. This data is available as manual downloads or via Amazon Advertising API Automation.
Another source of data is Amazon Brand Analytics. You can get keyword data for Amazon Retail categories, allowing you to get direct insight into the level of competition for SKUs and categories. This can be a tremendous resource for new keyword ideas or optimizations to product listings.
There are several ways that Amazon provides sales data. This information is essential because it helps you to plan and manage your inventory more efficiently. Using sales data will give you the confidence to take on any e-commerce business challenges that come your way
Getting Started With Amazon Sales Volume Automation
Unifying and owing your data allows you to build a view of sales over time, understand buyer behavior more deeply, or trending monthly traffic patterns. Data-driven insights mean your sales funnel will be full, your content strategy aligned, and traffic potential optimized.
If you are looking to automate your Amazon business analytics reports, Openbridge offers no-code, fully automated data pipelines;
automate sales and traffic data to fuel traffic analytics tools like Google Data Studio, Tableau, Microsoft Power BI, Looker, or Amazon Quicksight to fuel forecasting, analysis, reporting, and marketing efforts. Create a new custom dashboard, enhance an existing dashboard, or perform a breakdown of sales, data automation will get you what you need.
With data automation in place, you can understand and optimize your digital marketing strategy, and efficiently grow your existing customer base while identifying ideal customers that drive revenue. Informed decisions are within reach with automation for all of the critical types of reports you have come to rely on.