Kickstart Ecommerce Analytics: A Beginners Guide

Getting started with Ecommerce performance analytics using your tools for insight and optimization

Data analytics in Ecommerce can seem daunting, but it can be simplified with the right tools that support a consistent and flexible focus on performance.

There are several options these days for e-commerce analytics. For example, you can now use your tools for e-commerce insights like business intelligence, data visualization, SQL, or data science tools. Examples are Google Data Studio, Tableau, Microsoft Power BI, Looker, and Amazon Quicksight. Using tools like these for Ecommerce insights is possible because you can now unify your data to a leading data lake or cloud warehouses like Redshift, Redshift Spectrum, Google BigQuery, Snowflake, Azure Data Lake, Ahana, and Amazon Athena for a unified, analytics-ready single source of truth to fuel informed decisions on product, media, and customer demand.

As a result, there are tremendous opportunities for undertaking data-driven insights efforts.

What is Ecommerce Analytics?

Ecommerce analytics covers a broad spectrum of different types of data that reflect your customer and digital strategy. These include data on the entire customer journey, from email marketing and paid Google Ads to the actual purchase event on your preferred ecommerce platforms like Amazon or Shopify.

Ecommerce analytics aims to provide actionable insights that allow you to improve your customer experience, increase conversion rates, and ultimately grow your bottom line.

In an earlier post called Unlocking The Power Of Digital Shelf Analytics, we discussed a holistic view of this process. That post highlighted how to use data to discover new opportunities to optimize retail operations, media, and user experiences to drive sales performance.

The bottom line? Ecommerce analytics helps retailers figure out what works and doesn’t work about their user experience, operations, and marketing campaigns. As a result, Ecommerce sales analytics provides the insights needed to understand product performance so you decide on future product development and marketing strategies.

Why Undertake Data Analysis For eCommerce?

Analyzing your Ecommerce efforts helps you create better products, services, content, and user experience. The analysis leads to insights into how customers behave, including gaps and issues with the customer journeys or the user flow in purchasing products/services so they can make data-driven optimizations.

Here are a few core benefits to harnessing your data for analysis;

  • Measuring the effectiveness of your marketing campaign. Analytics can help ecommerce companies measure their online sales, improve customer service, gain more omnichannel traffic, and inform holistic business decisions.
  • Analyze the trends or patterns in the data so you can predict accurately. Ecommerce analytics help you to know better how your business is doing now and how it will perform in the future. This knowledge allows you to set up your business for success by ensuring that the right things are available when needed.
  • You are optimizing your pricing, up-selling, and sell-through strategies. With Ecommerce analytics, you can gain insights into which products drive sales and which don’t. You can then adjust prices accordingly.
  • You are personalizing individual experiences by using customer data. It’s essential to understand how customers behave when they visit your site so you can optimize your product pages and improve the buying experience for everyone.
  • Use data-based insights to inform your strategy. One additional advantage of Ecommerce analytic tools is that they provide insights into what’s going on in your business and the industry at large, which gives you an idea of what might happen next and whether there are any potential risks you need to take into account.

This list is not exhaustive but reflects a few primary areas teams look to explore.

What Do You Measure In Ecommerce Analytics?

Several areas of Ecommerce analysis allow you to understand your business and its markets better.

Audience

Have you identified your target market? Who do you want to reach? What demographic groups do you want to attract? Once you’ve identified your target market, you must analyze your audience. How old are they? Where do they come from? Which social media platforms do they use? Do they read blogs? Are they interested in specific types of news stories?

These questions will help you identify who your ideal customer is.

Next, you’ll want to find out what kind of person they are. What do they value? What motivates them? What problems do they face? What issues do they care about?

By answering these questions, you’ll be able to align your product positioning that matches their needs.

Finally, you’ll want to consider the competition. Analyze your competitor’s strengths and weaknesses. What are they doing? Why are they successful? What strategies do they employ? How do you position yourself against competitors? How does your potential customer view you?

Acquisition

You can also track customer acquisition using data related to the acquisition of customers, which helps you understand where you’re losing potential customers. It’s important because you’ll learn about how your people became aware of your products and where that occurred.

  • Do most of your traffic comes from social media posts? Instagram, Twitter, Facebook?
  • How many website visits do you generate through email marketing?
  • What does the average post convert ratio look like for your blog?
  • Does paying for Google Ads, Facebook Ads, or other paid media bring in most of the people who visit your site?

This data will help you determine which marketing channel is best for your business and where to spend your time and money.

Behavior

It would be best if you also considered looking into consumer behavior data.

  • Which product lines do customers buy?
  • How many people visit your site but close their browsers without clicking through any pages?
  • Which page do visitors usually click on first?
  • Which types of marketing content get people to take action?
  • What kinds of product ideas get lots of attention from people but don’t sell well?
  • On average, how long do visitors stay on your site?

Are your products easy to navigate? Do your customers know where to go after viewing an item? If users leave your site without finding what they’re looking for, you might have a problem with page design, content, positioning, or images. If your customers cannot figure out what they’re looking for after visiting your site, you’ll need to make changes to improve your conversion rate.

Conversions

We’ve talked about conversions but haven’t defined exactly what they mean. These are vital questions you’re asking about conversion analytics.

  • How long does it typically take for someone to become a paying customer?
  • Which type of customer converts most often?
  • Customers usually purchase items after just one visit to your online shop. However, they may return later if they don’t see something they want.
  • Repeat purchases from customers?
  • How many customers abandon shopping carts before they’re converted into paying customers?

This data is vital because it allows you to determine which discounts and deals will appeal to your current customer base. Knowing the specifics helps to inform your marketing strategy so you can decide which message to send out and how to communicate it to people best.

Paid Marketing Activities

Another critical aspect to consider when evaluating your analytics is your paid advertising efforts. This will allow you to calculate your ROI for different types of paid ads.

  • How much has your business generated from its social media ads? Does Instagram drive more revenue than Twitter?
  • Did you earn more income from the ad campaign than you spent on creative and ad spend?
  • How much has your business grown as a result of your PPC campaigns?
  • What about your email campaigns?
  • Other paid media efforts? Influencers?

If you don’t evaluate your current paid advertising efforts, you’ll only be able to invest in ads that aren’t working for your business.

For example, Amazon Advertising is the go-to for Amazon Sellers. You have direct access to campaigns, keywords, targets, ads, and many other data points for your paid media investment on Amazon.

Amazon Ads makes data available as manual downloads or via Amazon Advertising API Automation. Also, see Amazon Advertising Reports: Performance Data for a deeper dive into the available data.

How Do You Undertake Ecommerce Data Analytics?

Business metrics like average order value, revenue, and unique visitor count are important indicators of how well you’re doing. But many different types of metrics measure success across multiple channels. For example, acquisition channels are places where people find products and services online. These include social media sites, review platforms, blogs, ecommerce stores, and more.

Several KPIs exist, including transaction, revenue, customer satisfaction, and conversion.

Transaction metrics will often include:

  • Average basket size.
  • The number of products sold daily.
  • Total sales volume over a given period.

Revenue metrics have a

  • net profit margin
  • gross profit margin and
  • gross profit percentage

Customer satisfaction metrics include things like

  • customer retention rate
  • return rate, and
  • customer lifetime value

Conversion metrics have

  • cart abandonment rate
  • purchase frequency, and
  • checkout conversion rate

Marketing Channel Analysis

Marketing analytics help companies know what works and which marketing tactics are effective. This knowledge can improve product development, advertising strategies, and brand management.

A marketing channel is a way to reach customers. For example, a customer could use social media, email, text messages, billboards, TV ads, radio spots, etc., to contact you. Each channel has a different purpose and offers another type of audience.

Marketing channel analysis aims to identify where your best prospects are coming from. You do this by analyzing the data from each channel. If you find that a specific channel isn’t working for you, you’ll know exactly why. Then, you can make adjustments to improve performance.

For instance, if you find people clicking on your Facebook ad but not converting, you might adjust budgets, creative, or target audience. Or maybe you notice people sign up for your newsletter but are not engaging. In this case, you’d probably change the frequency of your emails or add additional value to your newsletter.

Each channel has metrics, including conversion, bounce, and abandonment rates. Conversion rates show a marketing campaign’s success at getting leads into the funnel. Bounce rates indicate whether someone left the site without buying anything. Abandonment rates tell how likely someone will abandon a purchase once they reach checkout.

Ecommerce Funnel Analysis

A funnel analysis gives insights into how visitors arrive in your purchase funnel, where they go, and what happens next. This exercise aims to identify opportunities to optimize your marketing and customer journey efforts. This effort will help ensure you get the maximum number of potential customers to convert.

First things first, you should identify your business’ overall objective. Once you’ve done that, go through each part of the journey and figure out how people can get from one point to another. Make sure they know what path leads where. You may discover that one area isn’t getting much traffic, so you could create an easy link to draw people towards it.

Once you’ve identified your goals, it’s time to build a funnel. Start by defining the steps involved in reaching each goal. Each step represents one stage in your funnel. In addition to the name of the action, including the URL that leads to it. Then, write down the conversions associated with each step. Finally, label each step according to whether it’s leading toward success or failure.

After completing the funnel diagram, dig into the data and analyze it. How do visitors behave once they reach your store? Are they staying on the site long enough to complete a transaction? Do they bounce away immediately? Is there a clear path from the homepage to the checkout process? Once you understand your visitors’ behavior, you can decide how to change things.

For instance, if you found that most visitors never complete their transactions, you might consider adding additional information on the home page to help them. Or, if you noticed that most of your visitors bounced away without even looking at your offers, you might try changing the layout of your offers, refining the copy, or creative to make them more compelling.

If you aren’t making it easy for your visitors to navigate through your funnel, you’ll lose a lot of potential customers.

Ecommerce Analytics Best Practices

With an understanding of how beneficial ecommerce analytics is for your business, you will now need to implement the core KPIs and tools correctly so they can help you achieve success.

Benchmarks

A benchmark is a specific target that helps you understand how well you are doing against competitors. You can use measures to establish goals, track performance, identify areas for improvement, and compare yourself to others.

Benchmarks can help you determine whether you’re meeting your objectives and provide valuable data for measuring progress. For example, you might want to know how many leads you’ve generated per month or how much revenue you’ve earned over a quarter. Benchmarking gives you a way to quantify your success and make sure you’re making good decisions.

Collect all of your marketing data from all of your different sources and channels

You may start with some messiness, but you must organize everything into one place to easily access it.

If you have been working with data manually, you are likely feeling overwhelmed. That’s okay! Make a list of where all of your data resides. Here are some examples:

  • Email providers
  • Customer relationship management platforms
  • ERPs
  • Google Ads
  • Facebook Ads
  • Amazon
  • Shopify

The good news is that this information can be easily pulled together and exported in one place. With a pre-made connection, you can get your data from any source without much work. This saves you time and effort to focus on what matters most — growing your business.

Ecommerce Analytics Tools

Thankfully, Ecommerce analytics tools provide the software to discover new opportunities while surfacing a wealth of information about your operations, visitors, and sales.

Using these tools for analyzing data, you can see how customers interact with your products and services and determine whether certain features or actions drive sales.

The best ecommerce analytics software helps your teams gain velocity in decision-making efficiently and flexibly.

An analytics tool provides insights into your current campaign performance. It lets you compare your metrics against industry benchmarks, monitor the impact of changes to your campaigns, and generate reports tailored to your needs. By analyzing your data, you can make better decisions about your marketing activities and optimize your return on investment.

Analytics tools help you analyze your data and make intelligent decisions based on those findings.

Self-Service Ecommerce and data analytics Tools

Ecommerce data analytics help businesses understand what customers want and what drives sales. There are many different ways of measuring ecommerce performance, including transaction volume, basket size, product views, and revenue per visitor. These tools collect data from the entire site and offer insight into customer behavior and conversions.

You can increase your chances of selling more products online by making better decisions.

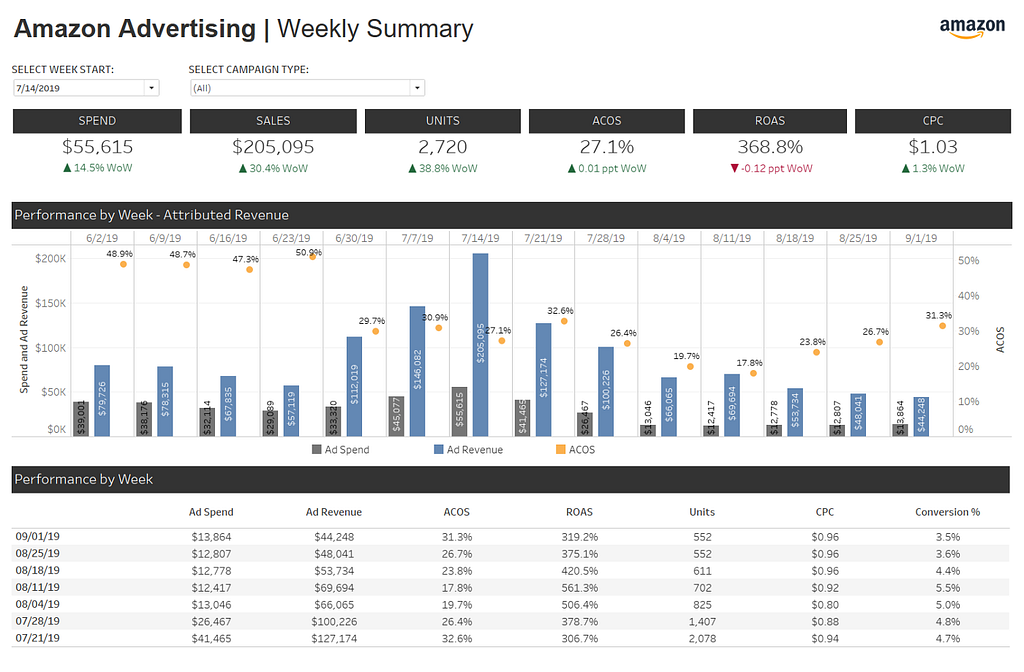
Here is an example of paid media analysis using Tableau:
In addition to media performance, you can construct a deep dive on product performance as well:
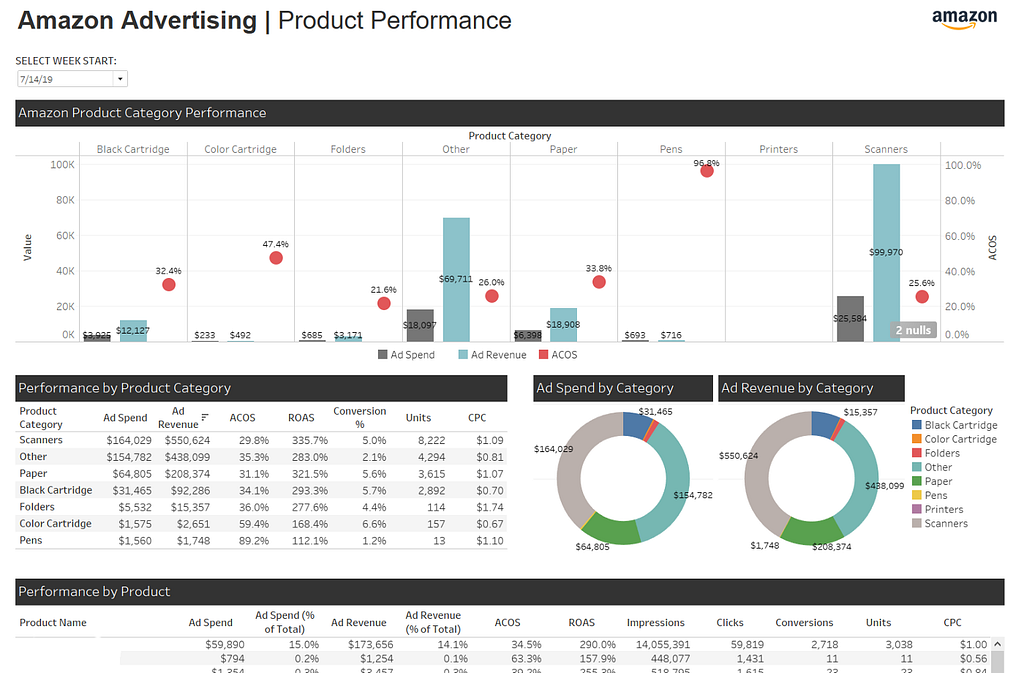
While these examples show the power and flexibility of Tableau, they demonstrate more broadly what is possible with tools like Tableau. The following is a collection of some of the best ecommerce analytics tools for self-service insights efforts;

  • Google Data Studio
  • Tableau
  • Power Bi
  • Looker
  • Sisense

The tools reflect industry leaders and the best analytics software for ecommerce for those who want to own their insights efforts. Combine these tools with your data unified in a cloud data warehouse or data lake; you create a powerhouse ecommerce analytics platform tailored to your needs.

Examples of prepackaged ecommerce analytics software

Unlike self-service tools, packaged Ecommerce analytics tools provide pre-built visualizations and reports. While less flexible, they can offer a wealth of information about your visitors and sales quickly.

These tools will often prebuild ecommerce analytics dashboards that can package KPIs and offer insight into customer behavior and conversions. They will provide different ways of measuring ecommerce performance, including transaction volume, basket size, product views, and revenue per visitor.

Here are a couple of examples of this category of tools:

Summary

Analytics in ecommerce should provide insight into your current performance and actionable recommendations that inform actionable strategies. In addition to providing valuable insights about your key metrics in campaign performance, it will show you where there are gaps, which areas need improvement, and how you optimize for ecommerce metrics that increase your ROI.

As an ecommerce business using analytics, you can make better-informed decisions that will help your business grow and succeed. From adjusting advertising investment to refining content for popular products, analytics delivers data-driven insights so you can see where your business is thriving and where it needs improvement.

You have several options when choosing an ecommerce analytics tool. However, the key is getting started. You cannot know if something is working unless you measure it.

Getting Started With Ecommerce Analytics

Unifying and owning your data allows you to build a view of sales over time, and understand buyer behavior more deeply. Data-driven insights mean your sales funnel will be full, your content strategy aligned, and traffic potential optimized.

If you are looking for data pipelines for your eCommerce data, Openbridge offers no-code, fully automated data pipelines.

Unify your eCommerce data and start your analysis journey today.

Sign up for a 30-day free trial of our fully-automated ecommerce data feeds today!


Kickstart Ecommerce Analytics: A Beginners Guide was originally published in Openbridge on Medium, where people are continuing the conversation by highlighting and responding to this story.


from Openbridge - Medium https://ift.tt/6rSOcJ7
via IFTTT

Unlocking The Power Of Digital Shelf Analytics

Discover the potential of a unified non-Amazon and Amazon digital shelf with an automated, private data shelf

The digital shelf is one of the most talked about topics in retail today. And it’s easy to see why. Digital shelves are where consumers go to find products and make purchases. They are becoming increasingly important as shoppers shift away from traditional brick-and-mortar stores. Retailers want to capitalize on this trend by creating a seamless experience across channels.

But most companies aren’t taking full advantage of their “data shelf” for performance insights. A survey by Shopify stated that only one in five retailers use a digital shelf strategy and digital shelf analytics. And many of those who do, admit they don’t fully capitalize on the opportunity.

So why are some businesses still missing out on an opportunity? Because they haven’t taken advantage of the data at their fingertips to fuel their digital shelf analytics.

What Is a Digital Shelf?

The broadest of the digital shelf is that it reflects the shopper’s journey. As a result, a digital shelf demonstrates a collection of product images, emails, videos, reviews, ratings, price information, social media posts, etc., displayed prominently in a shopping experience aligned with your channels.

These elements help customers discover products and learn more about them. For example, Amazon displays product images, customer reviews, and prices on its site. Walmart uses similar tactics to display product information and photos.

How Does a Strong Digital Shelf Help Increase Sales?

A strong digital shelf often reflects a robust shopper experience strategy. This includes a comprehensive digital marketing model that reflects the broader customer journey, from an advertising strategy, social, merchandising, and targeting the right keywords in your SEO strategy.

A robust digital shelf improves consideration, and brand awareness helps reduce abandonment rates and increases conversion rates. Here are a few core benefits of an insights-driven digital shelf;

  • Improves your cross-channel marketing efforts and connects them to the user and company goals. Don’t rely solely on upper-funnels metrics for your different marketing campaigns. Get a full-funnel perspective of how your marketing strategies benefit your users and company regardless of which campaign they’re part of.
  • Delivers digital self insights, you’ll discover new ways to engage with shoppers on and off Amazon to increase product consideration, sales volume, and conversion rates.
  • Whether your campaigns are paid or organic, you can make in-flight optimizations, informed by Amazon conversion reporting, to ensure your strategies effectively and efficiently drive sales.
  • Understand which parts of your business are driving sales performance so you can optimize future products and campaigns with the insights needed to be successful.

How Do You Understand The Digital Shelf on Amazon (and off Amazon)?

The Amazon digital shelf is a collection of product detail pages, reviews, images, videos, ads, and other information about products that are displayed on Amazon.

Marketing, social, and shopper engagement off Amazon also drives to your listings so this is a critical part of your shelf. These items help shoppers become aware of your products and make better decisions about what to buy and when to buy, including repeat purchases.

Brands should understand the importance of the Amazon digital shelf because it provides a way to connect with consumers where they’re looking. Amazon provides brands with opportunities to interact with consumers in ways that go beyond traditional advertising. For example, Amazon Attribution provides insight into how brands’ non-Amazon marketing channels (social, organic, direct, and email marketing…) impact digital shelf performance on Amazon.

The following are various aspects of the Amazon digital shelf that contain key metrics for different aspects of the shopper journey;

Amazon Sponsored Advertising

Amazon Advertising offers Sponsored Products, Sponsored Brands, Sponsored Display, Stores, and Video Ads. The services cover a gamut of Ad related activities like relevant keywords, search ads, product display ads, sponsored product ads, and many others.

This data is available as manual downloads or via Amazon Advertising API Automation. Also, see Amazon Advertising Reports: Performance Data for a deeper dive into the available data.

Amazon DSP (Demand Side Platform)

Allows advertisers to buy high-quality Amazon search, display advertising, video ads, brand awareness, and audio ads on and off Amazon at scale to target a relevant audience in real time.

See How To Unlock Amazon DSP Insights, Reporting, & Optimization

Amazon Attribution

Extends the reach of your digital shelf marketing efforts to non-Amazon channels. It allows you to understand better purchase rates and customer journeys to optimize digital marketing strategies and advertising channel effectiveness.

See Why Amazon Attribution Reporting Data Supercharges Insights

Amazon Retail Analytics

Amazon offers an incredibly robust array of data on retail product performance. They get you the data you need to go deep from orders, returns, inventory, and fulfillment.

  • Amazon Inventory: Get FBA Inventory Reports data for the listing, condition, disposition, and quantity to help with day-to-day inventory.
  • Amazon Fulfillment: Get complete, product-level detail on inbound shipments, shipped FBA orders, quantity, tracking, and shipping with FBA Fulfillment Reports and Inbound Fulfillment API.
  • Amazon Orders: Online orders and item information for both FBA and seller-fulfilled orders, including order status, fulfillment and sales channel information, and item details with Order API and FBA Orders Reports.
  • Amazon Finance: Balances, payouts, estimated and actual selling, storage, and fulfillment fee data with FBA Settlement Reports, FBA Fees, and Finance API
  • Retail Analytics: Vendor Retail Analytics delivers ordered revenue, glance views, conversion, replenishable out-of-stock, lost buy box, returns, replacements, and many more.

For automated sales reporting data feeds, see Amazon Seller Central Sales Report Automation. If you are unclear about which of the many sales and order reports is suitable for you, check out our breakdown “Understanding Amazon Order and Sales Reports.”

Amazon Search Terms

The reports provide valuable insights into customer behavior, ranking position, and unit sales in search results which can help you understand product visibility and develop more effective marketing strategies and strategic decisions that drive product sales.

Discover performance-focused keyword ideas, and identify key search terms that meet business objectives. Uncover product details and top keywords your competitors are targeting, and many more so you can trend activity over time.

If you are looking for automated search keyword data feeds, see Direct, Automated Amazon Search Volume Data, and Amazon Brand Analytics Search Terms: Untapped Potential. Also, we detailed the importance of keywords in the posts Why Amazon Brand Analytics Fuels Growth and digital shelf metrics for brands in Amazon KPI Metrics For Advertising + Marketing.

Amazon Sales and Traffic

Business level Sales and Traffic reports offer performance metrics for product sales, revenue, units ordered, and page traffic metrics such as page views and buy box. Amazon now offers these reports via their API for complete automation; see automation of Amazon Detail Page Sales and Traffic Business Reports.

Amazon Brand Stores

Amazon brand stores give third-party sellers access to a tool to package, present, and sell products directly through the e-commerce giant. Brands can choose whether to use a branded product listing or a custom listing. They can also add images, videos, reviews, and pricing information to their listings.

What Is Digital Shelf Monitoring?

Digital shelf monitoring allows retailers to track performance and product trends over time. This information can help retailers determine whether certain items are selling well online or offline and provide insight into promotional effectiveness.

For example, you can use Google Data Studio + Amazon Seller Central data to create dashboards, reports, and visualizations that provide a rich, tailored view of your private data shelf.

Why Monitor Your Digital Shelf

Here are a couple of benefits of keeping tabs on your digital shelf in your efforts to capture the next sale;

  • Uncover where you are missing out on potential sales opportunities and double down on marketing tactics that drive performance.
  • Optimize product tiles, product descriptions, product page design, or other elements of your product content in listings, ads, or social posts.
  • Minimize any blind spot trying to understand the impact Google Ads (formerly Google AdWords), Facebook, and Microsoft Ads…have in driving potential customers’ shopping activity on Amazon.
  • Understand sales attribution, audience strategies, and opportunities for optimizing additional products into a conversion funnel.
  • Make multi-channel campaign recommendations and optimizations using on-demand insights to accelerate e-commerce marketing efforts.
  • Explore competitor threats with trending, first-party search data directly from Amazon, including market share for keywords and products.
  • Leveraging conversion insights can inform automated bid and budget optimizations to provide valuable insight to improve your campaign ROI.
  • Use data to drive changes and optimize an account or campaign-level marketing plan.

What Is Digital Shelf Analytics?

Digital shelf analytics allows merchants the ability to analyze consumer interactions with products on the shelf. This includes everything from product reviews to social media mentions.

Even if you are only focused on Amazon as your sales channel, understanding the efficiency and effectiveness of your digital shelf concerning who and when people buy your products is essential to any detailed sales impact analysis your team may undertake.

Private, Digital Shelf Analytics Software Owned By You

Your digital shelf analytics suite can be as simple as the tools you may already be using for reporting and analytics!

Brands can now automate Amazon Digital Shelf data collection into a private, trusted data shelf. Rather than leveraging proprietary digital shelf analytics providers, you can take control and own your data.

Direct, automated access to your digital shelf data allows you to use your favorite business intelligence, data visualization, SQL, or data science tools like Google Data Studio, Tableau, Microsoft Power BI, Looker, or Amazon Quicksight to perform digital shelf analytics. Create customized traffic dashboards, track spending on advertising campaigns, or additional reports that allow you to build competitive shelf intelligence.

Data Impact: Unify And Own Your Data To Fuel Your Digital Shelf Optimization Efforts

With direct access to the digital shelf data, you can undertake an in-depth or comparative analysis across brands, define actionable insights, or use direct access to campaign reporting to optimize marketing efforts.

  1. Unify your data shelf into a leading data lake or cloud warehouses like Amazon Redshift, Amazon Redshift Spectrum, Google BigQuery, Snowflake, Azure Data Lake, Ahana, and Amazon Athena for a unified, analytics-ready single source of truth to fuel informed decisions on product, media, and customer demand
  2. With digital shelf data unified and accessible, quickly optimize for poor conversion rates, identify gaps in operational performance, uncover the percentage of customers converting, refining advertising efforts on and off Amazon, or discover key customer metrics that impact purchase decisions.

Get Started Now With Digital Shelf Analytics

Harnessing your data shelf reflects true impact data, or data that can fuel insights driven growth.

In a fast-paced e-commerce environment, an online retailer’s digital strategy can not succeed by relying on manual, error-prone, and inaccurate data. Supercharge omnichannel analytics solutions like Tableau, Power Bi, Google Data Studio, Looker, and many others with direct, automated digital shelf data. Digital shelf insights with these tools are convenient, fast, and always owned by you.

Your competition is using a private, first-party digital shelf analytics platform as a competitive advantage, and so should you.

Unify your shelf and start your data impact analysis journey today.

Sign up for a 30-day free trial of our fully-automated data shelf feeds today!


Unlocking The Power Of Digital Shelf Analytics was originally published in Openbridge on Medium, where people are continuing the conversation by highlighting and responding to this story.


from Openbridge - Medium https://ift.tt/e7nJ5MF
via IFTTT

How To Check Sales Volume On Amazon

Unlock Amazon Sales Volume data for automated performance reporting

As an online business, Amazon sellers face the constant challenge of competing against millions of other products in its marketplace.

Do you want to know what products sell well on Amazon? How can you find out which items sell best on Amazon? Are you looking to profit from selling your favorite products on Amazon? Do you want to understand your detailed reports for product sales by ASIN, search volumes for product categories, new product niches, and comprehensive sales reports?

Understanding Amazon sales volume is essential for sellers to calculate performance. Thankfully, Amazon provides a broad range of resources, sometimes confusing, for sellers to understand sales volume.

We will cover three core report types for sales volume:

  • Order Tracking Reports
  • Sales and Traffic Reports
  • Settlement Reports

If you are unclear about which of the many sales and order reports is suitable for you, check out our breakdown “Understanding Amazon Order and Sales Reports

How To Access Amazon Retail Sales (Order) Reports

To access your sale data, click on the “Reports” tab in your Seller Central account. Then select “Fulfillment->Sales-> All Order Reports.” You can choose to download a .csv file from this page.

  1. Sign in to your Amazon Seller Central account.
  2. Click the Reports menu, and then click Fulfillment
  3. Next, select Sales and All Orders
  4. The Order by Order data and Order by Last Update tab will show a view of your sales.
  5. Click Download for Selected Period.
  6. Save the file on your hard drive.

For automated sales reporting data feeds, see Amazon Seller Central Sales Report Automation.

How To Access Amazon Sales and Traffic “Business Reports.”

Business Reports include a Sales Dashboard, Business Reports by Date, and Business Reports by ASIN.

  1. Sign in to your Amazon Seller Central account.
  2. Click the Reports menu, and then click Business. The Detail Page Sales and Traffic tab will show a view of your sales.
  3. Click Download CSV for Selected Period.
  4. Save the file on your hard drive.

Amazon now offers these reports via their API for complete automation; see automation of Amazon Detail Page Sales and Traffic Business Reports.

How To Access Amazon Settlement Reports

Use the following steps to download a settlement report from your seller central account:

  1. Sign in to your Amazon Pay account on Seller Central.
  2. Click the Reports menu, and then click Payments. The Statement View tab shows a view of your current open Settlement.
  3. Click Download Flat File V2 against Settlement Period.
  4. Save the file on your hard drive.

Not sure what a Settlement Report is? See Understanding Amazon Settlement Reports.

Understanding Different Amazon Sales Metrics

Amazon uses several different report types and metrics to measure how much inventory sells during a day, week, or month. These metrics are vital to understanding how fast or slow your Business is growing, but they aren’t equally helpful in tracking trends and managing growth. Here are a just few metrics available in various reports:

  • Sales rank
  • Seller rank
  • Units sold
  • Sales estimate (pending orders vs. shipped orders)
  • Product rank

Typically, you can get the sales data via the UI, manual CSV or Excel report downloads, or via API.

You can use these exports to explore detailed sales history, sales trends, sales per day, sales over 12 months, and other views.

Instead of manual exports, you can automate sales volume data with the Amazon API, allowing you to use advanced tools like Google Data Studio, Tableau, Microsoft Power BI, Looker, or Amazon Quicksight

Here are a few approaches to parsing the data so you can understand actual sales volume.

Daily Sales Volume Metrics

Daily sales volume is one of the most commonly reported and tracked metrics related to Amazon product listings. By reporting daily sales volume, Amazon indicates how quickly your listings sell out.

Weekly Sales Volume Metrics

Weekly sales volume is another widely-used metric, particularly among small businesses. To calculate weekly sales volume, multiply the number of days in a week by the unit price per listing. After accounting for shipping costs, fees, etc., you’ll receive a figure representing the total amount of money made.

Monthly Sales Volume Metrics

Monthly sales volume is similar to weekly sales volume, except it reports how much income was generated over a monthly period instead of a weekly period. To calculate monthly sales volume, multiply daily sales volume by 7. Because we’ve assumed seven days make up one month, dividing the result by 365 gives you the total number of units sold that month.

Other Sources Of Amazon Sales Volume

If you are using Amazon Advertising, they will provide sales volume by a campaign, keyword, and other report types. This data is available as manual downloads or via Amazon Advertising API Automation.

Another source of data is Amazon Brand Analytics. You can get keyword data for Amazon Retail categories, allowing you to get direct insight into the level of competition for SKUs and categories. This can be a tremendous resource for new keyword ideas or optimizations to product listings.

To manually download the search data, see How to download the Amazon Search Terms report.

If you are looking for automated search keyword data feeds, see Direct, Automated Amazon Search Volume Data, and Amazon Brand Analytics Search Terms: Untapped Potential.

Conclusion

There are several ways that Amazon provides sales data. This information is essential because it helps you to plan and manage your inventory more efficiently. Using sales data will give you the confidence to take on any e-commerce business challenges that come your way

Getting Started With Amazon Sales Volume Automation

Unifying and owing your data allows you to build a view of sales over time, understand buyer behavior more deeply, or trending monthly traffic patterns. Data-driven insights mean your sales funnel will be full, your content strategy aligned, and traffic potential optimized.

If you are looking to automate your Amazon business analytics reports, Openbridge offers no-code, fully automated data pipelines;

With data automation in place, you can understand and optimize your digital marketing strategy, and efficiently grow your existing customer base while identifying ideal customers that drive revenue. Informed decisions are within reach with automation for all of the critical types of reports you have come to rely on.

Try our Amazon Selling Partner API Sales volume data integration today with a 30-day free trial!


How To Check Sales Volume On Amazon was originally published in Openbridge on Medium, where people are continuing the conversation by highlighting and responding to this story.


from Openbridge - Medium https://ift.tt/flckJ9K
via IFTTT

Direct, Automated Amazon Search Volume Data

Amazon Search Volume API

How direct access to the Amazon Search Volume API fuels data-driven performance

Amazon search volume data is an essential data set containing metrics that determine a keyword’s popularity. Understanding how people search for specific products or services can help you craft a product title, product descriptions, or optimizations to your online marketing that will resonate with a target audience.

Did you know that Amazon now makes search volume data available via API? They do!

What is Amazon search volume data?

Amazon search volume data is the total number of searches conducted on Amazon, across a number of categories, in a given period. The search volume data is collected and supplied by Amazon, which makes it the most reliable source of keyword data for Amazon customers.

The great thing about Amazon search volume data is that it’s available for all product categories via Amazon Brand Analytics. Amazon Seller Central and Vendor Central have direct access to the Amazon Search Volume API via Brand Analytics.

Why does Amazon search volume data matter?

As you plan your product content and Amazon campaigns, you must have a complete picture of your target keywords and what they mean for your business. Amazon search volume data can help you here by providing:

  • keyword ideas that are based on current or long-term historical trends based on search data.
  • a glimpse into how much competition there is on a given keyword (and also how many people are buying products that include that keyword in their title)
  • an idea of how much traffic those keywords might bring in will let you decide if they’re worth investing in
  • an indication of whether or not your keyword strategy on Amazon provides the impact you expected for organic and PPC search.

For more information on the benefits, see Amazon Brand Analytics Search Terms: Untapped Potential. Also, we detailed the importance of keywords in the posts Why Amazon Brand Analytics Fuels Growth and Amazon KPI Metrics For Advertising + Marketing.

How accurate is Amazon search volume data?

Unlike Google Ads based tools, this search data is 100% sourced from Amazon. While the Google keyword planner tool approximates interest in a topic, the Amazon search data reflects those relevant keywords to customers and categories.

As a result, Amazon search terms are based on actual, real-world search behaviors of users and products. For example, suppose you have 5 million users who search for “windshield wipers” every month and 1 million different items (each with their price) that apply to this term. In that case, the search volume for windshield wipers will be about 5 million searches per month.

This number does not mean that every single one of these 5 million different people was looking at windshield wipers. It only means that out of the entire population of Amazon customers who searched for something during this period, 1% looked at windshield wipers.

Amazon Keyword Search Volume API

The keyword volume API allows you to query the current search volume of a specified set of keywords for any given country. The API enables direct, automated access to keyword search volumes on Amazon.

The Amazon Search Volume API allows you to track and monitor the keyword search volume of products on Amazon. The API returns a rich, in-depth data set of metrics and dimensions, which you can then use to estimate the popularity of a product or an item in your business.

Why use the Amazon Search Volume Data API?

The data is based on actual results in Amazon search, so it’s a reliable resource to understand what people have been searching for about your product category over time. Understanding what search results may be shown to Amazon customers can assist you in product research, understand the competition, identify long tail keywords, and offer new keyword suggestions to the Amazon Ads team for PPC.

Use this data to enhance your SEO strategy by discovering which phrases people commonly use on Amazon, then optimize your content accordingly!

This can be an invaluable dataset for marketers and SEOs who want to improve their performance for their clients. The Amazon Search volume data is perfect for data-driven Amazon Sellers or Vendors. The Search API offers direct, first-party data on search behavior on Amazon.

What are the alternatives to the Amazon Search Volume API?

We don’t recommend using any tool other than manually exporting Amazon search data. The alternatives can involve unethical practices that violate Amazon AUP and DPP. For example, commercial vendors may be web and data scraping Amazon, not official or certified Amazon APIs. We only use official, verified Amazon APIs. See our Bot Free Promise.

Manually Downloading Search Volume Data

If you want to skip the use of an API, you can manually download the data. See this post to learn more about How to download the Amazon Search Terms report.

Conclusion

A key benefit of using the AP as your private Amazon Search Terms tool is that it saves time when working with large amounts of keywords by eliminating manual research efforts from multiple third-party sources.

The use of the Amazon Search API opens new opportunities for automation. Direct, search volume data from the API allows your team to quickly get data critical to optimize long tail keywords, find the right keyword to fuel sales, undertake competitive product research, or create a private keyword tracker to improve a product listing.

  1. Take control of by storing high search volume data based on Amazon customers into industry-leading data destinations like Amazon Redshift, Amazon Redshift Spectrum, Google BigQuery, Snowflake, Azure Data Lake, and Amazon Athena.
  2. With search term data consolidated, use your favorite business intelligence, data visualization, SQL, or data science tools like Google Data Studio, Tableau, Microsoft Power BI, Looker, or Amazon Quicksight?
  3. If you’re using Excel or Access, then there are also some plugins available that allow you to query this data directly from within your spreadsheet application using an SQL query.

Get Started — For Free

Avoid the messy, manual report download process or third-party bots and scraping tools. Tapping into the Amazon Amazon Search Volume API is a must for automating a workflow that supercharges data-driven business decisions. The official Amazon SP-API offers Sellers and Vendor direct, automated access to search data.

Optimize existing keywords for Amazon Advertising search terms, optimize product performance, discover new potential keywords, or enhance product relevance in search queries. You can pair the search data with Amazon Ads data, or other reports and metrics like Amazon glance views.

Get a fully-automated, code-free Amazon search volume data today!

Sign up for a 30-day free trial of our fully-automated Amazon Search Term data pipeline today!

Frequency Asked Questions

What is a long tail keywords Amazon?

Long-tail keywords are more specific keywords and are less competitive.

What are search terms?

Search terms are keywords used by search engines for lexical matching between an ASIN and a query.

What are Amazon backend keywords?

Amazon backend keywords are hidden phrases or search terms that are invisible to buyers.

What are Indexing and Ranking?

A keyword is successfully indexed by Amazon’s algorithm when it appears against user search.

How do you rank products?

Amazon’s algorithm considers multiple factors when deciding how to rank products within a particular niche.

What are Front End keywords?

Front-end keywords are the phrases found on your product listing.

What is the A9 algorithm?

The A9 algorithm looks at how your products perform on Amazon in its keyword category to rank their appearance in the results.

What are the benefits of adding backend keywords to Amazon listings?

Just as HTML tags increase visibility in a search engine context, adding backend keywords to Amazon listings similarly increases your impressions on Amazon.

What is the difference between a PPC ad and an Amazon search?

Amazon will not index every backend keyword you include in every ad, including PPC ads, that you create.

What are the common mistakes in product listings?

This includes posting your listing on the wrong product category, using the wrong gender, or using words out of context. Create content that is excessively long Include statements that are time-dependent like “available now,” “on-sale,” or “new” Include subjective words like “good quality” and “amazing.”

Use misspelled product names regardless if they are highly competitive keywords. Include any variations in pluralization, capitalization, punctuation, or spacing. Include words that are offensive or abusive.

Example:

  • Product Name: Vans skate shoes
  • Keyword: VansExplanation: The keyword used is a brand identifier

Direct, Automated Amazon Search Volume Data was originally published in Openbridge on Medium, where people are continuing the conversation by highlighting and responding to this story.


from Openbridge - Medium https://ift.tt/AxWruV7
via IFTTT

How To Use Amazon’s Glance View As A Key Performance Metric

Leverage Glance View Metrics To Deliver Insights For Product And Ad Optimizations

In this article, we will cover an important collection of critical metrics for merchants on Amazon vital to understanding your e-commerce strategies’ success.

What Is A “Glance View”?

Glance views are considered an essential metric for e-commerce performance. Why? It gives you a way to track how many people are looking at each product in your store, which lets you measure how many potential customers may be in the market for that item and how they may be converting.

While Glance view metrics can vary based on various platforms and the specific inputs or filters applied to those metrics, as a general rule these views reflect a level of consumer awareness and consideration for a product.

For example, advertising may track impressions and clicks to evaluate the efficacy of an ad that takes the customer to the shelf. However, once the consumer arrives at the product page, you want to understand the impact. This is where this metric comes into play so you can better understand the interest and what percentage of those interested in your product listings convert.

What Are Glance Views On Amazon?

While the metric has applications off Amazon, it is widely used on Amazon Seller Central, Vendor Central, and Amazon Ads to assess performance.

Glance views on Amazon provide insights into the directional demand for a product. As a result, this metric allows a Vendor to track glance views by product for their entire catalog. For example, Vendor Central Retail Analytics tracks customer traffic to a detail page where Amazon Retail product is the featured offer. The metric reflects there was an opportunity to convert consumers from interest to purchase.

This metric is calculated at the ASIN level and only when Amazon Retail is the featured merchant. As a result, these are precious ASIN-specific insights for Vendors (and Sellers). By exposing raw glance views in reports, Amazon provides Vendors with the traffic data where Amazon Retail had the opportunity to convert a sale.

What is a Fast Track Glance View?

When a product is listed as a “Fast Track” item, customers can see it while browsing other products. Amazon tracks the percentage of customers clicking on the product detail page, indicating customer intent.

Glance Views vs. Impressions

  • Glance Views show the number of times a Product Detail Page is viewed.
  • Impressions reflect the number of people shown a specific creative (text, image, video, etc.). Impressions are most commonly associated with Amazon Ads or ad platforms off Amazon like Google or Facebook.

Why Do Glance Views On Amazon Matter?

The metric is one of the most important metrics used by Amazon to make decisions about what products are placed in the buy box and what goes into replenishment.

This metric tells a merchant whether they optimize their inventory correctly for the customer’s needs or if their content is aligned to drive conversions. Amazon uses this metric to decide which items should go into the buy box and which products should go straight into the buy box fast track.

You can use this metric to improve your merchandising strategy. In addition to helping you manage inventory, it helps optimize a merchandising strategy. Knowing where customers spend their time, you can adjust your merchandising strategies accordingly.

Your content and inventory must be optimized for your customer’s needs. When you optimize both, you ensure that each item is priced correctly, described in a manner that creates demand and stocked appropriately. As a result, content and inventory optimization is key to increasing your sales.

If your content and inventory aren’t optimized, you’ll never know why some products sell well while others don’t.

Where To Find Glances Views?

Sales Diagnostic

With the release of Amazon Retail Analytics for Vendors, direct access to the data is now possible without complex EDI integrations. Originally part of ARA Premium, the information is now available via the Selling Partner API. The collection of reports allows Vendors to identify opportunities by determining what contributes to sales performance quickly.

  • Ordered Revenue: Ordered Product Sales in the selected time frame. Adjustments are made for returns.
  • Ordered Units Number of units ordered by Amazon customers.
  • Average Sales Price Average price per ordered unit.
  • Customer views of a product detail page.
  • Conversion Rate The purchase rate of customers viewing your products.
  • Rep OOS Replenishable Out Of Stock. Product received when it was out of stock but replenishable as a % of total product.
  • Lost Featured Offer (LFO) Price Lost Featured Offer due to price when the product is in stock.

Amazon Advertising Glance Views

Amazon Ads provides visibility across digital sales channel drivers. In addition to Vendor Retail Analytics, Amazon Advertising Sponsored Display reports also include glance metrics as a critical Amazon Advertising KPIs. This metric can then be paired with other advertising metrics such as ACOS, orders, and detail page views. Combined, these metrics provide a holistic view of your advertising efforts for Sellers and Vendors alike.

How To Increase Glance Views On Amazon?

The key to increasing performance is understanding what it is measuring, which is awareness and consideration. The metrics apply to your entire catalog, which means you can that interest and awareness reflect organic conversion rate metrics. This will also apply to those marketing campaigns designed to drive traffic to your brand and products.

So putting this into a broader context and strategy is needed. Looking holistically at the consumer journey will provide a robust data set to undertake meaningful optimizations to improve performance.

As a result, extending your Amazon Glance view definition with custom conversion rate metrics is important. For example, using standard calculations, you can calculate various conversion metrics in almost any data tool. Look at your broader sales diagnostics reports, ads campaign reports, search traffic, and attribution data for anything “off-Amazon” that drives traffic. Combined, this will allow you to refine an approach that increases views and converstions.

While these metrics may vary, below is a collection of simple, easy-to-use calculations you can include in your favorite tools like Google Data Studio, Tableau, Microsoft Power BI, Looker, Amazon QuickSight, SAP, Alteryx, dbt, Azure Data Factory, or Qlik Sense.

  1. Product conversion rate = Total Orders / Customer views
  2. % Replenishable Out of Stock = (when the item was Out of stock / Total customer views)*100
  3. % Vendor Buy Box Fast Track = (Views with a Fast Track offer / Total customer views)*100
  4. % Vendor Replenishable Buy Box Fast Track = (Fast Track customer views on Replenishable Items / Total customer views on Replenishable Items)*100
  5. % Views on Non-Replenishable Items = (Customer views on non-replenishable items / Total customer views of your items)*100

Amazon Brand Analytics Reports offer additional context, such as providing actionable insights on organic traffic search traffic. Combine that data with Amazon Vendor Central Retail Analytics reports for critical metrics on Amazon daily traffic to detail pages, sales, and conversions.

Summary

Amazon supplied data means you gain first-party insights into product performance without relying on third parties. Tapping into the automated data feeds offers teams a new opportunity to perform low-level diagnostic insights that drive product sales or better understand campaign impact on sales.

Amazon makes the data available via daily updates. You can manually download an excel or CSV file type or automate the flow of this data. Why automate? With direct access to the reporting data, you can undertake an in-depth analysis or comparative analysis across brands or use direct access to campaign reporting to optimize marketing efforts.

  1. Unify your Vendor Reports into a leading data lake or cloud warehouses like Amazon Redshift, Amazon Redshift Spectrum, Google BigQuery, Snowflake, Azure Data Lake, Ahana, and Amazon Athena for a unified, analytics-ready single source of truth to fuel informed decisions on product, media, and customer demand
  2. With data unified and accessible, quickly optimize for poor conversion rates, identify gaps in operational performance, uncover the percentage of customers converting, refining advertising efforts on and off Amazon, or discover key customer metrics that impact purchase decisions.

Sign up for a 30-day free trial of our fully-automated Amazon Glance View data feeds today!

References


How To Use Amazon’s Glance View As A Key Performance Metric was originally published in Openbridge on Medium, where people are continuing the conversation by highlighting and responding to this story.


from Openbridge - Medium https://ift.tt/6AuBXt2
via IFTTT

Secret To Unlocking Amazon Vendor Central Reports

Data Automation: Seller Central and Vendor Central APIs

What Does The Best Amazon Vendor Central Analtyics Opportunities Look Like? 3 Critical Examples

Until recently, there was no modern Amazon Vendor Central API. This made reporting manual and messy. Also, the legacy Amazon Vendor Central EDI was one of the common reasons Vendors required significant technology investments due to the complexity of that platform.

Amazon Vendor Central (Vendor Central) now offers merchants access to 3 core categories of detailed reporting about their products and sales performance across multiple channels. This is made largely possible due to the release of a new, modern Amazon SP-API for Vendors. The new API has opened new opportunities to harness data compared to the legacy Vendor system, which was a complex platform to work with. Like Vendors, a similar migration Amazon MWS: Transition to SP-API occurred for Sellers.

As a result of the new API, Amazon Vendor Central data is more accessible, allowing you to use this information to make better decisions about how to run your business.

However, understanding the types of metrics and reports offered by Vendor Central can be challenging. We’ve been working hard to simplify the process of analyzing Vendor Central reports and making sense of the data.

3 Types Of Amazon Vendor Central Reports

Amazon provides a comprehensive collection of data points that help you to make better decisions about the performance of your e-commerce business.

Vendors can use Vendor Central reports to track demand level, and external traffic to your Brand, or generate insights into customer experiences that allow your team to make informed product and media investment decisions.

There are three principle groups of Vendor Reports;

  1. Amazon Advertising
  2. Brand Analytics Reports
  3. Vendor Retail Analytics Reports

Even though Amazon Vendor Central data may not cover the same collection reports available to Sellers, it is more extensive than ever. Unlike Amazon Seller Central Reports, Vendor Central does not offer detailed reports on listings, fulfillment, Inventory Health, Settlement reports, or which fulfillment centers a product is shipped from.

Much of what is found in the (2) (3) analytics reports was part of Amazon Vendor Central’s Amazon Retail Analytics Premium. While the new API opens new pathways to efficient data access, some reports require registration and approval by Amazon. Most Amazon Brand Analytics requires that your Brand is registered in the Amazon Brand Registry. To enroll in Brand Registry, go to the eligibility page: https://brandservices.amazon.com/eligibility

1. Amazon Ads

Amazon offers a full-featured advertising solution for both sellers and vendors to connect with potential customers to stimulate demand, build product awareness, and undertake a deep dive into a target audience for your Brand.

While the Amazon Advertising Console and Amazon Seller Central Dashboard provide insight on products, keywords, and creative performance, the true power of your Amazon vendor central analytics efforts comes to life when you tap into the data behind the advertising reports. Specifically, their data from the Amazon Advertising API.

  1. Amazon Sponsored Brands
  2. Amazon Sponsored Products
  3. Amazon Sponsored Display
  4. Amazon Attribution
  5. Amazon DSP
  6. Amazon Marketing Stream

Reports operate on a daily time frame, except for streams which are hourly. The data from the API offers a detailed picture of your media investments, with a maximum reporting period of 60 to 90 days for lookback windows.

Here is what Amazon says on the topic;

Conversion data is refreshed and validated at daily, weekly, and monthly intervals, and is subject to change for up to 60 days back from the current date. We recommend re-retrieving reports monthly to ensure your conversion metrics are up to date.

2. Vendor Brand Analytics

What was once known as “ARA Premium” is now called “Brand Analytics”.

Per Amazon;

Brand Analytics reports cover in-depth sales, marketing, operations, customer behavior, and enhanced trends to enable you to make more informed business decisions, assess your market share, identify new opportunities, and monitor factors that affect sales.

The change to the new API created more consistency with Amazon Seller Central which ensures the programs offered on the two platforms are more consistent.

There are five core report types, two of which have been removed as of June 30, 2022.

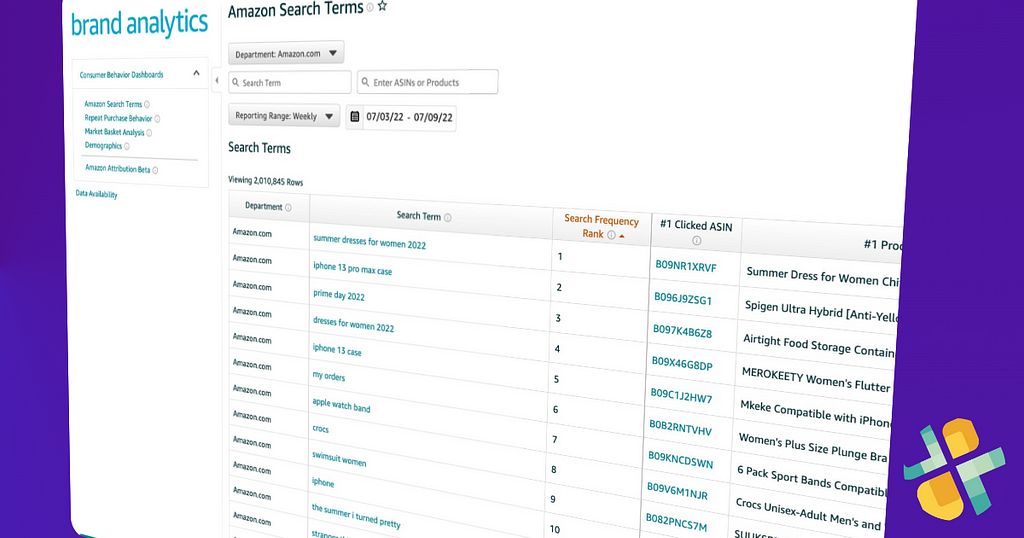
  1. Amazon Search Term Report helps you determine what keywords people use to look up your product and product category. This report gives insights into how often people search for your product and what words they type into the search bar. You can even see if specific terms increase or decrease over time. This can also provide insights into a competitive product listing and market share.
  2. Repeat Purchase Report helps you identify repeat purchases. If someone buys something weekly, it could mean she likes your product. Or perhaps she purchased the same thing because her friends recommended it. Either way, knowing this detail can help you market to her better.
  3. Market Basket Analysis lets you see if there are any trends in your customer base. For example, if everyone is buying one particular product, you may want to add another similar one. Alternately, you might consider dropping prices if no one is buying anything.
  4. Item Comparison reports let you compare your product to others. Are customers buying yours more frequently than competitors? Do they purchase different sizes or colors? Knowing this data can help you improve your marketing strategy. This report was deprecated (removed) on June 30, 2022.
  5. Alternate Purchases reports show you what products consumers are buying instead of yours. If someone isn’t buying your product, he’s looking for something else. By seeing his alternatives, you can ensure you’re offering the best value. This report was deprecated (removed) on June 30, 2022.

We go into each report in more detail below.

Amazon Search Terms Report

Here is Amazon’s description;

“Discover which products win the most clicks and conversions on strategic search terms. Assess the impact of your marketing campaigns by monitoring trends.”

The Amazon Search Terms Report provides data about how people search for products on Amazon. You can use it to identify popular terms, discover trends over time, and learn what works best for your Brand.

Manual or automated, learn how to download the Amazon Search Terms report.

Repeat Purchase Behavior

Here is Amazon’s description;

“Better strategize and assess your marketing campaigns to drive repeat purchases and acquire new customers.”

The report includes information on how often people make repeat purchases, whether they repurchase the same item, and even what day of the week they typically make repeat purchases. You can use this data to improve your marketing strategy and increase sales.

Market Basket Analysis

Here is Amazon’s description;

“Identify cross-selling and bundling opportunities by gaining insight into products that are being purchased together by your customers.”

Marketing experts recommend market basket analysis as one way to understand what products consumers buy together. A market basket analysis helps you determine how often certain items are purchased together and whether there are opportunities to sell related products. You can use this information to build better marketing campaigns and offer cross-selling opportunities.

3. Vendor Retail Analytics Reports

As of March 23, 2022, new Vendor retail analytics report types are available through the Selling Partner Application Programming Interface (SP-API). Amazon is replacing the existing EDI Sales and Inventory report and Forecast report with new API Sales, Inventory, and Forecasting reports.

Per Amazon;

Vendor Retail Analytics report types are replacing the existing EDI Sales (X12 852, EDIFACT SLSRPT) and Forecast (X12 830, EDIFACT DELFOR) reports.

Amazon Retail Analytics or ARA provides you with the data you need to manage and grow your business with Amazon Retail. The data allows you to create custom performance dashboards so you can monitor your Amazon retail KPIs, evaluate your performance, identify operational improvement opportunities, and glean valuable insights to shape your business strategy.

For reference, here is a sample mapping of the legacy Amazon Retail Analytics EDI transactions to API report types:

  • Sales diagnostic: Sales (X12 852, EDIFACT SLSRPT) To GET_VENDOR_SALES_REPORT
  • Inventory health & planning: Sales (X12 852, EDIFACT SLSRPT) ->GET_VENDOR_INVENTORY_REPORT
  • Forecasting: Forecasting (X12 830, EDIFACT DELFOR)->GET_VENDOR_FORECASTING_REPORT

The new Vendor Retail Analytics Reports offer a collection of reports which share time series data for a vendor’s business, including the historical sale, traffic, inventory, and forecast metrics.

  • Vendor Sales Report
  • Net Pure Product Margin Report
  • Vendor Traffic Report
  • Vendor Forecasting Report
  • Vendor Inventory Report

Like Brand Analytics Reports, Vendor Retail Analytics reports are only available to vendors with the Brand Analytics Selling Partner role.

Vendor Inventory Report: Inventory Health

Monitor the health of the inventory levels of your products through weekly updates; quickly identify and respond to unfavorable trends.

Vendor Forecasting Report: Forecast and Inventory Planning

Prevent replenishable out-of-stock revenue losses with data-driven inventory planning

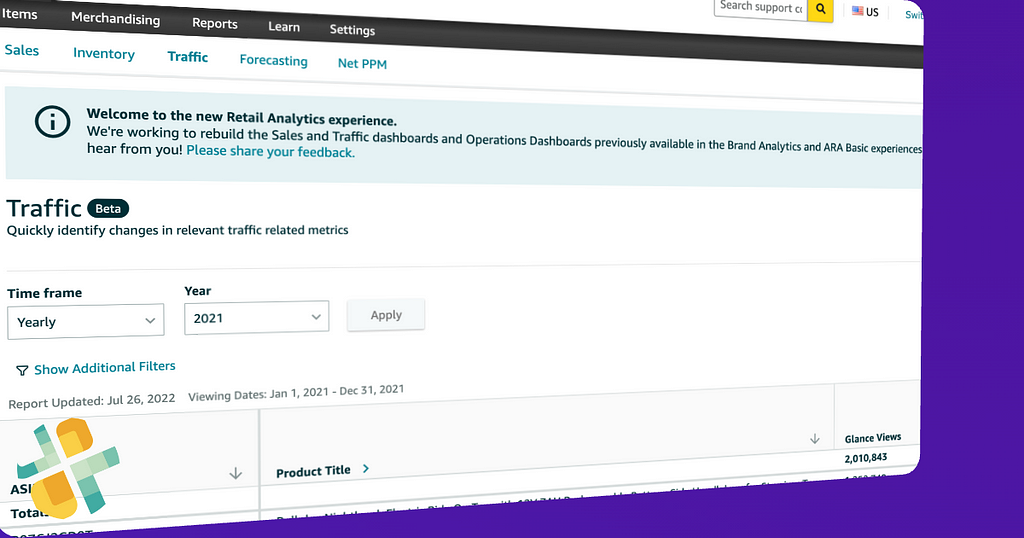
Vendor Traffic Report: Traffic Diagnostic

The Traffic Diagnostic Report gives you insight into your web presence and helps you understand your online performance.

Here is how Amazon describes this;

Quickly identify changes in a) glance views and b) conversion by viewing prior period, previous year, and industry benchmark.

You’ll learn whether your products are selling well or not. You’ll find out if you’re losing customers because your prices are too high or too low. And you’ll discover whether you’re getting enough exposure or not.

Vendor Sales Report: Sales Diagnostic

Quickly identify opportunities by determining what is contributing to sales performance.

Net Pure Product Margin Report or Net PPM

You can quickly identify which products contribute to profitability by looking at: a) Net PPA, b) a percentage of total revenue, c) prior period d).

For more information on Vendor Retail Analytics reports, see Amazon Selling Partner Report Type docs.

Summary

Vendor Central’s move to SP-API opened new opportunities for merchants to use data for insight-driven business decisions. It is easier than ever to create a complete, trusted picture of your Amazon business. You can use data to forecast demand, determine where to allocate resources, or how best to maximize profit. You can also identify trends in buying patterns and analyze customer preferences.

Unlocking data allows you to create a tailored, private Amazon Vendor Central dashboard, visualization, or report specific to your needs;

  1. Unify your Vendor Reports into a leading data lake or cloud warehouses like Amazon Redshift, Amazon Redshift Spectrum, Google BigQuery, Snowflake, Azure Data Lake, Ahana, and Amazon Athena for a unified, analytics-ready single source of truth to fuel informed decisions on product, media, and customer demand
  2. Use an industry-leading analytics tool like Google Data Studio, Tableau, Microsoft Power BI, Looker, Amazon QuickSight, SAP, Alteryx, dbt, Azure Data Factory, Qlik Sense, and many others to turn manual monthly reports into automated, rapid business reports that ensure your team has immediate access to actionable insights. Create customized traffic dashboards, track spending on advertising campaigns, or additional reports that allow you to build competitive intelligence.
  3. With data unified and accessible, quickly optimize for poor conversion rates, identify gaps in operational performance, uncover the percentage of customers converting, refining advertising efforts on and off Amazon, or discover key customer metrics that impact purchase decisions.

Get Started Automating Vendor Central Reports — For Free

Openbridge offers code-free data automation, one of the most powerful tools Vendors can tap into. Automation accelerates performance the speed at which your team can gain valuable insights to deliver data-driven growth and profit.

>> Sign up for a 30-day free trial of our Amazon Vendor Central automation

Frequently Asked Questions

How do I qualify for Brand Analytics?

  • You must be a Brand Owner enrolled in Brand Registry, be internal to the Brand, and be responsible for selling the Brand on Amazon.
  • Enrollment in Brand Registry will become a prerequisite for Vendors to qualify for Brand Analytics on April 1, 2020; vendors who had access to ARA Premium as of January 31, 2020, will have access to Brand Analytics until April 1 regardless of their enrollment status.
  • Access to Brand Analytics is subject to all applicable Terms and Conditions.

What is Brand Registry, and how do I enroll?

  • Brand Registry helps you protect your intellectual property and create a real and trusted experience for customers on Amazon.
  • To learn more about Brand Registry, its benefits, and eligibility requirements, visit the Brand Registry website: www.brandregistry.com

What information is provided in Brand Analytics?

  • Access to years’ worth of data within custom date ranges.
  • Sales data by a particular state, province, or postal code.
  • Top search terms across Amazon.
  • Products customers purchased after viewing your products.
  • Products customers purchased at the same time as purchasing your products.
  • Unique and repeat purchase data.

What if I’m not a Brand Owner?

Vendors who are not Brand Owners or are Brand Owners not enrolled in Brand Registry will retain access to Amazon Retail Analytics Basic (ARA Basic) for their data and reporting needs.

How do I access sales information for my products?

Sales information can be accessed through the “Sales Diagnostic” report accessible in the reports pane on the left-hand side of the page. You can also use the metric locator to locate all available metrics.

How do I find the metrics that I’m looking for?

Here’s a map of the metrics currently available on the site.

Can I access historical data?

Yes. Historical data limits may vary by report. Though we cannot accommodate special historical data requests, you can modify the reporting range filters in reports to access historical data.

Can vendors get the same return reports, ledger reports, or active listings report that sellers have?

Unlike Amazon Seller Central, there are no seller-fulfilled orders direct to customers. As a result, certain information is not available to vendors. The reports detailed earlier outline the current collection of available reports.

Is there an Amazon Vendor Central Sales report?

Yes, we detailed those options above

Does Amazon Brand Analytics Vendor Central offer the same reports as Sellers?

Yes, there is parity between Vendors and Sellers.

Is there an Amazon Vendor Central API integration? What about the legacy EDI Amazon Vendor Central Service?

Yes, see our post Unlocking Amazon Vendor Central Data With New API for a deep dive into the new API.

Where can I learn more about Amazon advertising reports?

Amazon provides a robust collection of documents for the Amazon Advertising API.


Secret To Unlocking Amazon Vendor Central Reports was originally published in Openbridge on Medium, where people are continuing the conversation by highlighting and responding to this story.


from Openbridge - Medium https://ift.tt/QvOnBIj
via IFTTT

How To Export Inventory From Amazon

Inventory Report Exports

Automation or Manual Downloads; Exporting Inventory Reports

An inventory report lets you know exactly how many items are listed for sale on Amazon. You can use it to compare your current inventory to your previous inventory reports, or even to find out if you’re selling too much or too little.

As customers can buy your products at any time of day, the quantities in an Inventory Report are at best a spot-check of your saleable inventory at that moment. It may be out of date almost as soon as you request it. Check your Amazon orders and inventory reports against your own inventory records to determine whether there are any discrepancies.

Manual Inventory Exports or Code-free Inventory Report Automation?

Manual downloads are accessible, simply log into you're Seller Central account and download.

Automation ensures your team can skip the manual data wrangling and take control of your Inventory data and store it in a private data lake, or cloud warehouses such as Snowflake, BigQuery, Amazon Athena, Redshift, Azure Data Lake. Your team can then leverage best-in-class analytics and business tools like Tableau Looker, Power BI, and Google Data Studio to fuel Amazon analytics via custom reports, interactive graphs, and sales dashboards

Manual: Request and download an inventory report

In your Seller Central account, go to Inventory and select Inventory Reports.

  • Select the report type from the drop-down menu.
  • Click the Request Report button. Reports generally take 15 to 45 minutes to generate. You can return to this page later to pick up your completed report.
  • Under Check Report Status & Download, when the report status is “Ready”, click the Download button.

This approach will get your inventory into spreadsheet format. It is not an approach that scales, as it can get tiring, cumbersome, and messy manually downloading and managing report downloads. If you were attempting to manually download all these reports, it would take hours and result in many inventory files every day

How can you avoid the messy, manual report download process? A code-free, fully-automated inventory tool.

Automated Pipelines To A Database Program

Tapping into the Amazon Selling API is a must for automating that workflow. An automated data connector leverages the Amazon SP-API for automated, code-free data pipeline inventory reports.

Automation ensures your team will;

  1. Unify all Inventory report types data into industry standard data destinations like Amazon Redshift, Amazon Redshift Spectrum, Google BigQuery, Snowflake, Azure Data Lake, and Amazon Athena.
  2. With Inventory data consolidated, use your favorite business intelligence, data visualization, SQL, or data science tools like Google Data Studio, Tableau, Microsoft Power BI, Looker, or Amazon Quicksight?

Automation allows you to efficiently consolidate and unify inventory data quickly and consistently, allowing you to create a snapshot inventory history over a longer time horizon.

Which report in inventory reports is right for you?

As customers can buy your products at any time and your inventory levels can fluctuate, your inventory levels and stock state can vary. As a result, Amazon offers different types of reports to help you effectively and efficiently get the insights you need to optimize your business operations.

Inventory report

The Inventory Report gives you access to information about your listings, such as item descriptions, prices, quantities, and availability. This report helps you manage your inventory levels and make any necessary adjustments.

You can use the Inventory Report to reconcile your Amazon listings with your available stock and your record keeping. This is a good method for checking the accuracy of your own system.

Open Listings report

This report contains any currently active merchant-fulfilled open listing(s) available for purchase at the moment you request the report. Amazon-fulfilled items are not included in this list. You can modify and edit the spreadsheet, and then load it into Inventory Manager using the Inventory Loader tool.

Active Listings report

Amazon provides a tool called Active Listings that allows sellers to see how many times their listing has been viewed within 24 hours of being listed. This report shows you exactly what those views look like.

This report shows you all the products you’ve listed on Amazon at the moment the report is run. This report includes all your products, including those with no quantity. It also provides you information about the products your listing is matched to on Amazon, which includes the product title and product ID.

This report shows products with no stock available. You can keep selling those items by reordering them from Amazon.com without having to submit new product data or create a new SKU. You can remove the SKU from your reports if you’re not planning to offer the product again or if you’ve already deleted the product from your store.

You can use this information to make sure your listing is up to date. If it isn’t, submit the missing items to ensure that it gets added to your inventory.

Inactive Listings report

This report is similar to the Active Listings report, except it provides a snapshot of all products that are inactive. This includes listings that have zero (0) quantity, listings that are blocked, listings that are suppressed, listings that are not yet opened, and listings that are past their sale end date.

All Listings report

The All Listings report helps you find out what’s happening with your listings. You can use it to check whether your listings are active, inactive, or missing information. If there is something wrong with one of your listings, you can fix it quickly.

You can access this report by clicking on the “Reports” tab, selecting “All Listings” under the “Lists & Reports” section, and then clicking on the “All Listings Report” button.

This report gives you a snapshot of how many listings are active, inactive, and missing information. It also lists the number of listings that are active, inactive, and incomplete.

If you want to know why some listings are inactive, you can click on the “Inactive” link next to each listing. This will take you to a list of reasons why the listing is inactive.

Referral Fee Preview report

This report provides information about listings currently available for sale. For each listing, Amazon will provide an estimate of the referral fee based on your listed item price. We don’t take into account any additional fees charged by Amazon at the time of purchase (such as shipping or gift wrapping).

Canceled Listings report

This report contains all the listings that Amazon has canceled. It does not include any items that are sold out or purged with Inventory Loaders or canceled by the seller

Get Started — For Free

Direct, automated access to Inventory data gives you everything you need to accelerate your Seller Central business.

Export inventory from Amazon today! Sign up for a 30-day free trial of our fully-automated Inventory tool for data!


How To Export Inventory From Amazon was originally published in Openbridge on Medium, where people are continuing the conversation by highlighting and responding to this story.


from Openbridge - Medium https://ift.tt/WEq9KzC
via IFTTT

Amazon Brand Analytics Search Terms: Untapped Potential

Amazon Brand Analytics Report

Making smarter decisions with direct, automated access to Amazon search data

To make your products appear in Amazon search results, Seller Central and Vendor Central merchants need to provide keywords that potential customers might use when searching for a product they want to buy.

Keywords are the words search engines use to match an ASIN with a query — in this post, keywords mean terms entered by sellers into search terms fields when they list or update an ASIN.

As a result, keywords are critical to an effective and efficient marketing strategy that improve organic rankings, enhances product listings, and drives product sales.

This post will show you how to harness the power of using the Amazon Seller Central search term report to supercharge your private keyword tool for Amazon retail analytics.

First, we will cover the broader category the search falls under, Brand Analytics. Next, we will dig into the Search Term Report data.

What is Amazon Brand Analytics?

Amazon Brand Analytics provides brands with insights into how customers perceive their brand. This includes understanding the impact of Amazon reviews, products, price changes, and promotions. Brands can use this information to improve their overall consumer experience.

Brands can see where their customers spend most of their time online, including browsing, searching, buying, watching videos, reading reviews, and sharing. They can also track whether people shop during prime times, holidays, weekends, or weekdays. These insights help brands understand how people interact with their brands across different channels.

Amazon Brand Analytics helps businesses make better decisions based on data rather than gut instinct. For example, it allows companies to identify trends such as seasonal fluctuations, how much money people spent per purchase, and how many purchases occurred on mobile devices versus desktop computers.

The search data report will help brands understand how people use Amazon to discover products. It includes keyword data from searches conducted on Amazon. It provides insight into the types of queries that lead people to specific product categories and subcategories.

The report includes information about the following areas:

- Keywords used to find products

- Product category and subcategory terms

- Number of times each term was searched

- Average position of each term within the search results

- Percentage of total searches performed on Amazon.com

Amazon Search Terms Report

Direct Amazon supplied search data reflects real customer shopping behavior. Access to customer behavior via the Amazon Brand Analytics Search Terms report offers critical shopper Insights.

What is the Amazon Brand Analytics Search Terms report?

Under your Amazon Brand Analytics Reports is a treasure trove report called the Amazon Search Terms report. This report provides insight into search-related customer behavior on Amazon. This tool lets you see how often particular keywords are searched for within Amazon. You can view the data for specific terms, categories, or regions. For example, you could look up how many times “iPhone XR” was searched for in the United States. Or you could check out how frequently “Amazon Alexa” is used in Canada.

You can filter the data based on date range, location, product type, and device type. When viewing the data for a particular term, you’ll notice that there are three columns:

• Total searches — How many total searches were performed for the given keyword.

• Average position — The average position for each item that had a match for the given keyword. If multiple items were matched, the average position is calculated across all those items.

• Items clicked — How many items had a match for the keyword.

If you want to know how often a keyword is searched for, it makes sense to focus on the number of total searches. However, if you’re interested in learning whether a keyword is being searched for more now than in the past, you might want to pay attention to the average position. And if you’re curious about how much traffic a keyword generates, you’d probably like to keep tabs on the number of clicked items. This is critical data for a robust competitive keywords strategy.

In addition to providing insights into how people interact with Amazon.com, the Search Terms report gives you access to historical data. So if you want to find out how often a keyword was searched for in the past, you can select a date range and start searching.

Amazon Search Term Report Metrics and Dimensions

The report will contain performance metrics for individual search terms that reflect the actual buying behavior of Amazon customers resulting from billions of searches. The metrics and dimensions in the report provide performance metrics that fuel invaluable insights for more intelligent business decisions.

Below are the essential metrics and dimensions in the data:

  • The numeric rank of search
  • The popular search terms by category (department)
  • The sales volume of products
  • The current market share of a product and category
  • The conversion rate for the product and keyword
  • The percentage of conversions
  • The percentage of sales
  • The product title is associated with a keyword

Data is broken down into 4 date dimensions, DAY, WEEK, MONTH, and QUARTER, allowing for trending exact search volume over a more extended period of time.

What is search frequency rank?

Search frequency ranks are an essential indication for sellers looking into keyword data. They provide insight into how much traffic you can expect to receive for each keyword over time.

Hundreds of thousands of keywords are available in the weekly search frequency report. This includes both broad match and exact match searches. You can see how many times people searched for a specific phrase and what percentage of those searches came up during the previous week.

The search frequency rank is based on the average search volume per day. The lower the number, the less likely someone is to search for that particular term.

What are click share and conversion share?

Click share gives you an idea about how many times a visitor clicked on one of the listings. Conversion share tells you how many visitors converted into sales. This information helps you understand what percentage of people who see your listing end up buying it. These are essential cues to how a specific competitor’s product may perform.

Get Started — For Free

Direct, automated access to first-party search data gives you everything you need to create a private Amazon Brand Analytics Tool for your business. Create reports that provide valuable insights into current search trends and actionable insights to shape advertising decisions or traffic diagnostic information for your marketing channels.

Openbridge offers an automated, code-free data connector for Amazon Brand Analytics Search Terms. You can have;

  1. Unified search term data into industry-leading data destinations like Amazon Redshift, Amazon Redshift Spectrum, Google BigQuery, Snowflake, Azure Data Lake, and Amazon Athena.
  2. With search term data consolidated, use your favorite business intelligence, data visualization, SQL, or data science tools like Google Data Studio, Tableau, Microsoft Power BI, Looker, or Amazon Quicksight?

Tap into new audience insights, optimize advertising activities or marketing campaigns, or discover competitor insights that accelerate your sales growth.

Sign up for a 30-day free trial of our fully-automated Amazon Search Term data pipeline today!

The Amazon Brand Analytics Search Terms are available to both Amazon Vendor Central and Seller Central.

References:


Amazon Brand Analytics Search Terms: Untapped Potential was originally published in Openbridge on Medium, where people are continuing the conversation by highlighting and responding to this story.


from Openbridge - Medium https://ift.tt/ueWLpAj
via IFTTT

Amazon Advertising Webinar: Data Connectors

Unifying your marketing and retail analytics with TapClicks and Openbridge

Are you stuck manually downloading and managing 100s reporting of spreadsheets across your clients? Is campaign reporting time-consuming, expensive, and error-prone?

If you answered “yes!”, join us for a live webinar where we will show you how to start harnessing the power of automation using the Amazon Advertising API.

This Amazon Advertising Webinar will cover;

Amazon Advertising Webinar Event Date and Time

This event is hosted by Amazon Advertising, with Thomas Spicer, Founder, and CEO of Openbridge participating. The webinar will take place in the following location:

  • Locale: North America
  • Level: All
  • Audience Category: Sellers, vendors, and independent agencies
  • Product focus: Solution providers
  • Partner Name: TapClicks and Openbridge
  • Partner Type: Tool provider
  • Date: July 19, 2022
  • Time: 1:00 PM ET

Register For The Webinar Today!

Look forward to seeing you there!


Amazon Advertising Webinar: Data Connectors was originally published in Openbridge on Medium, where people are continuing the conversation by highlighting and responding to this story.


from Openbridge - Medium https://ift.tt/o02x9CU
via IFTTT